
Continuous, Emission and Absorption Spectra: HSC Physics
Learn how continuous, emission and absorption spectra form, why atomic energy levels create spectral lines, and how to distinguish each type in HSC Physics.
A glowing filament and a low-pressure hydrogen tube can both look bright, but a spectroscope shows something very different. The filament gives a smooth band of colours. Hydrogen gives a few sharp lines with black gaps between them. Put suitable hydrogen gas in front of a bright continuous source, and some of those same wavelengths can instead appear as dark lines.
Before going further, predict what controls the pattern. Is it simply how hot the source is, or does the arrangement of matter matter as well? The second answer is the important one. A spectrum depends on how photons are produced, absorbed, and re-emitted by the material you are looking at.
01What a spectrum actually shows
A spectroscope or spectrometer separates incoming electromagnetic radiation by wavelength. Instead of seeing all the light mixed together, you can ask how much intensity arrives at each wavelength.
That gives three common patterns:
| Spectrum type | What you see | Typical physical situation |
|---|---|---|
| Continuous spectrum | A smooth range of wavelengths with no narrow gaps | Hot, dense or optically thick matter |
| Emission line spectrum | Bright lines at particular wavelengths against a darker background | Excited, low-density gas |
| Absorption line spectrum | Darker lines within an otherwise continuous spectrum | Continuous light passing through cooler, low-density gas |
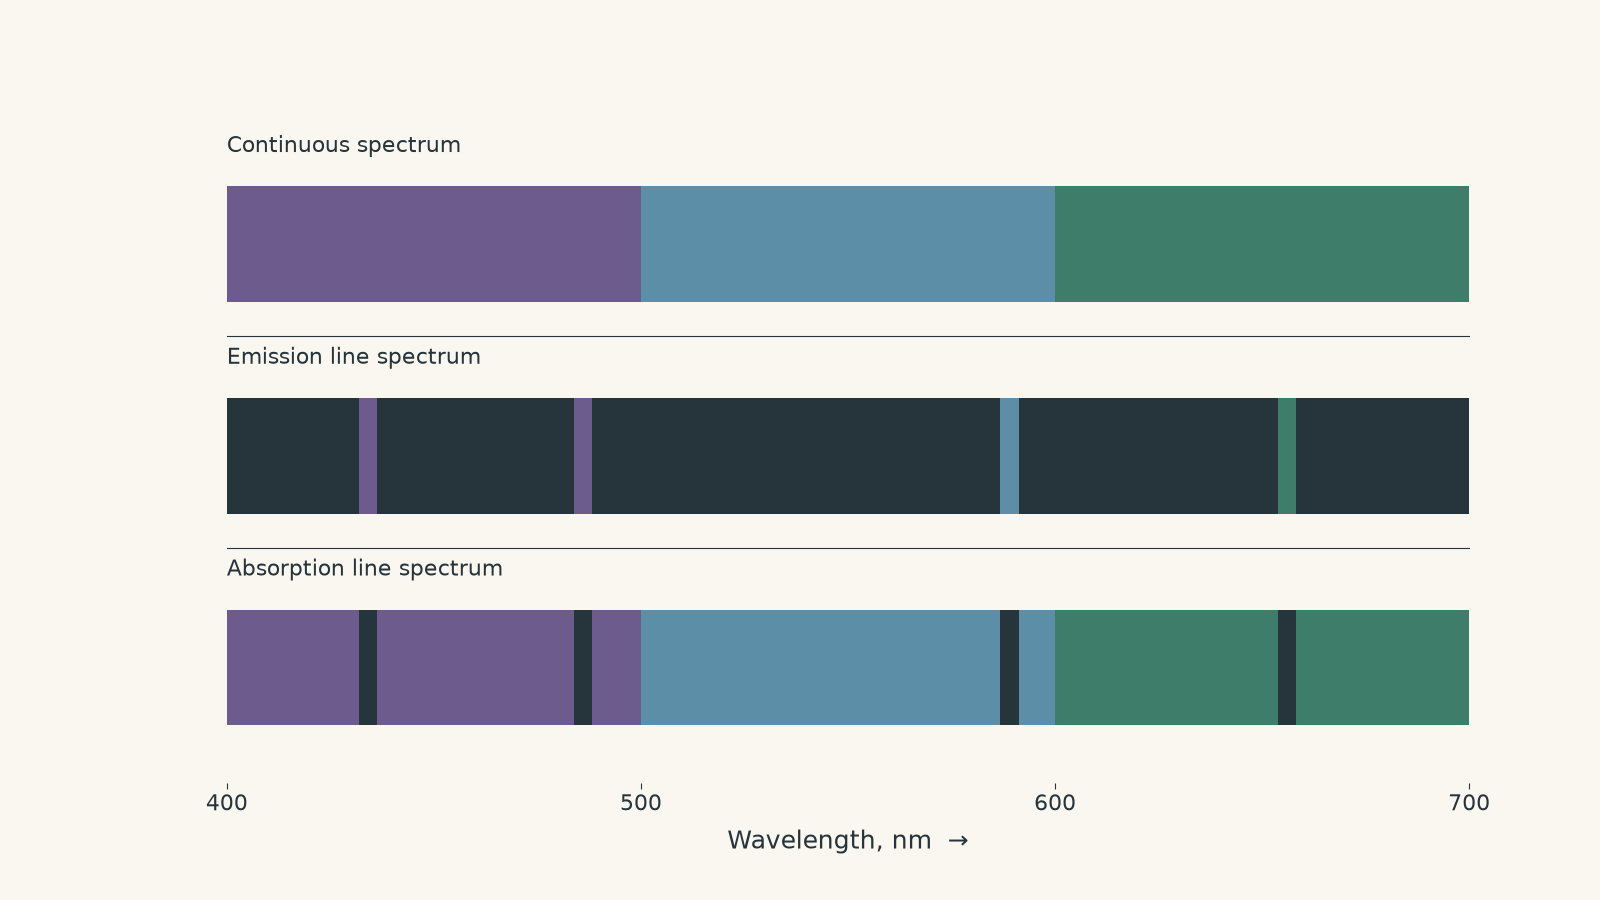
The table is a useful HSC decision rule, but it is only the first model. Real astronomical spectra can contain a continuum, emission lines, and absorption lines at the same time. We need to understand why each feature appears before that stops being confusing.
02Continuous spectra: why there are no obvious gaps
Imagine heating a metal filament until it glows. At first it looks dull red. Heat it further and it becomes much brighter, with radiation spread across a broad range of wavelengths.
A spectrometer does not find a handful of isolated wavelengths. It finds a smooth distribution.
That is a continuous spectrum.
The useful HSC model is that hot, dense matter produces a continuous thermal spectrum. Solids and liquids commonly do this, as can sufficiently dense or optically thick gases and plasmas.
The word continuous does not mean every wavelength has the same intensity. It means the intensity changes smoothly rather than consisting of isolated narrow lines. A thermal source might emit much more strongly around some wavelengths than others.
There is also a limit to the simple explanation that “lots of atoms make lots of lines”. Dense matter is not just a bag of perfectly isolated atoms. Particles interact strongly, collisions are frequent, energy states are broadened, and many emission and absorption processes overlap. Treating the source as an approximately thermal emitter is more useful than trying to track isolated atomic transitions.
That is why a hot dense source can produce a smooth continuum while a thin gas can produce sharp lines.
03Emission spectra: why a thin gas chooses particular wavelengths
Now take a low-pressure gas and supply energy to it. An electrical discharge through a gas tube is a common example.
Collisions can transfer energy to atoms. Their electrons enter higher-energy quantum states. These states are called excited states.
Here is the strange part: electrons in an atom cannot have just any bound energy.
Picture a lift that stops only on floors 1, 3, and 8. You can stand on one of those floors, but not at floor 4.62 because you feel like it. Atomic energy levels behave similarly: only particular quantum states are allowed.
The analogy breaks because an electron is not a little ball physically sitting at a height inside the atom. The “floors” represent allowed energy states, not literal positions.
When an excited atom moves from a higher energy state to a lower one, the lost energy is carried away by a photon.
If the energy difference between the two states is \(\Delta E\), the emitted photon has energy
\[
E_{\text{photon}}=\Delta E=hf=\frac{hc}{\lambda}
\]
where:
- \(E_{\text{photon}}\) is the photon energy in joules, J
- \(h\) is Planck’s constant, \(6.626\times10^{-34}\ \text{J s}\)
- \(f\) is the photon frequency in hertz, Hz
- \(c\) is the speed of light, approximately \(3.00\times10^8\ \text{m s}^{-1}\)
- \(\lambda\) is the wavelength in metres, m.
So each allowed energy difference produces a particular wavelength.
This is the origin of an emission line spectrum. Instead of producing every wavelength smoothly, isolated atoms repeatedly emit photons corresponding to particular energy gaps.
If the relationship \(c=f\lambda\) needs refreshing, Maxwell’s Prediction of Electromagnetic Waves: HSC Physics connects the wave properties of light to electromagnetic theory.
Worked example: Find the wavelength of an emitted photon
A hydrogen atom has an electron initially at an energy of \(-0.85\ \text{eV}\). It falls to a lower state at \(-3.40\ \text{eV}\). Calculate the wavelength of the emitted photon. Use \(1\ \text{eV}=1.602\times10^{-19}\ \text{J}\).
Step 1
The electron moves from \(-0.85\ \text{eV}\) to \(-3.40\ \text{eV}\), so the energy released is
\[
\Delta E=(-0.85)-(-3.40)=2.55\ \text{eV}
\]
Convert this to joules:
\[
\Delta E=(2.55)(1.602\times10^{-19})
=4.09\times10^{-19}\ \text{J}
\]
Step 2
Using
\[
\Delta E=\frac{hc}{\lambda}
\]
we rearrange:
\[
\lambda=\frac{hc}{\Delta E}
\]
Substitute:
\[
\lambda=
\frac{(6.626\times10^{-34})(3.00\times10^8)}
{4.09\times10^{-19}}
=4.86\times10^{-7}\ \text{m}
\]
Therefore,
\[
\lambda=486\ \text{nm}
\]
The atom emits a photon with a wavelength of about \(486\ \text{nm}\). In an excited low-density hydrogen gas, many atoms undergoing this transition can produce a bright spectral line around that wavelength.
Notice what the calculation really says: the line position is not chosen by the spectroscope. It is fixed by the atom’s energy-level structure.
04Absorption spectra: why bright light develops dark lines
Now put low-density gas between you and a continuous light source.
Predict what happens to a photon whose energy exactly matches one of the gas atom’s allowed upward energy transitions.
The atom can absorb the whole photon. Its electron moves to a higher allowed energy state.
A bound electron does not normally absorb a photon merely because the photon has “enough” energy. For a bound-to-bound transition, the photon energy must match the energy difference:
\[
\Delta E=hf=\frac{hc}{\lambda}
\]
A common mistake is to imagine that an atom needing \(2\ \text{eV}\) could absorb a \(3\ \text{eV}\) photon and keep the spare \(1\ \text{eV}\) like change from a shop. Photons do not work that way. For the simple bound transition, the whole photon is absorbed or it is not.
There are other processes, such as ionisation, where the physics is different. We are focusing here on the discrete bound-state transitions responsible for line spectra.
So light passes through the gas, but photons at selected wavelengths are preferentially removed from the beam reaching the observer.
The result is an absorption spectrum: a continuous background with reduced intensity at particular wavelengths.
But doesn’t the atom give the photon back?
Usually, yes.
An atom that absorbs a photon and becomes excited does not necessarily stay excited. It may later return to a lower state and emit another photon.
So why is the original line dark?
Because the re-emitted photon does not have to travel towards your detector.
Imagine one narrow beam from a star heading towards your telescope. A gas atom absorbs a photon from that beam. When the atom later emits radiation, the new photon might head left, right, backwards, or towards another part of space.
Some radiation can also be emitted towards you, so an absorption line is not generally a perfectly black gap. It is simply less intense than the nearby continuum.
The key idea is direction. Photons have been removed from your particular line of sight faster than they are replaced in that line of sight.
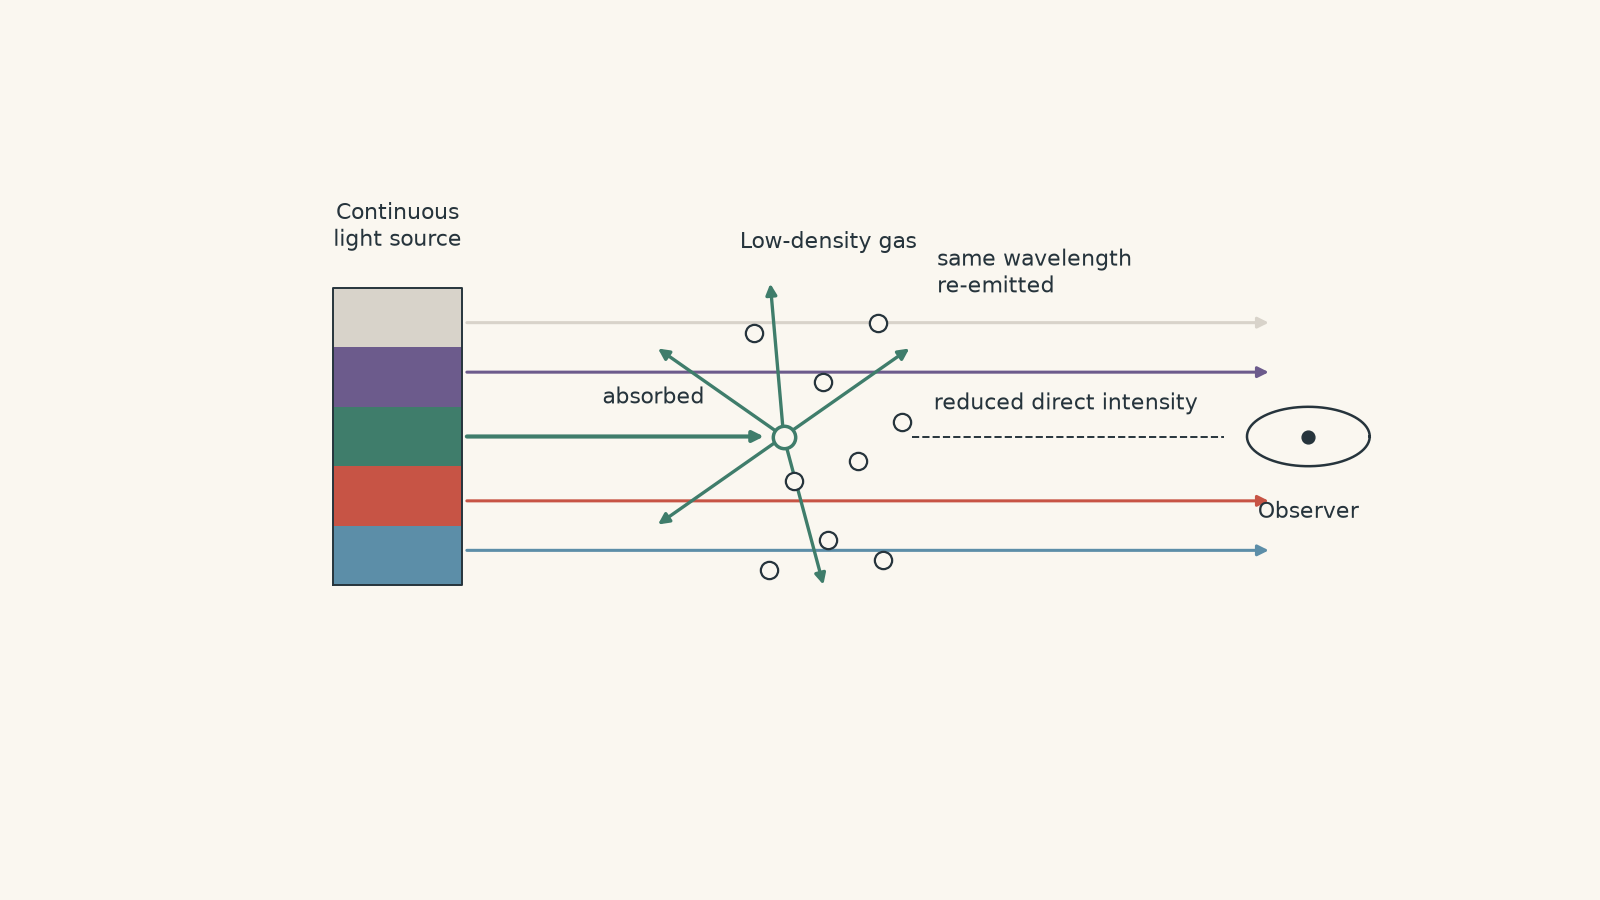
This is also why “cool gas” is a relative statement. The gas does not have to feel cold. It needs to have suitable populations of atoms in lower energy states and produce less radiation towards us at those wavelengths than the brighter background source provides.
05Why emission and absorption lines can occur at the same wavelengths
Suppose two atomic states are separated by an energy \(\Delta E\).
For absorption, the atom can move upwards:
\[
E_{\text{lower}}+\frac{hc}{\lambda}=E_{\text{upper}}
\]
For emission, it can move downwards:
\[
E_{\text{upper}}-E_{\text{lower}}=\frac{hc}{\lambda}
\]
The same energy gap appears in both equations.
So a particular transition can produce an absorption line and an emission line at the same wavelength.
What changes is the situation:
- if photons are being added to your line of sight at that wavelength, you can see an emission line
- if photons are being removed from a brighter background beam, you can see an absorption line.
There is one important qualification. An atom can only absorb from the energy state it currently occupies. If nearly every atom is in its ground state, transitions beginning from an excited lower state will produce little or no absorption even if the corresponding downward transition can appear in an emission spectrum.
Worked example: Which absorption line can the detector see?
A low-density gas has three energy levels:
\[
E_0=0,\qquad
E_1=2.10\times10^{-19}\ \text{J},\qquad
E_2=4.60\times10^{-19}\ \text{J}
\]
Nearly all atoms initially occupy \(E_0\). Continuous light passes through the gas. A detector records wavelengths from \(400\ \text{nm}\) to \(700\ \text{nm}\).
Assume all downward transitions are allowed. Determine which absorption line the detector can observe. Then find the possible wavelengths emitted by an atom initially excited to \(E_2\).
Step 1
For \(E_0\rightarrow E_1\),
\[
\Delta E=2.10\times10^{-19}\ \text{J}
\]
so
\[
\lambda=
\frac{hc}{\Delta E}
=
\frac{(6.63\times10^{-34})(3.00\times10^8)}
{2.10\times10^{-19}}
=9.47\times10^{-7}\ \text{m}
\]
Therefore,
\[
\lambda=947\ \text{nm}
\]
That lies outside the detector’s \(400\)-\(700\ \text{nm}\) range.
For \(E_0\rightarrow E_2\),
\[
\lambda=
\frac{(6.63\times10^{-34})(3.00\times10^8)}
{4.60\times10^{-19}}
=4.32\times10^{-7}\ \text{m}
\]
Therefore,
\[
\lambda=432\ \text{nm}
\]
The detector can therefore observe an absorption line at about \(432\ \text{nm}\).
Step 2
A direct transition \(E_2\rightarrow E_0\) releases
\[
4.60\times10^{-19}\ \text{J}
\]
and therefore emits \(432\ \text{nm}\) light.
A transition \(E_2\rightarrow E_1\) releases
\[
\Delta E
=(4.60-2.10)\times10^{-19}
=2.50\times10^{-19}\ \text{J}
\]
so
\[
\lambda=
\frac{(6.63\times10^{-34})(3.00\times10^8)}
{2.50\times10^{-19}}
=7.96\times10^{-7}\ \text{m}
=796\ \text{nm}
\]
If the atom takes that route, it can then fall from \(E_1\rightarrow E_0\), producing the \(947\ \text{nm}\) photon calculated earlier.
So an atom initially at \(E_2\) could emit photons at \(432\ \text{nm}\), or it could emit a \(796\ \text{nm}\) photon followed by a \(947\ \text{nm}\) photon.
This example exposes a useful trap: the list of possible emission lines does not automatically equal the list of strong absorption lines. Absorption also depends on which lower energy states are populated before the photons arrive.
06A compact way to distinguish the three spectra
When an exam gives you a source and asks what spectrum it produces, do not memorise colours. Follow the physical path of the light.
| Situation | What happens to photons? | Expected spectrum |
|---|---|---|
| Hot, dense or optically thick source | Radiation is produced across a broad range of wavelengths | Continuous |
| Excited low-density gas viewed without a much brighter background | Atoms make downward transitions and add photons at selected wavelengths | Emission lines |
| Continuous source viewed through suitable cooler, low-density gas | Atoms remove selected wavelengths from the direct beam | Absorption lines |
The density condition matters. Sharp atomic lines are easiest to see when atoms behave sufficiently independently that their discrete transitions remain distinguishable.
The geometry matters too. The same gas cloud might look like an absorbing cloud when you look through it towards a bright star, but like an emitting cloud when you view it from the side against dark space.
07The misconceptions that cause most mistakes
| Tempting idea | What actually happens |
|---|---|
| A continuous spectrum has equal intensity at every wavelength. | Its intensity can vary strongly with wavelength. It is continuous because there are no isolated narrow gaps between neighbouring wavelengths. |
| A dark absorption line means absolutely no photons of that wavelength reach us. | It usually means fewer photons arrive than at nearby wavelengths. |
| An atom absorbs any photon with more energy than the required gap. | For a simple bound-to-bound transition, the photon energy must match an allowed energy difference. |
| Absorbed photons vanish permanently. | Excited atoms can re-emit radiation. The important issue is where the re-emitted photons travel. |
| Every possible emission line must also be a strong absorption line. | Absorption requires atoms to occupy the appropriate lower state before the photon arrives. |
| A particular element always gives lines at exactly the same observed wavelengths. | The intrinsic transition wavelengths are fixed, but relative motion can Doppler-shift the whole observed pattern. |
That last point becomes particularly useful in astronomy. The pattern identifies the atomic transitions; a shift of the pattern can reveal motion.
08Questions and solutions
Question 1
Three sources are observed through a spectroscope.
- Source A is a hot tungsten filament.
- Source B is a low-pressure gas excited by an electrical discharge and viewed against a dark background.
- Source C is a bright continuous source viewed through a cooler, low-density gas.
Identify the main spectrum expected from each source and explain its physical origin.
Solution 1
Source A produces a continuous spectrum, Source B produces an emission line spectrum, and Source C produces an absorption line spectrum.
The hot tungsten filament is dense matter undergoing thermal emission, so its radiation extends smoothly across a broad range of wavelengths.
The excited low-pressure gas contains atoms whose electrons make transitions from higher to lower energy states. Each allowed energy difference produces photons of particular wavelengths, giving bright emission lines.
For Source C, the background source first provides a continuum. Atoms in the foreground gas then absorb photons whose energies match allowed upward transitions. Those wavelengths arrive at the observer with reduced intensity, producing absorption lines.
A common mistake is to decide only from whether something is “hot”. Temperature matters, but density, atomic energy levels, and the position of the gas relative to the background source determine the observed spectrum.
Question 2
An atom has three energy levels:
\[
E_0=0,\qquad E_1=2.0\ \text{eV},\qquad E_2=4.5\ \text{eV}
\]
Assume all downward transitions are allowed.
- Determine the possible wavelengths in its emission spectrum.
- The same gas is now cool enough that almost all atoms are in \(E_0\). Continuous visible light from \(400\ \text{nm}\) to \(700\ \text{nm}\) passes through it. Determine which absorption line should be visible.
Use \(1\ \text{eV}=1.60\times10^{-19}\ \text{J}\), \(h=6.63\times10^{-34}\ \text{J s}\), and \(c=3.00\times10^8\ \text{m s}^{-1}\).
Solution 2
The possible emission wavelengths are approximately \(622\ \text{nm}\), \(497\ \text{nm}\), and \(276\ \text{nm}\), while the cool gas produces only the \(622\ \text{nm}\) absorption line within the stated visible range.
For \(E_1\rightarrow E_0\),
\[
\Delta E=(2.0)(1.60\times10^{-19})
=3.20\times10^{-19}\ \text{J}
\]
so
\[
\lambda=
\frac{hc}{\Delta E}
=
\frac{(6.63\times10^{-34})(3.00\times10^8)}
{3.20\times10^{-19}}
=6.22\times10^{-7}\ \text{m}
=622\ \text{nm}
\]
For \(E_2\rightarrow E_1\),
\[
\Delta E=(4.5-2.0)\ \text{eV}=2.5\ \text{eV}
\]
\[
\Delta E=(2.5)(1.60\times10^{-19})
=4.00\times10^{-19}\ \text{J}
\]
Therefore,
\[
\lambda=
\frac{(6.63\times10^{-34})(3.00\times10^8)}
{4.00\times10^{-19}}
=4.97\times10^{-7}\ \text{m}
=497\ \text{nm}
\]
For \(E_2\rightarrow E_0\),
\[
\Delta E=(4.5)(1.60\times10^{-19})
=7.20\times10^{-19}\ \text{J}
\]
giving
\[
\lambda=
\frac{(6.63\times10^{-34})(3.00\times10^8)}
{7.20\times10^{-19}}
=2.76\times10^{-7}\ \text{m}
=276\ \text{nm}
\]
All three wavelengths are possible in emission because atoms already occupying higher states can make each of those downward transitions.
For absorption, however, almost all atoms start in \(E_0\). They can therefore absorb photons for \(E_0\rightarrow E_1\) at \(622\ \text{nm}\) and \(E_0\rightarrow E_2\) at \(276\ \text{nm}\).
Only \(622\ \text{nm}\) lies within the given \(400\)-\(700\ \text{nm}\) visible range.
The tempting mistake is to predict an absorption line at \(497\ \text{nm}\) simply because there is an emission line there. That transition begins at \(E_1\), but the question states that almost all atoms are in \(E_0\).
Question 3
A star has an otherwise smooth continuous spectrum but shows a strong absorption line at \(589\ \text{nm}\).
Student A says, “The interior of the star must not produce \(589\ \text{nm}\) photons.”
Student B says, “The atmosphere absorbs those photons and later re-emits them, so there should be no dark line.”
Calculate the energy difference associated with the \(589\ \text{nm}\) transition, and explain the flaw in each student’s argument.
Solution 3
The transition energy is approximately \(3.38\times10^{-19}\ \text{J}\), and both students have missed part of the light’s path through the star.
Using
\[
\Delta E=\frac{hc}{\lambda}
\]
with
\[
\lambda=589\times10^{-9}\ \text{m}
\]
gives
\[
\Delta E=
\frac{(6.63\times10^{-34})(3.00\times10^8)}
{589\times10^{-9}}
=3.38\times10^{-19}\ \text{J}
\]
Student A’s claim is not the correct explanation for an absorption line. The deeper, hot, optically thick parts of the star can provide a broad continuous spectrum that includes radiation near \(589\ \text{nm}\). The reduction occurs after that radiation interacts with material in the outer layers.
Student B is correct that absorbed energy can later be re-emitted, but incorrectly assumes the replacement photon must return to the original beam. Re-emission occurs in different directions. Photons removed from the narrow line of sight towards Earth are therefore not all replaced in that same line of sight.
The observed intensity near \(589\ \text{nm}\) falls below the surrounding continuum, creating an absorption line.
The important constraint is directional intensity, not just total energy conservation.
Question 4
A thin gas has three energy levels:
\[
E_0=0,\qquad E_1=1.80\ \text{eV},\qquad E_2=4.20\ \text{eV}
\]
A continuous lamp emits wavelengths from \(250\ \text{nm}\) to \(800\ \text{nm}\). The lamp shines through the gas.
Assume:
- almost all atoms are initially in \(E_0\)
- illumination is weak enough that this remains a good approximation
- collisions do not significantly excite the atoms
- all three transitions are allowed.
Observer X looks directly through the gas towards the lamp. Observer Y looks at the gas from the side, with the lamp itself outside Y’s field of view.
- Find the wavelengths corresponding to all three energy differences.
- Which absorption lines can Observer X see?
- Which emission wavelengths can Observer Y potentially see?
- Explain why Y can see an emission wavelength that does not appear as an important absorption line for X.
Solution 4
The three transition wavelengths are approximately \(691\ \text{nm}\), \(518\ \text{nm}\), and \(296\ \text{nm}\). Observer X mainly sees absorption at \(691\ \text{nm}\) and \(296\ \text{nm}\), while Observer Y can potentially receive emission at all three wavelengths.
For \(E_1-E_0=1.80\ \text{eV}\),
\[
\Delta E=(1.80)(1.60\times10^{-19})
=2.88\times10^{-19}\ \text{J}
\]
so
\[
\lambda=
\frac{(6.63\times10^{-34})(3.00\times10^8)}
{2.88\times10^{-19}}
=6.91\times10^{-7}\ \text{m}
=691\ \text{nm}
\]
For \(E_2-E_1=2.40\ \text{eV}\),
\[
\Delta E=(2.40)(1.60\times10^{-19})
=3.84\times10^{-19}\ \text{J}
\]
giving
\[
\lambda=
\frac{(6.63\times10^{-34})(3.00\times10^8)}
{3.84\times10^{-19}}
=5.18\times10^{-7}\ \text{m}
=518\ \text{nm}
\]
For \(E_2-E_0=4.20\ \text{eV}\),
\[
\Delta E=(4.20)(1.60\times10^{-19})
=6.72\times10^{-19}\ \text{J}
\]
so
\[
\lambda=
\frac{(6.63\times10^{-34})(3.00\times10^8)}
{6.72\times10^{-19}}
=2.96\times10^{-7}\ \text{m}
=296\ \text{nm}
\]
Observer X sees the lamp through gas whose atoms are almost entirely in \(E_0\). The strong possible absorptions therefore begin from \(E_0\):
\[
E_0\rightarrow E_1
\]
at \(691\ \text{nm}\), and
\[
E_0\rightarrow E_2
\]
at \(296\ \text{nm}\).
Absorption at \(518\ \text{nm}\) would require an atom already occupying \(E_1\), because \(518\ \text{nm}\) corresponds to \(E_1\rightarrow E_2\). The question tells us that the \(E_1\) population is very small.
Observer Y does not see the bright lamp directly. Instead, Y can detect photons emitted when excited atoms fall back down.
Atoms excited to \(E_1\) can emit \(691\ \text{nm}\) photons.
Atoms excited to \(E_2\) can fall directly to \(E_0\), emitting \(296\ \text{nm}\), or they can fall first to \(E_1\), emitting \(518\ \text{nm}\), and later from \(E_1\) to \(E_0\), emitting \(691\ \text{nm}\).
So \(518\ \text{nm}\) can appear as an emission line from the side even though it is weak or absent as an absorption line along the lamp beam.
The tempting route is to assume that absorption and emission spectra must contain identical lists of lines. The missing constraint is the population of the starting state. Emission begins from excited states; absorption begins from whatever states are populated before the incoming photon arrives.
If the gas became hot enough for a significant fraction of atoms to occupy \(E_1\), the \(518\ \text{nm}\) absorption transition could become much more noticeable.
Question 5
Consider an idealised star surrounded by a perfectly spherical shell of low-density gas.
At one wavelength, \(\lambda_0\), atoms in the shell absorb photons from the star and re-emit photons of exactly the same wavelength in random directions.
Assume:
- the star emits an isotropic continuous spectrum
- the shell is perfectly spherical
- no photon energy is lost in collisions
- no wavelength changes occur during re-emission
- the system is in a steady state.
Telescope A uses a narrow aperture that effectively measures only the apparent stellar disc.
Telescope B has enough angular resolution and aperture coverage to collect the total light from the stellar disc and the entire surrounding shell as one unresolved system.
A student argues that both telescopes must show an absorption line at \(\lambda_0\), because the gas lies between the star and the observer.
Is that conclusion correct? Explain what each telescope measures.
Solution 5
No. Telescope A can show an absorption feature at \(\lambda_0\), but in this deliberately idealised model Telescope B need not show any net absorption at that wavelength when it collects the whole star-plus-shell system.
Telescope A concentrates on the apparent stellar disc. Some photons at \(\lambda_0\) travelling directly from the star towards A are absorbed by the shell and later re-emitted in other directions or into positions that appear outside the stellar disc.
The intensity measured over the disc can therefore fall at \(\lambda_0\). A sees an absorption feature.
It is tempting to stop there and say, “Gas in front of a continuum source means absorption.” That rule is useful, but it assumes the observer is mainly following the direct background beam.
Telescope B measures something different. It includes not only the dimmed stellar disc but also emission from the entire surrounding shell.
Under the assumptions in the question, absorption has not destroyed any \(\lambda_0\) photons or converted their energy into another wavelength. It has only redistributed their directions.
Because the source and shell are both perfectly spherical, there is no preferred direction. In steady state, the total luminosity at \(\lambda_0\) is conserved and remains distributed symmetrically.
Photons scattered out of the part of the image occupied by the stellar disc are balanced, in the total star-plus-shell measurement, by photons scattered into the observer’s direction from other parts of the shell. The off-disc emission can therefore fill in the disc absorption when the complete system is integrated.
The conceptual hinge is that a spectrum is always a measurement made with a particular geometry and field of view. “Absorption occurred” does not automatically mean “the total collected spectrum must contain a dark line”.
Real stellar atmospheres are more complicated than this model. Their spectra involve temperature gradients, different atomic populations, collisions, repeated interactions, and wavelength-dependent emission and absorption. The thought experiment is useful because it isolates one point: conserving energy globally does not stop a narrow line of sight from losing intensity, and losing intensity along one line of sight does not prove photons were destroyed.
09What this lets you understand next
Once you can separate continuous, emission, and absorption spectra by their physical origins, spectroscopy becomes much more than recognising three pictures.
A pattern of line wavelengths can identify atomic energy transitions and therefore the elements present. The shape of a thermal continuum carries information about temperature. Then, if an entire familiar line pattern shifts towards longer or shorter wavelengths, you have a new question: the atomic energy levels have not changed, so why have the observed wavelengths moved?
That is where Doppler shift and astronomical redshift become useful. The first job is identifying what produced the lines. The next is working out what has happened to them on the journey to the detector.