
Identifying Elements with Spectral Lines: HSC Physics
Learn how characteristic spectral lines act as chemical fingerprints, and how to identify elements from emission, absorption, and Doppler-shifted spectra.
A glowing gas gives off light at 656 nm, 486 nm, and 434 nm. Another sample gives 589 nm and 589.6 nm. If both just look like coloured light, how could you possibly tell what elements are present without opening the samples?
Predict first: would the brightness of the lines be the best clue, or their wavelengths?
The wavelengths are usually the better clue. Brightness can change with temperature, concentration, and how strongly the gas is excited. The positions of the spectral lines are tied to the allowed energy changes inside the atoms. That makes a set of spectral lines behave like a chemical fingerprint.
01The basic idea: match the pattern, not the colour
Imagine looking at two barcodes from a distance. Both contain black lines, but the important information is not simply that black lines exist. It is the particular spacing and arrangement of those lines.
An atomic spectrum works in a similar way.
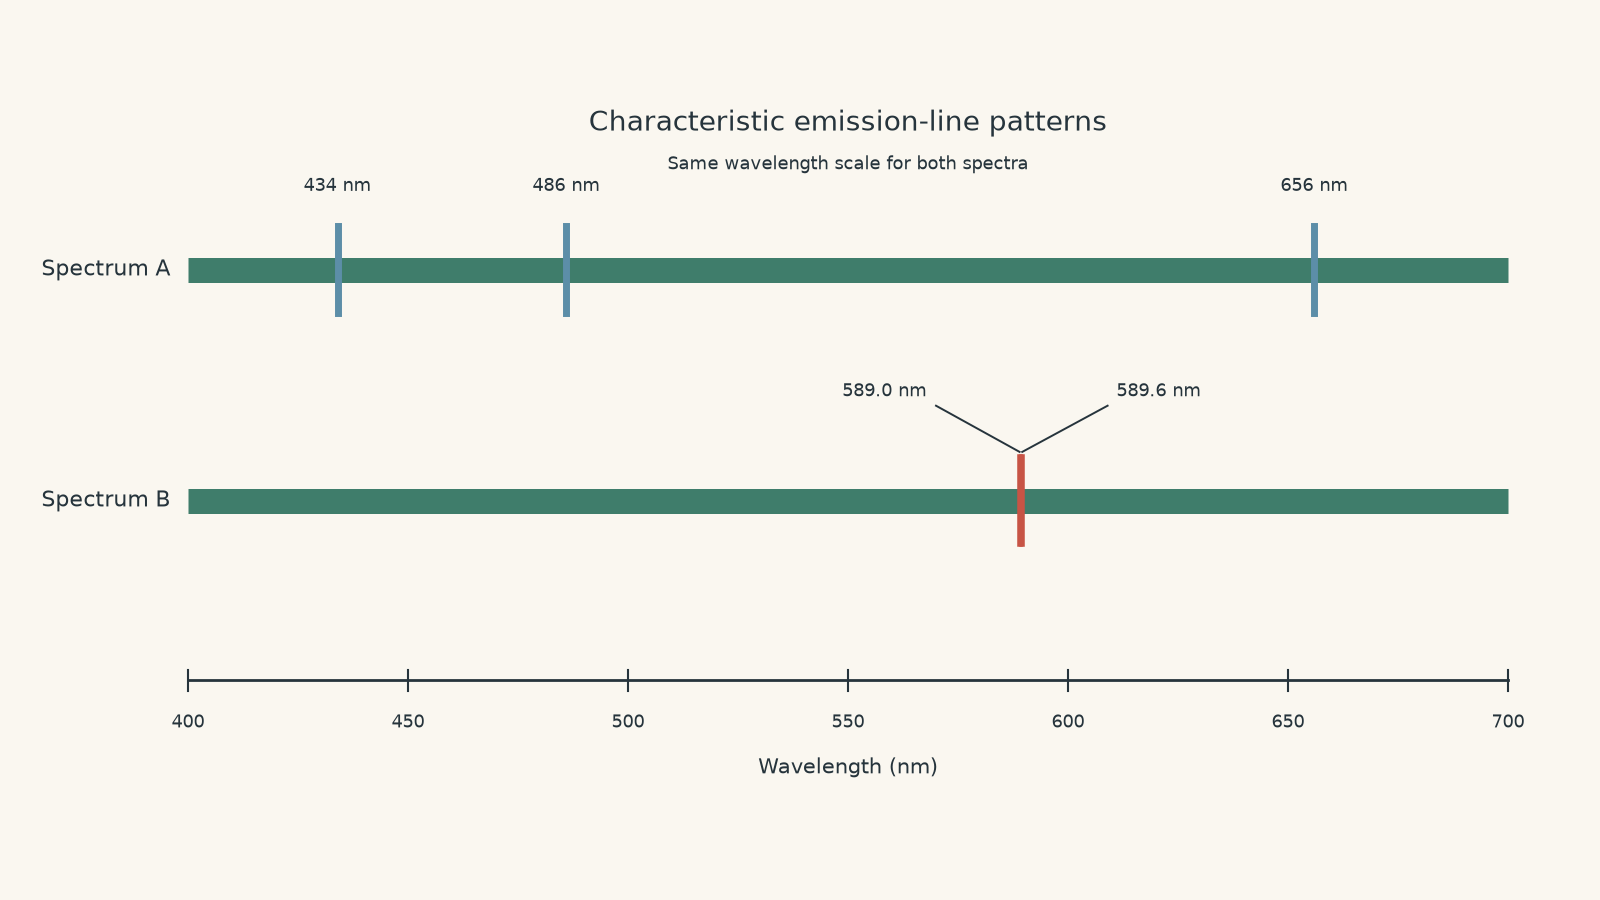
Each element has its own set of allowed electron energy levels. When electrons move between those levels, atoms emit or absorb photons with particular energies.
That gives each element a characteristic set of wavelengths.
A single line is rarely enough evidence by itself. A convincing identification comes from matching several lines in the correct pattern.
If you need a refresher on why bright and dark lines appear in the first place, see Continuous, Emission and Absorption Spectra: HSC Physics.
02Why atoms produce only certain wavelengths
A tempting first model is to imagine an electron orbiting a nucleus like a planet orbiting the Sun. If that picture were exact, the electron could have almost any energy.
But atoms do not behave that way.
Electrons in atoms can occupy only certain allowed energy states. We say their energies are quantised.
Suppose an electron moves from a higher-energy state to a lower-energy state. The atom loses energy, so a photon is emitted.
The photon energy is
\[
E_{\text{photon}} = E_{\text{high}} – E_{\text{low}}
\]
where:
- \(E_{\text{photon}}\) is the photon energy in joules, J,
- \(E_{\text{high}}\) is the initial electron energy,
- \(E_{\text{low}}\) is the final electron energy.
Photon energy is related to frequency by
\[
E = hf
\]
where:
- \(E\) is photon energy in joules,
- \(h = 6.63 \times 10^{-34}\ \text{J s}\) is Planck’s constant,
- \(f\) is frequency in hertz, Hz.
Since electromagnetic waves obey
\[
c = f\lambda
\]
we can combine the equations:
\[
E = \frac{hc}{\lambda}
\]
where:
- \(c = 3.00 \times 10^8\ \text{m s}^{-1}\) is the speed of light,
- \(\lambda\) is wavelength in metres.
So each allowed energy difference corresponds to a particular photon wavelength.
That is the connection spectroscopy relies on:
\[
\text{energy-level structure} \rightarrow \text{allowed transitions} \rightarrow \text{spectral lines}
\]
Different elements have different nuclear charges and different electron arrangements. Their allowed energy levels therefore differ, giving different patterns of spectral lines.
03Why the fingerprint belongs to the element
Suppose hydrogen and sodium atoms are both excited.
Their electrons do not have the same allowed energy levels. A transition with a certain energy difference in hydrogen does not automatically exist in sodium.
If hydrogen produces a photon with wavelength 656.3 nm, that tells us the transition released a particular amount of energy:
\[
E = \frac{hc}{\lambda}
\]
Sodium has its own energy differences and therefore its own characteristic wavelengths.
This is why simply saying, “The sample gives off yellow light, so it must be sodium,” is weak reasoning. Other sources can also produce yellow light.
A spectroscope does something much more useful: it separates the light by wavelength so you can inspect the individual lines.
04Worked example: calculate the photon energy of a spectral line
A hydrogen atom emits light of wavelength \(656\ \text{nm}\). Calculate the energy of one photon.
Step 1
The prefix nano means \(10^{-9}\), so
\[
\lambda = 656\ \text{nm}
= 656 \times 10^{-9}\ \text{m}
= 6.56 \times 10^{-7}\ \text{m}
\]
Step 2
\[
E = \frac{hc}{\lambda}
\]
Substitute \(h = 6.63 \times 10^{-34}\ \text{J s}\), \(c = 3.00 \times 10^8\ \text{m s}^{-1}\), and \(\lambda = 6.56 \times 10^{-7}\ \text{m}\):
\[
E
= \frac{(6.63 \times 10^{-34})(3.00 \times 10^8)}
{6.56 \times 10^{-7}}
= 3.03 \times 10^{-19}\ \text{J}
\]
Step 3
Each 656 nm photon carries approximately
\[
3.03 \times 10^{-19}\ \text{J}
\]
of energy.
That energy corresponds to one particular allowed transition in hydrogen. The spectral line is therefore evidence about the internal energy structure of the atom, not merely its visible colour.
05Emission and absorption can reveal the same element
Now make a prediction.
Hydrogen can produce a bright emission line at a particular wavelength. If cooler hydrogen gas sits in front of a hot continuous light source, where should an absorption line appear?
At the same characteristic wavelength.
Why? The same pair of energy levels is involved.
In emission, an electron falls from a higher state to a lower state and releases a photon.
In absorption, an electron takes in a photon and moves from the lower state to the higher state.
For the same two states,
\[
\Delta E = hf
\]
in either direction.
So an element’s emission lines and absorption lines can occur at the same characteristic wavelengths, although one appears bright against a dark background and the other appears dark against a continuous spectrum.
That point matters enormously in astronomy. We cannot scoop gas out of a star and put it into a laboratory spectroscope. Instead, we identify elements by comparing the star’s absorption or emission lines with laboratory spectra.
06How to identify an element from an unknown spectrum
A reliable identification follows a simple process.
- Measure the wavelengths of several lines in the unknown spectrum.
- Compare them with known laboratory wavelengths.
- Look for a consistent set of matches.
- Check whether unexplained lines suggest additional elements.
- Consider whether the entire pattern may have been shifted by motion.
The last step matters because astronomical objects can move towards or away from us. Motion can shift the observed wavelengths through the Doppler effect.
This means spectroscopy is not always as simple as placing two spectra on top of each other and checking whether every line sits at exactly the same wavelength.
07Worked example: identify an element from several lines
An unknown gas produces strong emission lines at approximately 434 nm, 486 nm, and 656 nm.
A reference table gives:
| Element | Selected laboratory wavelengths |
|---|---|
| Hydrogen | 434 nm, 486 nm, 656 nm |
| Helium | 447 nm, 502 nm, 588 nm |
| Sodium | 589.0 nm, 589.6 nm |
Identify the most strongly supported element in the unknown gas.
Step 1
The line at 434 nm matches hydrogen.
That alone is useful, but not decisive. One coincidental match is possible.
Step 2
The 486 nm line also matches hydrogen.
The 656 nm line matches hydrogen as well.
Step 3
Neither helium nor sodium matches all three wavelengths.
Step 4
Hydrogen is strongly supported because three observed lines match three characteristic hydrogen lines at the correct wavelengths.
The important evidence is the set of matches. We did not identify hydrogen just because one line happened to be red.
08A harder case: the spectrum has moved
Suppose a star contains hydrogen, but the star is moving away from Earth.
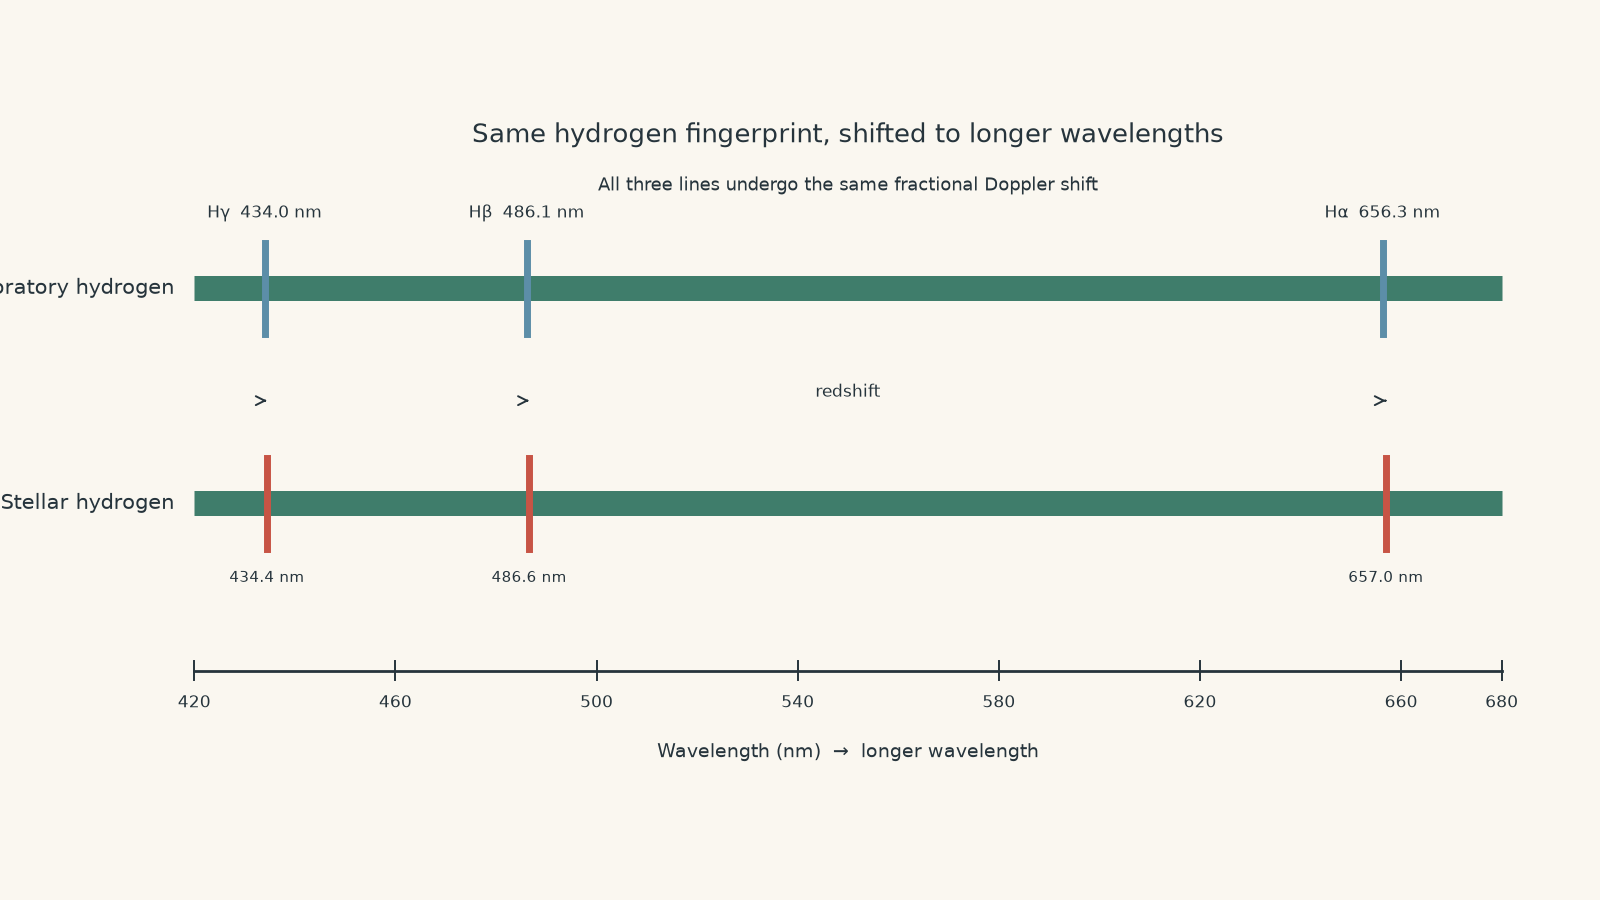
Its hydrogen lines may all appear at slightly longer wavelengths than the laboratory values. That is redshift.
For speeds much smaller than the speed of light, the Doppler shift can be approximated by
\[
\frac{v}{c} \approx \frac{\Delta \lambda}{\lambda_0}
\]
where:
- \(v\) is the radial speed of the source,
- \(c\) is the speed of light,
- \(\lambda_0\) is the laboratory, or rest, wavelength,
- \(\Delta \lambda = \lambda_{\text{obs}}-\lambda_0\),
- \(\lambda_{\text{obs}}\) is the observed wavelength.
A positive \(\Delta\lambda\) means the wavelength increased, so the source is moving away.
The approximation above is appropriate only when \(v\) is much smaller than \(c\). At speeds approaching the speed of light, the relativistic Doppler equation is required.
Worked example: identify a shifted spectral line
A hydrogen line has a laboratory wavelength of \(656.3\ \text{nm}\). In the spectrum of a star, the same line is observed at \(656.8\ \text{nm}\).
Estimate the star’s radial velocity relative to Earth.
Step 1
\[
\Delta\lambda
= \lambda_{\text{obs}}-\lambda_0
= 656.8-656.3
= 0.5\ \text{nm}
\]
Step 2
\[
\frac{v}{c} \approx \frac{\Delta\lambda}{\lambda_0}
\]
So
\[
v
\approx c\frac{\Delta\lambda}{\lambda_0}
= (3.00\times10^8)
\frac{0.5}{656.3}
\]
The wavelength units cancel because both wavelengths are measured in nm.
\[
v \approx 2.29\times10^5\ \text{m s}^{-1}
\]
Step 3
The observed wavelength is longer than the laboratory wavelength, so the star is moving away from Earth.
Its radial speed is approximately
\[
2.3\times10^5\ \text{m s}^{-1}
\]
or \(229\ \text{km s}^{-1}\).
The key spectroscopy point is that hydrogen did not stop being hydrogen just because its line moved. The pattern was shifted by the motion of the source.
09The strongest evidence is a shifted pattern
Suppose you find one line at 657 nm. Is that hydrogen?
Maybe. But the evidence is weak.
Now suppose you find three lines, and each one is about \(0.1\%\) longer than a known hydrogen line. That is much stronger evidence.
Why?
Motion shifts the wavelengths systematically. It does not randomly move one hydrogen line while leaving all the others unrelated.
For a small Doppler shift,
\[
\frac{\Delta\lambda}{\lambda_0}
\]
should be approximately the same for all lines produced by the same moving source.
This gives you a powerful check: both the underlying line pattern and the fractional shift should be consistent.
10Mixtures do not produce a new mystery element
A gas sample can contain more than one element.
Suppose a spectrum contains hydrogen lines at 434 nm, 486 nm, and 656 nm, plus sodium lines near 589 nm.
You should not search for one exotic element with all five lines.
Spectra from mixtures are superpositions. Each species contributes its own characteristic lines.
This is a little like hearing two people talk at once. The sound reaching you is a mixture, but neither person suddenly develops a brand-new combined voice.
The analogy breaks because spectral lines can be measured far more cleanly than two overlapping conversations, and real spectra can contain broadened or blended lines. Still, the useful idea is that contributions from different atoms can appear together.
11The tempting misconception: line brightness identifies the element
Students often focus on the brightest line.
That feels sensible. A bright line is visually obvious, so it seems as though it should be the strongest identifier.
But line intensity depends on more than atomic identity. It can depend on factors including:
- how many atoms of that element are present,
- how many atoms occupy the relevant energy state,
- temperature,
- excitation conditions,
- transition probability,
- the sensitivity of the detector.
The wavelength position is usually the more fundamental fingerprint.
That does not mean intensity is useless. Astronomers can extract enormous amounts of information from line intensities. It simply means that, for the basic question “Which element is present?”, you should first look for the characteristic wavelength pattern.
12Another limitation: ionised atoms have different spectra
There is one more layer of precision.
When we say “each element has a characteristic spectrum”, we need to remember that removing electrons changes the atom’s energy-level structure.
Neutral helium and ionised helium are both helium because their nuclei contain the same number of protons. But their electron arrangements differ, so their spectra differ.
Spectroscopists therefore distinguish between different ionisation states.
For HSC questions, the central principle remains the same: spectral lines arise from allowed changes in quantised energy states. Just do not assume that every atom of one element must produce one identical set of lines regardless of its ionisation state.
13What spectroscopy actually lets us infer
From spectral lines, physicists can identify matter without directly collecting it.
That is why spectroscopy is useful for:
- identifying gases in laboratory samples,
- determining elements present in stellar atmospheres,
- analysing nebulae and other astronomical objects,
- detecting mixtures of elements,
- measuring motion from Doppler shifts.
Spectroscopy works because the line pattern connects an observation we can make – wavelength – to an atomic structure we cannot see directly.
14Questions and solutions
Question 1
A gas produces emission lines at 447 nm, 502 nm, and 588 nm.
Reference spectra contain the following selected lines:
| Element | Selected wavelengths |
|---|---|
| Hydrogen | 434 nm, 486 nm, 656 nm |
| Helium | 447 nm, 502 nm, 588 nm |
| Sodium | 589.0 nm, 589.6 nm |
Identify the element most strongly supported by the spectrum, and explain why using all the available evidence.
Solution 1
Helium is the element most strongly supported because all three observed lines match the listed helium wavelengths.
The gas produces lines at 447 nm, 502 nm, and 588 nm. These agree with the three listed helium lines.
Hydrogen does not match the pattern, and sodium only has lines near 589 nm.
A tempting approach is to identify an element from whichever single line looks closest. That is much weaker evidence. Characteristic spectroscopy works best by matching a set of lines, because the pattern of allowed transitions acts as the fingerprint.
Question 2
A stationary laboratory sample of an element produces lines at 400.0 nm, 500.0 nm, and 600.0 nm.
A distant astronomical object shows lines at 400.8 nm, 501.0 nm, and 601.2 nm.
Determine whether these observations are consistent with the same element moving relative to Earth. If they are, estimate its radial velocity and state whether it is moving towards or away from Earth.
Solution 2
Yes. The three lines are consistent with the same element moving away from Earth at approximately \(6.0\times10^5\ \text{m s}^{-1}\).
For a common Doppler shift, the fractional wavelength change should be approximately equal for every line.
For the 400.0 nm line,
\[
\frac{\Delta\lambda}{\lambda_0}
=
\frac{400.8-400.0}{400.0}
=
\frac{0.8}{400.0}
=
0.002
\]
For the 500.0 nm line,
\[
\frac{\Delta\lambda}{\lambda_0}
=
\frac{501.0-500.0}{500.0}
=
\frac{1.0}{500.0}
=
0.002
\]
For the 600.0 nm line,
\[
\frac{\Delta\lambda}{\lambda_0}
=
\frac{601.2-600.0}{600.0}
=
\frac{1.2}{600.0}
=
0.002
\]
The same fractional shift appears in every line, strongly supporting a single Doppler-shifted pattern.
Using
\[
\frac{v}{c}\approx\frac{\Delta\lambda}{\lambda_0}
\]
gives
\[
v
\approx (3.00\times10^8)(0.002)
= 6.00\times10^5\ \text{m s}^{-1}
\]
The wavelengths are all longer than their laboratory values, so the light is redshifted. The object is moving away from Earth.
A tempting objection is that the wavelength shifts are different: \(0.8\ \text{nm}\), \(1.0\ \text{nm}\), and \(1.2\ \text{nm}\). But Doppler shifting does not give every line the same absolute change in wavelength. For small speeds, it gives approximately the same fractional change.
Question 3
A star’s absorption spectrum contains dark lines at 486.5 nm and 656.9 nm.
Two strong hydrogen lines have laboratory wavelengths of 486.1 nm and 656.3 nm.
A student argues:
“Hydrogen cannot be present because neither dark line is exactly at a laboratory hydrogen wavelength.”
Evaluate the student’s claim. Use both spectral lines to support your answer quantitatively.
Solution 3
The student’s claim is incorrect. Both lines are consistent with redshifted hydrogen, although the measurements are not perfectly identical in fractional shift.
For the 486.1 nm hydrogen line,
\[
\Delta\lambda
=
486.5-486.1
=
0.4\ \text{nm}
\]
so
\[
\frac{\Delta\lambda}{\lambda_0}
=
\frac{0.4}{486.1}
\approx 8.23\times10^{-4}
\]
This corresponds to
\[
v
\approx (3.00\times10^8)(8.23\times10^{-4})
\approx 2.47\times10^5\ \text{m s}^{-1}
\]
For the 656.3 nm line,
\[
\Delta\lambda
=
656.9-656.3
=
0.6\ \text{nm}
\]
so
\[
\frac{\Delta\lambda}{\lambda_0}
=
\frac{0.6}{656.3}
\approx 9.14\times10^{-4}
\]
giving
\[
v
\approx (3.00\times10^8)(9.14\times10^{-4})
\approx 2.74\times10^5\ \text{m s}^{-1}
\]
The estimates, about \(247\ \text{km s}^{-1}\) and \(274\ \text{km s}^{-1}\), are reasonably close but not identical.
That difference could reflect measurement uncertainty, limited spectral resolution, or inaccurate reading of the line centres. If the measurements were highly precise, the discrepancy would need further investigation rather than simply being ignored.
The important constraint is that astronomical spectral lines do not need to appear at their laboratory wavelengths. If the source has radial motion, the entire pattern can shift.
The dark appearance of the lines is also not evidence against hydrogen. Hydrogen can absorb photons at the same characteristic transition wavelengths at which it can emit them.
Question 4
A laboratory database gives three strong lines for element X:
\[
450.0\ \text{nm},\quad 540.0\ \text{nm},\quad 675.0\ \text{nm}
\]
and three strong lines for element Y:
\[
459.0\ \text{nm},\quad 550.8\ \text{nm},\quad 688.5\ \text{nm}
\]
A star shows absorption lines at
\[
459.0\ \text{nm},\quad 550.8\ \text{nm},\quad 688.5\ \text{nm}
\]
A student immediately concludes that element Y is present because the observed wavelengths exactly match Y’s laboratory spectrum.
Another student claims the lines could instead be element X from a receding star.
Determine whether the spectrum alone can distinguish these two explanations. Show the relevant calculation, then explain what additional spectral evidence would help.
Solution 4
The three wavelengths alone cannot distinguish stationary element Y from element X redshifted by \(2.0\%\), because every listed X line shifts exactly onto the corresponding Y line.
For element X’s first line,
\[
\frac{\Delta\lambda}{\lambda_0}
=
\frac{459.0-450.0}{450.0}
=
\frac{9.0}{450.0}
=
0.020
\]
For the second line,
\[
\frac{\Delta\lambda}{\lambda_0}
=
\frac{550.8-540.0}{540.0}
=
\frac{10.8}{540.0}
=
0.020
\]
For the third line,
\[
\frac{\Delta\lambda}{\lambda_0}
=
\frac{688.5-675.0}{675.0}
=
\frac{13.5}{675.0}
=
0.020
\]
So the entire element X pattern has been scaled by the same factor:
\[
\lambda_{\text{obs}} = 1.020\lambda_0
\]
The corresponding small-speed estimate would be
\[
v
\approx (3.00\times10^8)(0.020)
=
6.0\times10^6\ \text{m s}^{-1}
\]
Thus two models fit the supplied data:
- stationary element Y,
- receding element X with a \(2.0\%\) redshift.
The tempting route is to say that an exact laboratory match proves element Y. It does not. A different rest spectrum can, in principle, be shifted onto the same observed wavelengths.
Additional lines would help. If element X has another known line at wavelength \(\lambda_X\), the redshift model predicts it should appear at approximately
\[
1.020\lambda_X
\]
If element Y predicts a line somewhere different, observing that region could separate the models.
Lines from other known elements in the same star would also help determine the star’s overall redshift. If those independent lines all show a \(2.0\%\) redshift, the element X interpretation would gain support.
The deeper lesson is that spectroscopy identifies patterns together with physical context. An exact match to a few wavelengths is strong evidence, but it is not logically unbeatable when Doppler shifting is possible.
Question 5
A distant star has an unknown radial velocity. Its spectrum contains four absorption lines:
\[
505.0\ \text{nm},\quad
606.0\ \text{nm},\quad
707.0\ \text{nm},\quad
763.6\ \text{nm}
\]
Three candidate elements have the following laboratory lines:
| Element | Laboratory wavelengths |
|---|---|
| P | 500 nm, 600 nm, 700 nm |
| Q | 505 nm, 606 nm, 707 nm |
| R | 540 nm, 648 nm, 756 nm |
An observer says, “Q must be present because three lines match Q exactly.”
Another observer notices that the first three observed lines could be redshifted P lines.
You are also told that the star contains a well-established magnesium line whose laboratory wavelength is \(756.0\ \text{nm}\), and the corresponding line is observed at \(763.6\ \text{nm}\).
Using all the evidence, determine which of P or Q is supported by the first three lines. Explain why the apparently exact match is not the strongest argument.
Solution 5
Element P is supported, because the independently identified magnesium line shows that the star’s spectrum is redshifted by about \(1.0\%\), and applying that same shift to P predicts all three observed wavelengths. Element Q would require its listed lines to remain unshifted while magnesium from the same star is redshifted.
Start with the independently identified magnesium line.
Its laboratory wavelength is
\[
\lambda_0=756.0\ \text{nm}
\]
and its observed wavelength is
\[
\lambda_{\text{obs}}=763.6\ \text{nm}
\]
so
\[
\Delta\lambda
=
763.6-756.0
=
7.6\ \text{nm}
\]
The fractional shift is
\[
\frac{\Delta\lambda}{\lambda_0}
=
\frac{7.6}{756.0}
\approx 0.0101
\]
which is approximately a \(1.0\%\) redshift.
Now apply the same shift to element P.
For its 500 nm line,
\[
\lambda_{\text{obs}}
\approx 500(1.01)
=
505\ \text{nm}
\]
For its 600 nm line,
\[
\lambda_{\text{obs}}
\approx 600(1.01)
=
606\ \text{nm}
\]
For its 700 nm line,
\[
\lambda_{\text{obs}}
\approx 700(1.01)
=
707\ \text{nm}
\]
These are exactly the three observed wavelengths.
The first observer’s argument is tempting because Q’s laboratory wavelengths match the observed numbers directly. If the star’s velocity were unknown and there were no other evidence, Q would be a plausible candidate.
But the magnesium line changes the problem. It independently tells us that light from this star is arriving redshifted by about \(1.0\%\).
Under the usual assumption that these absorption features originate in the same stellar atmosphere and share the star’s bulk radial motion, Q’s lines should also be shifted. Its laboratory line at 505 nm, for example, would be expected near
\[
505(1.01)\approx510.1\ \text{nm}
\]
not at 505 nm.
The hinge is that spectral identification cannot be made by treating each line in isolation. Once the motion of the source is established independently, every candidate identification has to satisfy that same physical constraint.
This is what makes spectroscopy more than visual pattern matching. The best identification is the one that makes the line pattern, the wavelength shift, and the rest of the physical evidence agree at the same time.
The next useful step is to connect spectral fingerprints to the broader information carried by electromagnetic waves: once wavelength can reveal both atomic transitions and motion, the same spectrum can tell us not only what distant matter is made of, but also how it is moving.