
Why Group 1 and Group 2 Chlorides Have Different Melting Points
Why does NaCl melt at a higher temperature than LiCl, and why do melting points rise from MgCl₂ to BaCl₂? Learn how ionic charge, ion size, polarisation, and crystal structure explain the data, and how to avoid common HSC Chemistry misconceptions.
LiCl melts at about 605 °C, while NaCl melts at 801 °C. Before reading the explanation, predict which should melt at the higher temperature. Li⁺ is smaller than Na⁺, so a simple model of smaller ions attracting more strongly predicts that LiCl should win. The data say otherwise.
Now compare MgCl₂, which melts at 714 °C, with BaCl₂, which melts at 963 °C. The cation becomes larger down Group 2, yet the melting point rises.
To explain both trends, you need to look beyond ionic charge and size. These factors help predict electrostatic attraction, but the crystal structure and the changes that occur during melting also matter.
01Read the data first
The table gives approximate melting points for the anhydrous chlorides at normal atmospheric pressure.
| Group 1 chloride | Melting point (°C) | Group 2 chloride | Melting point (°C) |
|---|---|---|---|
| LiCl | 605 | BeCl₂ | 405 |
| NaCl | 801 | MgCl₂ | 714 |
| KCl | 770 | CaCl₂ | 772 |
| RbCl | 718 | SrCl₂ | 874 |
| CsCl | 645 | BaCl₂ | 963 |
These rounded values are consistent with the SQA chemistry reference data and published data on the thermal properties of binary chlorides. Reported values can vary slightly between sources, particularly for some chlorides. In an exam, use the data supplied in the question.
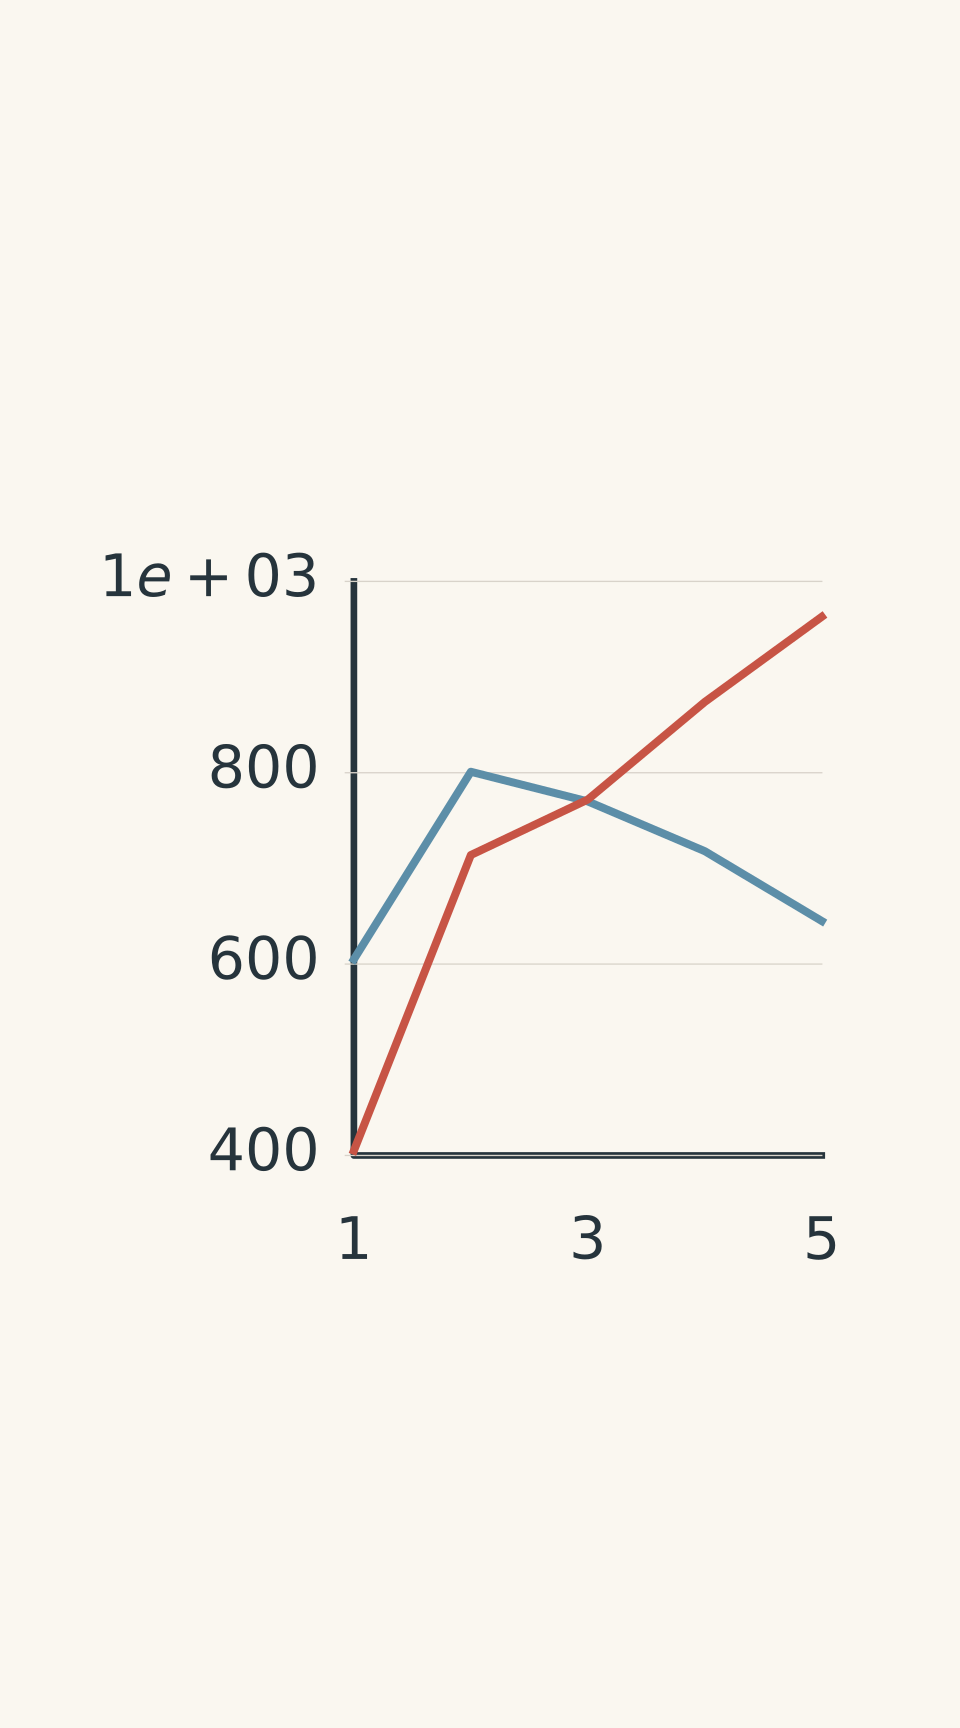
- Group 1: LiCl to CsCl
- Group 2: BeCl₂ to BaCl₂
Three patterns stand out.
- Group 1: The melting point rises from LiCl to NaCl, then generally decreases from NaCl to CsCl.
- Group 2: The melting point rises sharply from BeCl₂ to MgCl₂, then increases from MgCl₂ to BaCl₂.
- Between the groups: Group 2 chlorides do not always have higher melting points than Group 1 chlorides. MgCl₂ melts below NaCl, while CaCl₂ and KCl have almost identical melting points.
The first task is to explain these observations using a simple model. The second is to recognise where that model stops being sufficient.
01The first model: ionic charge and distance
An ionic solid contains positive and negative ions held together by electrostatic attraction. These ions form an extended, three-dimensional arrangement called a crystal lattice.
When the solid melts, the ions gain enough energy to move relative to one another, and the ordered crystal structure breaks down. The ions do not suddenly stop attracting each other; electrostatic interactions remain in the liquid.
Two factors help us predict the strength of the attraction between an individual pair of oppositely charged ions:
- Charge: Greater ionic charges produce stronger electrostatic attraction at the same separation.
- Distance: At the same charges, ions closer together attract more strongly.
A simplified relationship for the magnitude of the electrostatic potential energy of an ion pair is
\[ |U| \propto \frac{|q_+q_-|}{r} \]
where:
- \(U\) is the electrostatic potential energy of the ion pair.
- \(q_+\) is the positive ion’s charge.
- \(q_-\) is the negative ion’s charge.
- \(r\) is the distance between the centres of the ions.
This is a model for one pair of ions, not an equation for melting point.
How ionic charge affects electrostatic attraction
| Na⁺–Cl⁻ | |(+1)(−1)| = 1 Charges: +1 and −1 Centre-to-centre distance: r |
|---|---|
| Mg²⁺–Cl⁻ | |(+2)(−1)| = 2 Charges: +2 and −1 Same distance r; twice the charge-product magnitude |
Consider NaCl and MgCl₂. At the same separation, Mg²⁺ attracts Cl⁻ more strongly than Na⁺ does because Mg²⁺ has twice the positive charge.
That sounds as though MgCl₂ should always melt at a higher temperature. But this comparison considers only one ion pair. A real crystal contains many interacting ions, and the arrangement of those ions matters.
If the crystal structures and other relevant factors are comparable, stronger overall ionic attractions generally make a solid harder to disrupt. This often corresponds to a higher melting point.
The important qualification is if the other factors are comparable.
02Group 1: why NaCl has the highest melting point in this series
Group 1 metals form ions with a charge of +1. Their chlorides contain M⁺ and Cl⁻ ions, where M represents the metal.
Moving down the group from Na to Cs, the cation becomes larger, but its charge stays the same. The chloride ion also remains the same.
As the cation gets larger, the distance between the positive and negative ion centres generally increases. The electrostatic attraction between an individual pair therefore becomes weaker.
This predicts the following trend:
\[ \mathrm{NaCl > KCl > RbCl > CsCl} \]
Here, the greater-than signs indicate higher melting points. The data support this prediction:
- NaCl: 801 °C
- KCl: 770 °C
- RbCl: 718 °C
- CsCl: 645 °C
The decreasing melting points are consistent with weaker electrostatic attraction as the cation size increases. This is a useful example of the ionic model working well.
But why does LiCl break the pattern?
Li⁺ is smaller than Na⁺. If ion size were the only factor, LiCl should have the higher melting point.
Instead, LiCl melts at 605 °C, which is 196 °C below NaCl.
The missing factor is the effect of Li⁺ on the chloride ion.
Li⁺ is very small and has a high charge density. It can strongly distort the electron cloud of the larger Cl⁻ ion. This is called polarisation.
The distortion gives LiCl greater covalent character than the heavier Group 1 chlorides. Its melting behaviour also depends on how the arrangement and coordination of the ions change between the solid and liquid states.
How cation size affects polarisation
| LiCl | Li⁺–Cl⁻ Small Li⁺: higher polarising power Stronger electron-cloud distortion; greater covalent character |
|---|---|
| NaCl | Na⁺–Cl⁻ Larger Na⁺ with the same +1 charge Weaker distortion of the Cl⁻ electron cloud |
At HSC level, increased covalent character is a useful explanation for LiCl’s unexpectedly low melting point. The more precise lesson is that a size-based prediction alone cannot explain the complete melting behaviour.
Do not conclude that a lower melting point automatically means every electrostatic attraction in the solid is weaker.
Worked example: comparing NaCl and CsCl
NaCl melts at 801 °C, while CsCl melts at 645 °C. Calculate the change in melting point from NaCl to CsCl, and explain whether it agrees with the ionic model.
Step 1
\[ \Delta T_m=T_{\mathrm{CsCl}}-T_{\mathrm{NaCl}} \]
Step 2
\[ \begin{aligned} \Delta T_m &=645\,^\circ\mathrm{C}-801\,^\circ\mathrm{C}\\ &=-156\,^\circ\mathrm{C} \end{aligned} \]
Step 3
CsCl melts 156 °C lower than NaCl. Both compounds contain +1 cations and Cl⁻ anions, but Cs⁺ is larger than Na⁺. The greater ion separation is consistent with weaker electrostatic attraction and the observed decrease in melting point.
This supports the size-based model for this part of the series. It does not establish that ion size determines every melting point.
03Group 2: why the trend is different
Group 2 metals form ions with a charge of +2. Their chlorides have the formula MCl₂ because one M²⁺ ion balances two Cl⁻ ions.
A simple charge-based prediction suggests that Group 2 chlorides should have stronger ionic interactions than Group 1 chlorides. However, the data do not support a universal rule that every Group 2 chloride must melt at a higher temperature.
There are two important features to consider.
BeCl₂ is not a typical ionic solid
BeCl₂ melts at about 405 °C, far below MgCl₂ at 714 °C.
Like Li⁺, Be²⁺ is very small. Its high charge density gives it a strong ability to polarise Cl⁻. As a result, BeCl₂ has substantial covalent character.
In the solid state, BeCl₂ forms polymeric covalent chains rather than the extended ionic arrangement typical of many other metal chlorides.
Its low melting point is therefore not well explained by treating it as a simple collection of independent positive and negative ions.
The comparison is revealing: Be²⁺ has a higher charge than Li⁺, yet BeCl₂ has a lower melting point than LiCl. Charge alone clearly does not determine the result.
From MgCl₂ to BaCl₂, the melting point rises
Now consider the heavier Group 2 chlorides.
| Compound | Melting point (°C) |
|---|---|
| MgCl₂ | 714 |
| CaCl₂ | 772 |
| SrCl₂ | 874 |
| BaCl₂ | 963 |
The melting point rises by 249 °C from MgCl₂ to BaCl₂.
Yet the cation becomes larger down this series. If we considered only the electrostatic attraction between one M²⁺ ion and one Cl⁻ ion, the increase in distance would predict weaker attraction.
Why does the observed trend go the other way?
The key is that the compounds do not all have identical crystal structures. MgCl₂ has a layered ionic structure, while CaCl₂, SrCl₂, and BaCl₂ have different structural arrangements and coordination environments.
These differences affect how the ions are arranged in the solid and how stable that solid is relative to the liquid. Consequently, the melting point cannot be predicted from cation radius or charge alone.
Three different chloride crystal structures
| BeCl₂ | BeCl₂ Polymeric covalent chains Linked atoms form extended structures |
|---|---|
| NaCl | NaCl Three-dimensional rock-salt ionic lattice Ions are connected throughout the crystal |
| MgCl₂ | MgCl₂ Layered ionic structure Ions form stacked structural layers |
Be careful not to replace one oversimplification with another. The data show that melting points rise from MgCl₂ to BaCl₂, but the table alone does not quantify how much each structural feature contributes.
The defensible conclusion is that ionic charge, ion size, bonding character, and crystal structure must be considered together.
Worked example: testing a charge-based prediction
A student predicts that MgCl₂ must melt above NaCl because Mg²⁺ has a +2 charge while Na⁺ has a +1 charge. Use the data to evaluate this prediction.
Step 1
\[ \begin{aligned} T_m(\mathrm{MgCl_2})&=714\,^\circ\mathrm{C}\\ T_m(\mathrm{NaCl})&=801\,^\circ\mathrm{C} \end{aligned} \]
Step 2
\[ \begin{aligned} \Delta T_m&=714-801\\ &=-87\,^\circ\mathrm{C} \end{aligned} \]
MgCl₂ melts 87 °C below NaCl, so the student’s prediction is incorrect.
Step 3
At the same separation, Mg²⁺ would attract Cl⁻ more strongly than Na⁺ would. However, the actual crystals differ in structure, coordination, and bonding character. NaCl forms a three-dimensional rock-salt lattice, whereas MgCl₂ has a layered structure.
These differences affect the energy needed to change from the solid to the liquid. The data therefore disprove the claim that charge alone determines melting point; they do not disprove the importance of electrostatic attraction.
04A reliable method for interpreting melting-point data
When an exam gives you an unfamiliar set of melting points, use this sequence.
Step 1: State the observed trend.
Quote the relevant values. For example, the melting point increases from 714 °C for MgCl₂ to 963 °C for BaCl₂.
Step 2: Compare ionic charges.
Are the cation and anion charges the same across the series? If they differ, explain how this affects electrostatic attraction.
Step 3: Compare ion sizes.
For ions with the same charges, a larger separation generally means weaker attraction between an individual positive-negative pair.
Step 4: Check for changes in bonding and crystal structure.
If the data contradict your initial prediction, consider polarisation, covalent character, coordination, and differences between the solid and liquid structures.
Step 5: Make a qualified conclusion.
Explain what the model accounts for and what it cannot explain by itself. Avoid claiming that one factor determines the melting point unless the evidence supports that claim.
How to interpret melting-point trends
- Read the data
Identify the trend and quote values with units.
- Compare charges
Check cation and anion charges.
- Compare ion sizes
Larger separation generally weakens pairwise attraction at equal charges.
- Check bonding and structure
If the prediction fails, consider polarisation, covalent character, and crystal structure.
- Write a qualified conclusion
Explain what the model accounts for and what it cannot establish.
A strong explanation links the data to the model rather than listing factors without showing how they apply.
For example:
“From MgCl₂ to BaCl₂, the melting point increases from 714 °C to 963 °C. Although the cation radius increases, which would weaken attraction between an individual cation and an anion, the observed melting-point trend is opposite to that prediction. The compounds have different crystal structures and coordination environments, so the stability of the complete solid relative to the liquid must also be considered.”
Notice that this explanation identifies the observation, tests the simple model, and explains its limitation.
06Questions and solutions
Question 1
Using the data in the table, calculate how much higher the melting point of BaCl₂ is than that of MgCl₂. State the trend shown by these two compounds.
Solution 1
BaCl₂ melts 249 °C higher than MgCl₂, showing an increase in melting point down this part of Group 2.
Step 1: Subtract the initial melting point from the final melting point.
\[ \begin{aligned} \Delta T_m&=T_m(\mathrm{BaCl_2})-T_m(\mathrm{MgCl_2})\\ &=963\,^\circ\mathrm{C}-714\,^\circ\mathrm{C}\\ &=249\,^\circ\mathrm{C} \end{aligned} \]
Step 2: Interpret the result.
The melting point increases by 249 °C from MgCl₂ to BaCl₂. This is the observed trend. It does not mean that Ba²⁺ attracts Cl⁻ more strongly in an individual ion pair, because Ba²⁺ is larger than Mg²⁺. Crystal structure and the relative stability of the solid and liquid must also be considered.
Question 2
LiCl melts at 605 °C, while NaCl melts at 801 °C.
Calculate the difference in their melting points and explain why the smaller Li⁺ ion does not give LiCl the higher melting point.
Solution 2
NaCl melts 196 °C higher than LiCl, despite Na⁺ being larger than Li⁺.
Step 1: Calculate the difference.
\[ \begin{aligned} \Delta T_m&=801\,^\circ\mathrm{C}-605\,^\circ\mathrm{C}\\ &=196\,^\circ\mathrm{C} \end{aligned} \]
Step 2: Apply the ionic model.
Because Li⁺ is smaller, the separation between Li⁺ and Cl⁻ is generally smaller than that between Na⁺ and Cl⁻. A simple electrostatic model would therefore predict stronger attraction for the LiCl ion pair.
Step 3: Explain the limitation.
Li⁺ has a high charge density and strongly polarises Cl⁻, giving LiCl greater covalent character. The arrangement and coordination of ions also affect the melting process. Consequently, ion size alone cannot predict the melting point.
The lower melting point of LiCl does not prove that its individual electrostatic attractions are weaker than those in NaCl.
Question 3
Arrange MgCl₂, KCl, CaCl₂, and NaCl in order of increasing melting point using the table.
A student claims that Group 2 chlorides must always melt at higher temperatures than Group 1 chlorides because their cations have a +2 charge rather than a +1 charge. Evaluate the claim using the data.
Solution 3
Using the listed values, the order is
\[ \mathrm{MgCl_2<KCl<CaCl_2<NaCl} \]
However, KCl and CaCl₂ should be treated as having very similar melting points because their tabulated values differ by only 2 °C.
Step 1: Identify the relevant values.
- MgCl₂: 714 °C
- KCl: 770 °C
- CaCl₂: 772 °C
- NaCl: 801 °C
Step 2: Test the student’s claim.
The claim is incorrect. MgCl₂, a Group 2 chloride, melts at 714 °C, which is 87 °C below NaCl, a Group 1 chloride.
CaCl₂ and KCl also have nearly identical melting points despite belonging to different groups.
Step 3: Explain the result.
A +2 cation produces stronger electrostatic attraction to an individual Cl⁻ ion than a +1 cation would at the same separation. However, the actual ionic separations, crystal structures, coordination environments, and bonding character differ between compounds.
Charge is important, but it is not sufficient to establish a universal ranking of melting points. The small KCl-CaCl₂ difference also should not be treated as a meaningful general rule when reference values can vary slightly.
Question 4
BeCl₂ melts at approximately 405 °C, while MgCl₂ melts at 714 °C. Both are Group 2 chlorides, and both metals form +2 cations. Be²⁺ is smaller than Mg²⁺.
Does the lower melting point of BeCl₂ prove that the electrostatic attraction between Be²⁺ and Cl⁻ is weaker than the attraction between Mg²⁺ and Cl⁻? Explain your reasoning and identify one conclusion that cannot be established from the melting-point data alone.
Solution 4
No. The lower melting point of BeCl₂ does not prove that its individual Be²⁺-Cl⁻ electrostatic attractions are weaker.
Step 1: Compare the prediction from charge and size.
Both cations have a +2 charge, but Be²⁺ is smaller than Mg²⁺. A simple pairwise electrostatic model would predict stronger attraction between Be²⁺ and Cl⁻ at the smaller separation.
Step 2: Consider bonding and structure.
Be²⁺ has a very high charge density and strongly polarises Cl⁻. BeCl₂ consequently has substantial covalent character and forms polymeric chains in the solid. MgCl₂, by comparison, has a layered ionic structure.
The compounds therefore differ in more than cation size. Their bonding and structural arrangements affect how they behave during melting.
Step 3: Identify the limitation of the evidence.
BeCl₂ melts 309 °C below MgCl₂, but that temperature difference cannot be used to calculate the relative strength of an individual Be²⁺-Cl⁻ interaction.
The data establish a difference in melting behaviour. They do not isolate the contribution of electrostatic attraction from covalent bonding, crystal structure, or the changes that occur when each solid melts.
Question 5
Two hypothetical solid forms, A and B, of the same pure, anhydrous salt MCl₂ are examined at the same pressure. Both contain M²⁺ and Cl⁻ ions, have identical compositions, and contain the same cation and anion sizes.
- Form A has a three-dimensional ionic network and melts at 760 °C.
- Form B forms polymeric covalent chains and melts at 520 °C.
Assume that both forms remain stable until melting, with no decomposition or structural transition occurring first, and that the measurements are reliable.
One student argues that the melting points must be identical because the ions, charges, and composition are identical. Another argues that the lower melting point of B proves its individual M²⁺-Cl⁻ electrostatic attractions are weaker.
Evaluate both arguments. State the strongest conclusion supported by the evidence, and use at least one comparison from the Group 1 and Group 2 data to support your reasoning.
Solution 5
The first student is incorrect, and the second student’s conclusion is not justified by the melting-point data alone.
The two forms differ in bonding and crystal structure, so they need not have the same melting point even though their ions, charges, and composition are identical.
Step 1: Establish the observed difference.
\[ \begin{aligned} \Delta T_m&=760\,^\circ\mathrm{C}-520\,^\circ\mathrm{C}\\ &=240\,^\circ\mathrm{C} \end{aligned} \]
Form A melts 240 °C higher than form B.
Step 2: Explain why identical ions do not require identical melting points.
The ionic charges and sizes help determine electrostatic interactions, but they do not completely specify the crystal structure. In form A, the ions occupy a three-dimensional ionic network. In form B, the bonding and connectivity are different because the solid forms polymeric covalent chains.
Melting depends on the relative stability of the solid and liquid, not just on the attraction between one cation and one anion. Different bonding arrangements can therefore produce different melting points.
Step 3: Test the claim about weaker electrostatic attraction.
The lower melting point of B does not, by itself, prove that each M²⁺-Cl⁻ electrostatic attraction is weaker. The observed difference reflects the behaviour of the complete solid during melting, including the effects of bonding and structure.
The Group 1 data provide a useful comparison. LiCl melts below NaCl even though Li⁺ is smaller than Na⁺. This already shows that a simple size-based ranking cannot explain every melting point.
Similarly, MgCl₂ melts below BaCl₂ even though the cation becomes larger down the series. The observed melting-point trend cannot be inferred from individual ion-pair attraction alone.
Step 4: State the strongest conclusion.
The evidence establishes that crystal structure and bonding can affect melting point independently of ionic charge and size. It does not establish the precise strength of individual electrostatic attractions in either form.
To separate the effects, further information about bonding, crystal structure, lattice enthalpy, and the relative stability of the solid and liquid would be needed. Even lattice enthalpy alone would not determine the exact melting point.
The key distinction is between predicting electrostatic attraction and explaining a measured melting point. Once you can separate those ideas, the next useful concept is lattice enthalpy and Born-Haber cycles. These allow you to quantify the energy changes involved in forming an ionic lattice, while keeping clear that lattice enthalpy is not itself a direct calculation of melting point.