
How to Read the Nuclear Binding-Energy Curve and Iron Limit
Learn how to interpret the nuclear binding-energy curve to predict when fusion and fission release energy. Explore the iron limit, worked calculations, common mistakes, and the difference between energy release and nuclear stability.
A star can release energy by fusing light nuclei, while a nuclear reactor can release energy by splitting a heavy nucleus. Those are opposite changes, so why can both release energy? Predict what matters more: whether nuclei join or split, or how tightly bound the final products are. The answer is the second. The binding-energy curve shows which nuclear changes can release energy and why ordinary stellar fusion eventually reaches a limit.
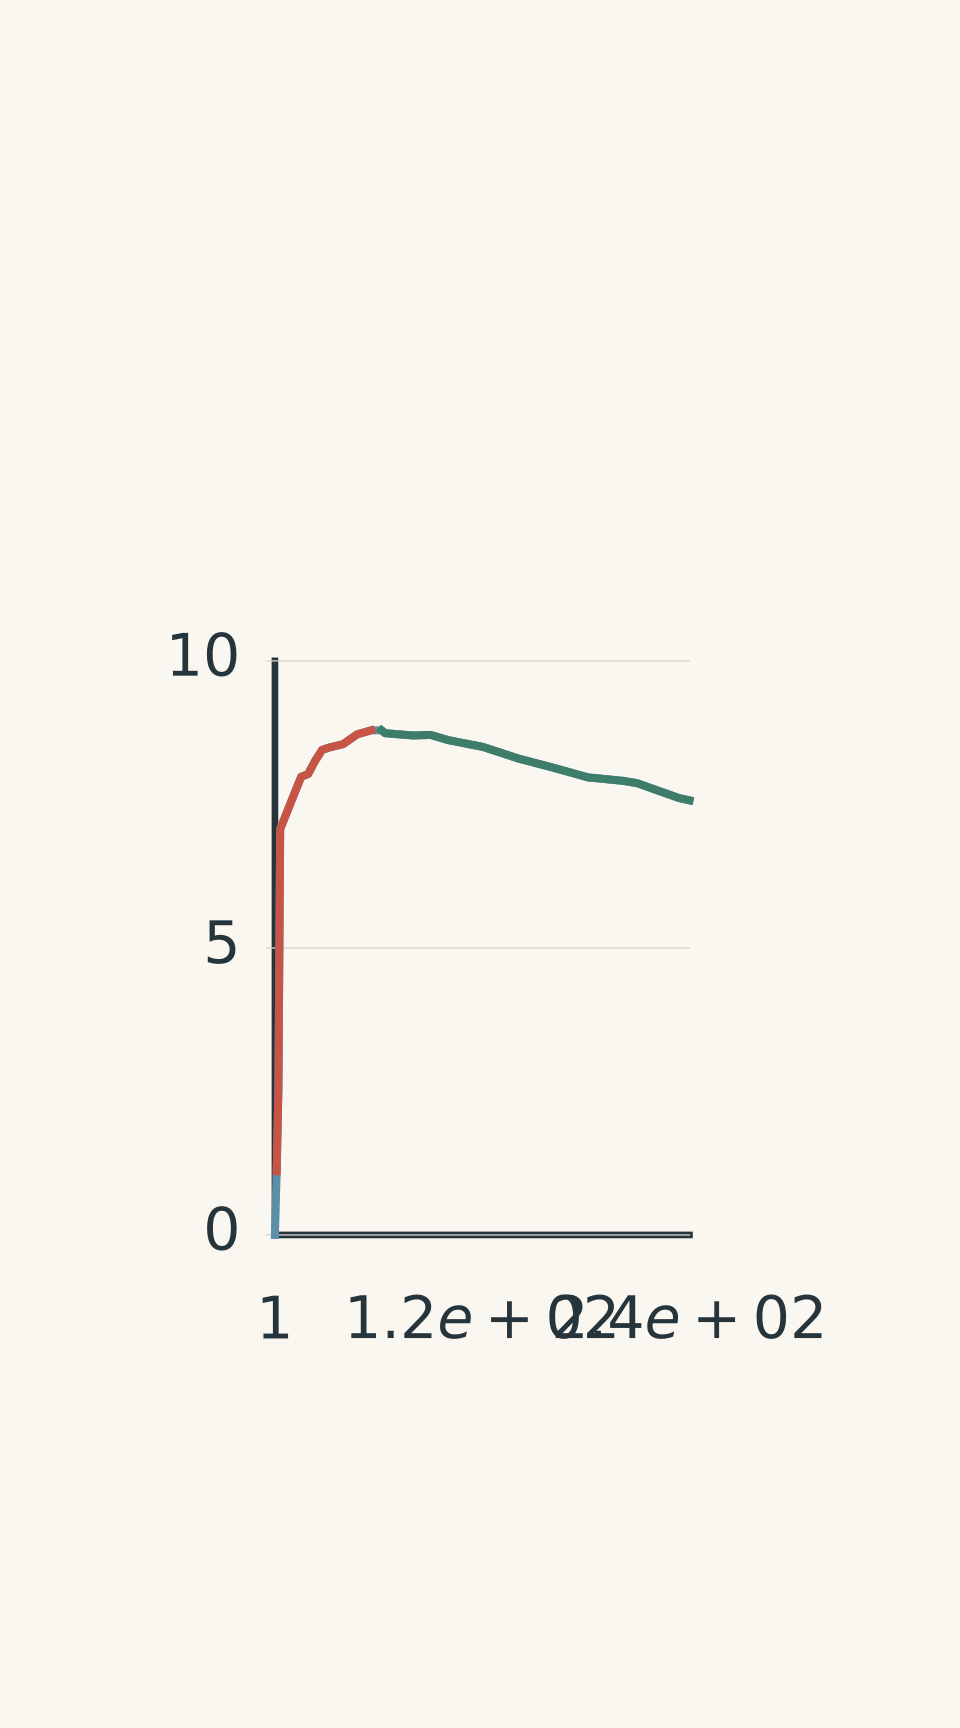
- Binding energy per nucleon
- Fusion direction → peak
- Fission direction ← peak
01The quick decision rule
When you’re given a binding-energy curve in an HSC Physics question, use this procedure.
- Read the binding energy per nucleon for each nucleus from the graph.
- Calculate the total binding energy of every reactant and product by multiplying its binding energy per nucleon by its mass number.
- Compare the total binding energies. If the products have greater total binding energy than the reactants, the change in nuclear binding energy releases energy. If they have less, energy must be supplied.
The key equation is
\[ B=A\left(\frac{B}{A}\right) \]
where:
- \(B\) is the total nuclear binding energy, measured in MeV.
- \(A\) is the mass number, equal to the total number of protons and neutrons.
- \(B/A\) is the average binding energy per nucleon, measured in MeV per nucleon.
For a reaction in which the total numbers of protons and neutrons are conserved, the energy released can be estimated using
\[ Q \approx B_{\text{products}}-B_{\text{reactants}} \]
A positive \(Q\) means energy is released. A negative \(Q\) means energy must be supplied.
For an exact calculation, use the total rest masses of all reactants and products:
\[ Q=(m_{\text{initial}}-m_{\text{final}})c^2 \]
Here, \(m_{\text{initial}}\) and \(m_{\text{final}}\) are the total initial and final rest masses, and \(c\) is the speed of light. This full mass calculation is particularly important for reactions that convert protons into neutrons, such as stellar hydrogen fusion.
Keep one warning in mind: the curve plots binding energy per nucleon, not total binding energy. That distinction drives almost everything that follows.
02What the binding-energy curve actually tells you
1. Binding energy measures how tightly a nucleus is held together
A nucleus contains positively charged protons and electrically neutral neutrons, collectively called nucleons. The strong nuclear interaction binds these nucleons together.
The total binding energy \(B\) is the energy required to separate a nucleus completely into its individual protons and neutrons. Forming the same nucleus from free nucleons releases an equivalent amount of energy.
Binding energy per nucleon, \(B/A\), is the total binding energy divided by the number of nucleons. It tells you how tightly bound the nucleons are on average.
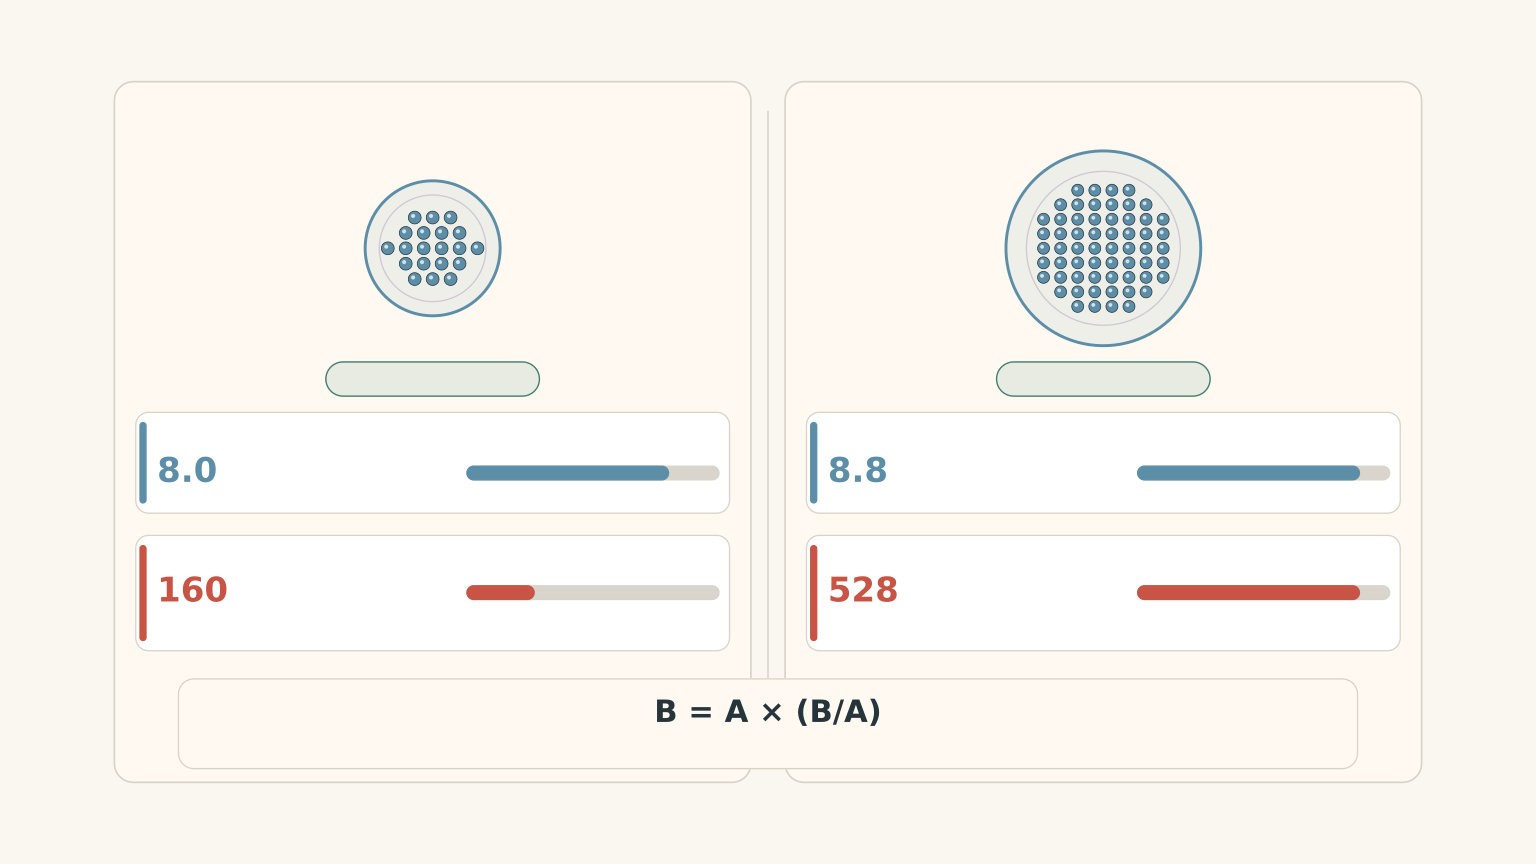
Think of two football teams. One averages 8.0 points per player, while another averages 8.5. The second team has the higher average, but that doesn’t automatically tell you which team scores more overall. You also need to know how many players are on each team.
The same distinction applies here. A nucleus with a higher \(B/A\) is more tightly bound per nucleon on average, but a larger nucleus can have a much greater total binding energy even when its \(B/A\) is lower.
The analogy is only about averages and totals. Nuclear binding isn’t a set of independent contributions from identical particles; it arises from the collective behaviour of nucleons and the nuclear interaction.
2. Read the curve from left to right
The horizontal axis is mass number \(A\). The vertical axis is binding energy per nucleon \(B/A\).
| Region of the curve | What happens to \(B/A\)? | Typical energy trend |
|---|---|---|
| Light nuclei, well below the peak | Rises rapidly as mass number increases | Fusion towards the peak can release energy |
| Iron-group nuclei, near the peak | Close to its maximum | Fusion to heavier nuclei generally stops being an energy source |
| Heavy nuclei, well beyond the peak | Falls gradually | Fission into medium-mass fragments can release energy |
The curve is a broad trend across many nuclei, not a perfectly smooth rule for every isotope. Small differences in neutron-to-proton ratio and nuclear structure matter when calculating an exact reaction energy.
The important features are the steep rise, the broad peak, and the gradual decline.
3. The peak lies near iron and nickel
The maximum binding energy per nucleon is approximately \(8.8\ \text{MeV}\), near mass numbers \(A=56\) to \(62\).
Iron-56 has a binding energy per nucleon of approximately \(8.79\ \text{MeV}\). Nickel-62 has a slightly higher value, approximately \(8.795\ \text{MeV}\), making it the nuclide with the highest binding energy per nucleon among the known nuclei.
The difference is tiny. Both lie near the top of the curve.
This explains why physicists often use the phrase iron limit even though iron-56 is not the exact maximum. Iron is a useful shorthand for the iron group of nuclei near the peak, including iron, cobalt, and nickel.
The peak isn’t a sharp boundary at one particular isotope. It’s a broad region in which nuclei are very tightly bound per nucleon.
03Why fusion of light nuclei can release energy
Fusion occurs when two or more nuclei combine to form a heavier nucleus.
Consider two light nuclei on the rising, left-hand side of the curve. If they fuse to form a nucleus closer to the peak, the product has a higher binding energy per nucleon.
Why does that matter?
If the reaction conserves the total numbers of protons and neutrons, the product’s greater binding energy means its total rest mass is lower than that of the initial collection of nuclei. The mass difference is converted into energy, which may appear as kinetic energy of the products, gamma radiation, or other emitted particles.
The overall change is energetically favourable because the final nuclear arrangement is more tightly bound.
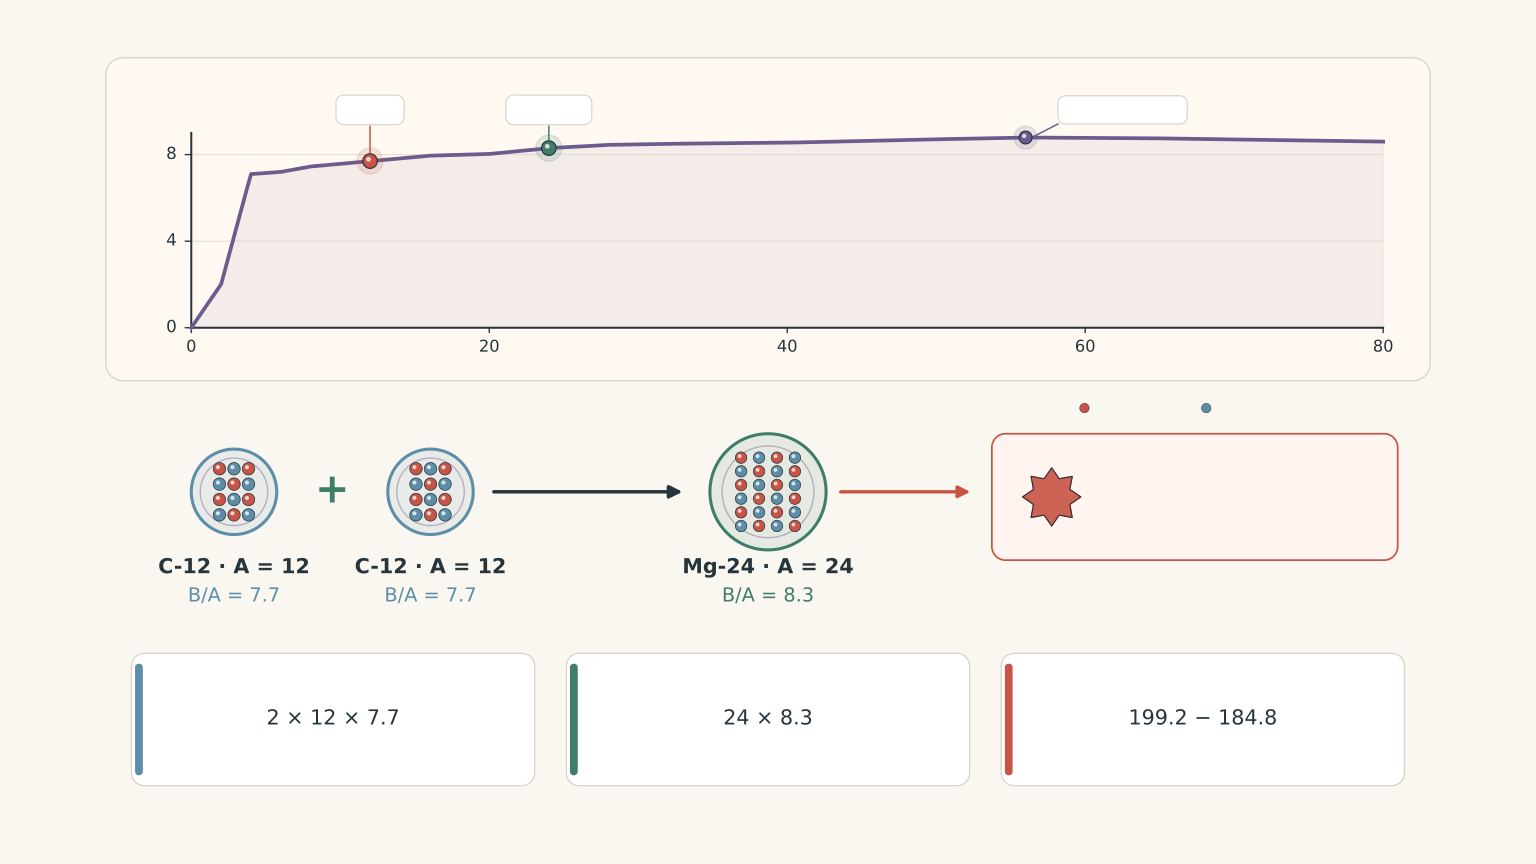
This is the principle behind energy production in stars. The net fusion of hydrogen into helium releases energy, and subsequent fusion stages can build heavier nuclei while releasing energy as long as the overall products move towards more tightly bound nuclear arrangements.
There is an important qualification: not every fusion reaction releases energy. Fusion is the name of a process, not a guarantee about its energy output. You still need to compare the reactants and products.
Worked example: Estimate the energy released by light-nucleus fusion
Two carbon-12 nuclei, each with a binding energy per nucleon of \(7.7\ \text{MeV}\), fuse to form a magnesium-24 nucleus with a binding energy per nucleon of \(8.3\ \text{MeV}\). Using these simplified curve readings, estimate the energy released. Assume the total numbers of protons and neutrons are conserved.
Step 1: Calculate the total binding energy of the reactants.
There are two carbon-12 nuclei, each containing 12 nucleons.
\[ \begin{aligned} B_{\text{reactants}} &=2(12)(7.7)\\\ &=184.8\ \text{MeV} \end{aligned} \]
Step 2: Calculate the total binding energy of the product.
The magnesium-24 nucleus contains 24 nucleons.
\[ \begin{aligned} B_{\text{products}} &=24(8.3)\\\ &=199.2\ \text{MeV} \end{aligned} \]
Step 3: Find the difference.
\[ \begin{aligned} Q&=B_{\text{products}}-B_{\text{reactants}}\\\ &=199.2-184.8\\\ &=+14.4\ \text{MeV} \end{aligned} \]
The reaction releases approximately \(14.4\ \text{MeV}\) using the supplied values. The positive result means the final nucleus has greater total binding energy, so the reaction can release energy.
The values are rounded illustrations of the curve, rather than precise nuclear mass data.
04Why fission of heavy nuclei can release energy
Fission is the splitting of a heavy nucleus into two or more smaller nuclei, often accompanied by the emission of neutrons.
At first, it might seem that breaking a nucleus apart must require energy. That intuition is reasonable: separating a bound system generally takes energy.
But nuclear fission doesn’t usually separate a heavy nucleus into individual protons and neutrons. It produces smaller, still-bound nuclei.
A sufficiently heavy nucleus lies on the descending, right-hand side of the binding-energy curve. When it splits into medium-mass fragments closer to the peak, the fragments can have a higher binding energy per nucleon.
If the sum of their total binding energies exceeds the initial nucleus’s total binding energy, the reaction releases energy.
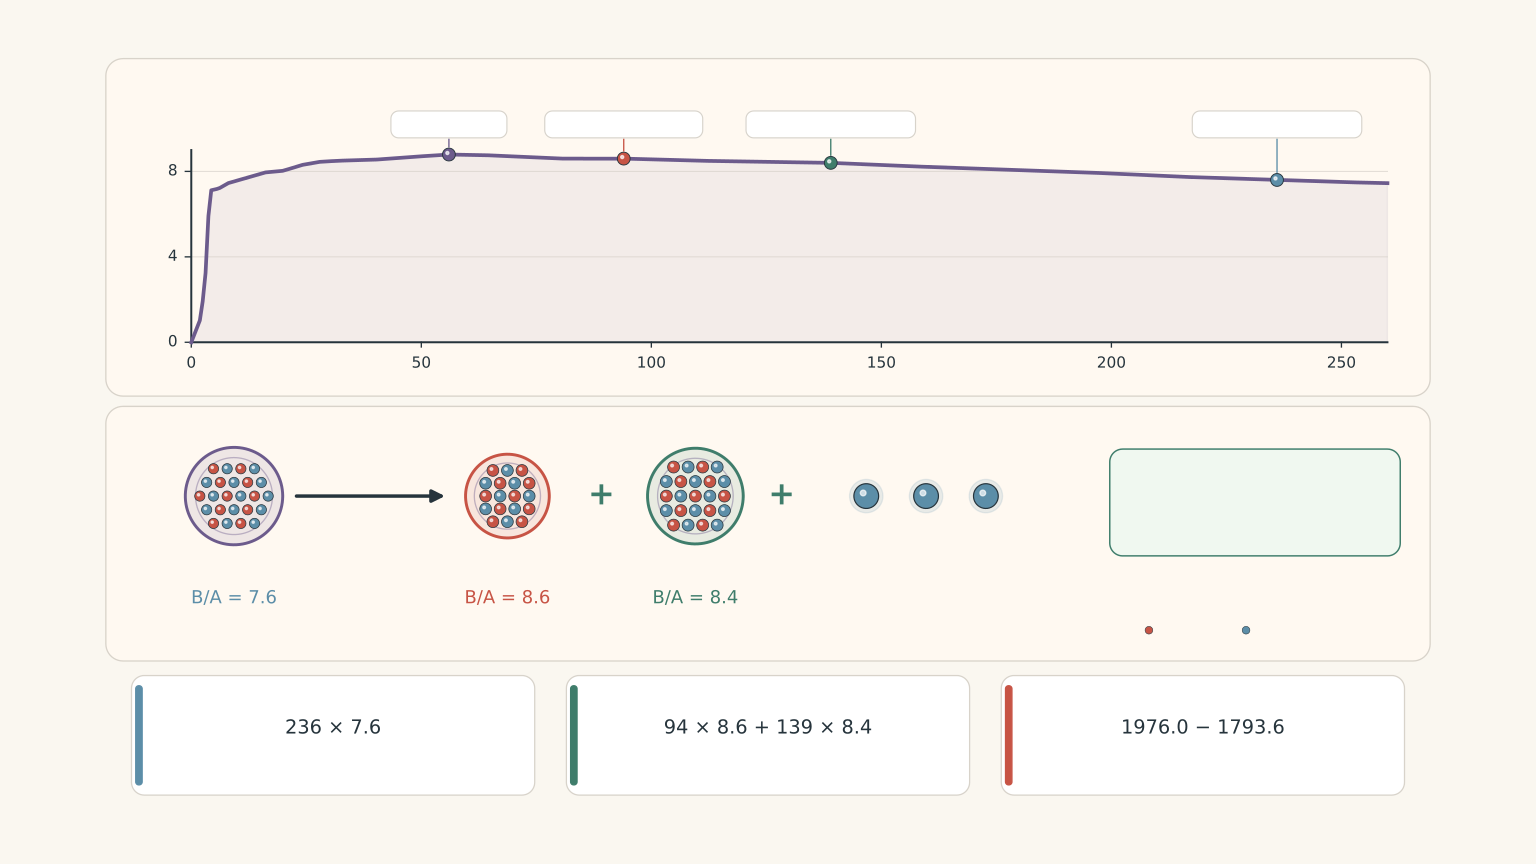
Free neutrons matter when doing the calculation. They are not bound inside a nucleus, so their nuclear binding energy is zero. You must not assign them the binding energy per nucleon of the fission fragments.
The released energy is distributed among the kinetic energy of the fragments and emitted neutrons, gamma radiation, and other products. A typical uranium fission event releases energy of the order of \(200\ \text{MeV}\).
Worked example: Estimate the energy released by fission
An excited compound nucleus has mass number \(A=236\) and binding energy per nucleon \(7.6\ \text{MeV}\). It splits into fragments with mass numbers 94 and 139, whose binding energies per nucleon are \(8.6\ \text{MeV}\) and \(8.4\ \text{MeV}\), respectively. Three free neutrons are also emitted. Estimate the energy released using these simplified curve readings.
Step 1: Calculate the initial total binding energy.
\[ \begin{aligned} B_{\text{initial}} &=236(7.6)\\\ &=1793.6\ \text{MeV} \end{aligned} \]
Step 2: Calculate the total binding energy of the two fragments.
For the fragment with \(A=94\),
\[ B_1=94(8.6)=808.4\ \text{MeV} \]
For the fragment with \(A=139\),
\[ B_2=139(8.4)=1167.6\ \text{MeV} \]
The total product binding energy is therefore
\[ \begin{aligned} B_{\text{final}} &=808.4+1167.6\\\ &=1976.0\ \text{MeV} \end{aligned} \]
The three free neutrons contribute zero nuclear binding energy.
Step 3: Calculate the energy released.
\[ \begin{aligned} Q&=B_{\text{final}}-B_{\text{initial}}\\\ &=1976.0-1793.6\\\ &=+182.4\ \text{MeV} \end{aligned} \]
The estimated energy released is \(182.4\ \text{MeV}\). The positive value shows that the products have greater total binding energy than the initial nucleus.
Notice that you did not simply multiply all 236 nucleons by one fragment’s binding energy per nucleon. The fragments have different values of \(B/A\), and three nucleons end up free rather than bound in either fragment.
05The iron limit: What it does and doesn’t mean
The iron limit is a useful way to understand why ordinary stellar fusion cannot continue releasing energy indefinitely.
On the rising side of the curve, fusion generally moves nuclei towards higher binding energy per nucleon. Near the peak, that trend reaches its limit. Beyond the peak, fusing nuclei into still heavier nuclei generally moves towards lower binding energy per nucleon.
That means fusion of iron-group nuclei into heavier nuclei does not provide a continuing net energy source in the way that hydrogen fusion does.
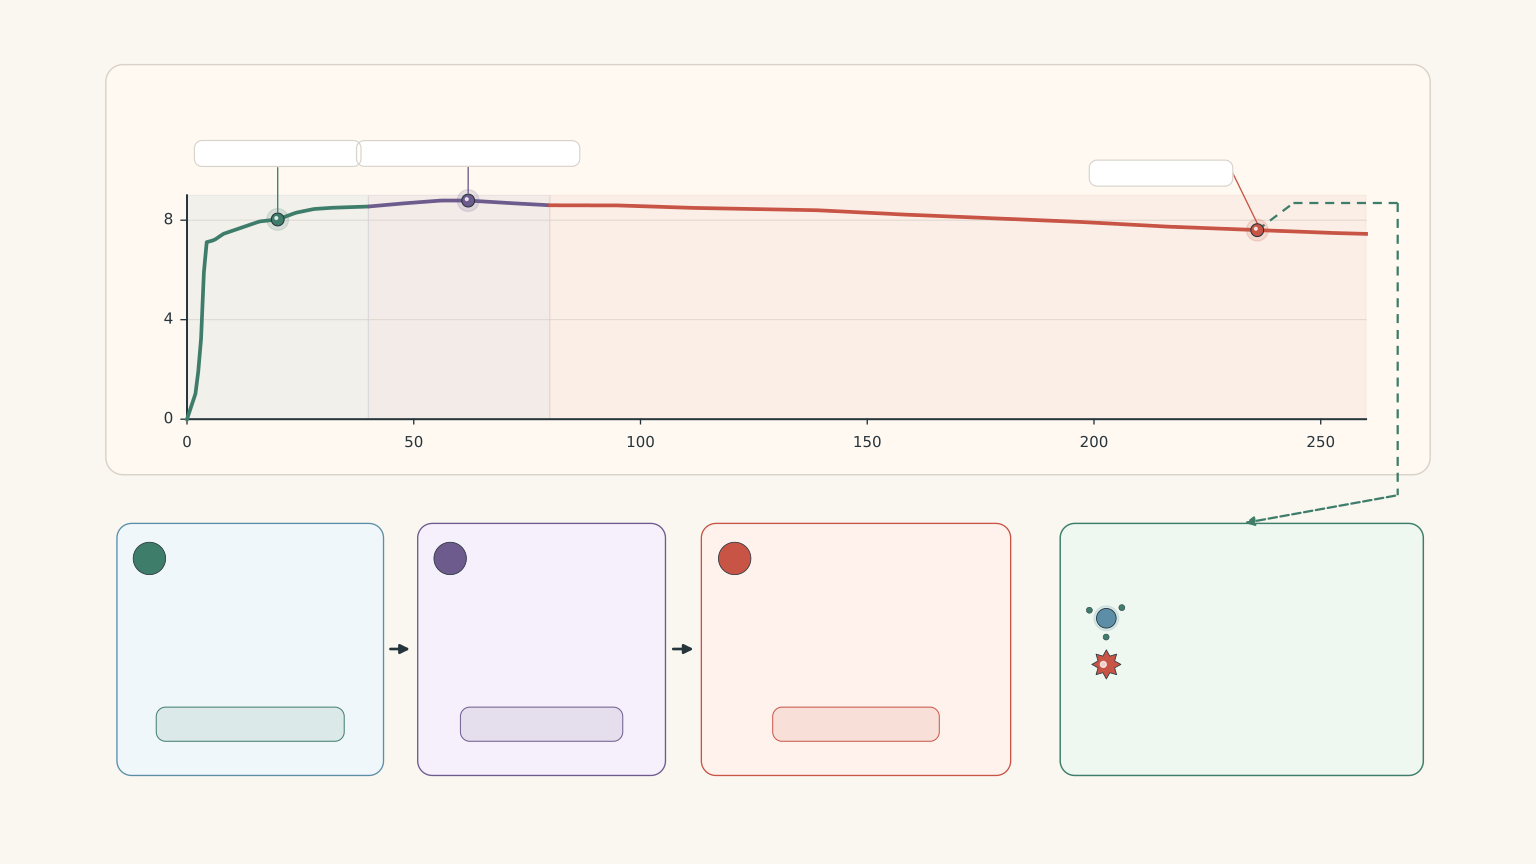
This doesn’t mean that heavier nuclei cannot form. They can. It means that building heavier nuclei by ordinary fusion is no longer a way for a star to gain net energy from the change in nuclear binding.
Heavy elements can form through other processes, including neutron capture and nucleosynthesis in explosive environments. Those processes involve different reaction pathways and energy sources, so they do not contradict the iron limit.
The limit is also not an exact cutoff at iron-56. The broad maximum includes several iron-group nuclei, and nickel-62 has a slightly higher binding energy per nucleon than iron-56.
06Energy release is not the same as nuclear stability
A positive energy release tells you that a specified reaction has a lower total final rest energy than its initial rest energy, assuming the reaction products and conservation laws have been correctly accounted for.
It does not tell you how quickly the reaction will happen, or whether the nucleus will spontaneously undergo that reaction.
The binding-energy curve compares the energies of nuclear arrangements. It does not show the energy barrier that might separate the initial nucleus from the final products.
Imagine a heavy nucleus whose fission products would have greater total binding energy. The final arrangement may be energetically favourable, but the nucleus may still need to pass through a configuration with a much higher energy before it can split. This is called a fission barrier.
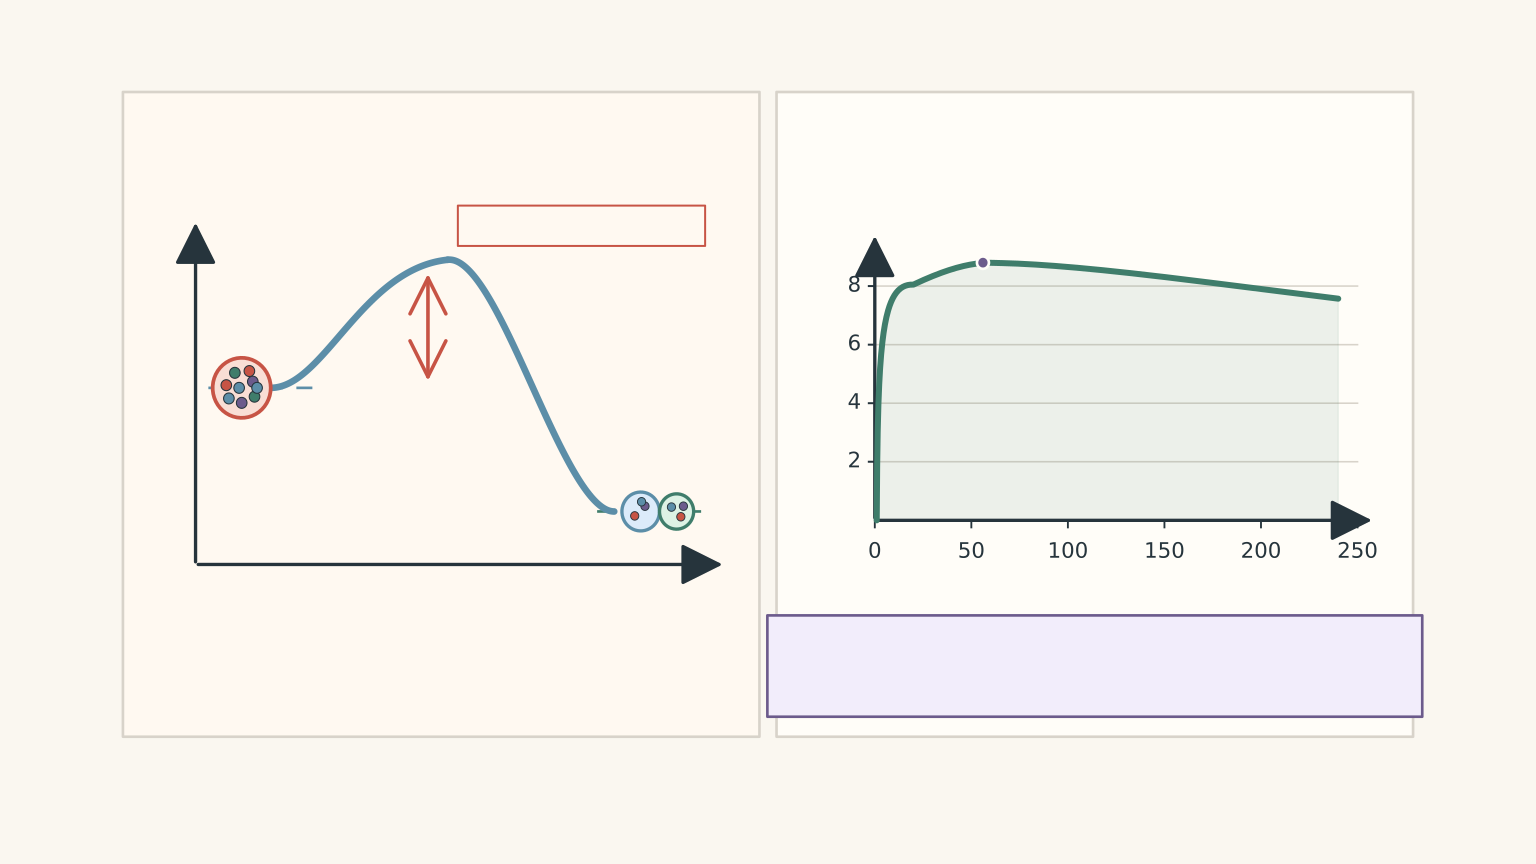
Quantum tunnelling can allow a nucleus to pass through a barrier, but the probability may be so small that the nucleus has an extremely long lifetime. A reaction can therefore be energetically favourable without occurring rapidly or being observed over a practical timescale.
The reverse distinction matters, too. A high binding energy per nucleon does not automatically make a nucleus stable against every possible radioactive decay. Stability depends on the available decay channels, the masses of the specific products, conservation laws, and the likelihood of the relevant process.
Use the curve to identify the broad energy trend. Use nuclear masses and information about the reaction pathway when you need to determine an exact energy release or explain whether a decay will occur.
07Common mistakes
– Comparing only the \(B/A\) values. The graph gives an average per nucleon. Multiply each value by its mass number to calculate the total binding energy before comparing the initial and final systems.
– Assuming all fusion releases energy. Fusion of light nuclei can move towards the peak, but fusion beyond the iron-group region generally moves away from it. The reaction’s name doesn’t determine its energy output.
– Treating iron-56 as the exact peak. Iron-56 lies very close to the maximum, but nickel-62 has a slightly higher binding energy per nucleon. The iron limit is a useful stellar-physics simplification, not a claim about one uniquely most-bound isotope.
– Assuming positive \(Q\) means a reaction happens spontaneously. Positive \(Q\) describes the energy balance of a specified reaction. It doesn’t tell you the height of a barrier or the reaction rate.
– Giving free neutrons a non-zero nuclear binding energy. A free neutron is not bound inside a nucleus. If fission emits neutrons, include the bound fragments in the total binding-energy calculation and assign the free neutrons zero nuclear binding energy.
08Questions and solutions
Question 1
A helium-4 nucleus has a binding energy per nucleon of \(7.1\ \text{MeV}\), and an oxygen-16 nucleus has a binding energy per nucleon of \(7.9\ \text{MeV}\). They fuse to form neon-20, which has a binding energy per nucleon of \(8.0\ \text{MeV}\).
Using these rounded values, calculate the energy released. Assume the total numbers of protons and neutrons are conserved.
Solution 1
The reaction releases approximately \(5.2\ \text{MeV}\). The product has greater total binding energy than the two reactants combined.
Step 1: Calculate the total binding energy of the reactants.
\[ \begin{aligned} B_{\text{reactants}} &=4(7.1)+16(7.9)\\\ &=28.4+126.4\\\ &=154.8\ \text{MeV} \end{aligned} \]
Step 2: Calculate the total binding energy of the product.
\[ \begin{aligned} B_{\text{products}} &=20(8.0)\\\ &=160.0\ \text{MeV} \end{aligned} \]
Step 3: Calculate the difference.
\[ \begin{aligned} Q&=160.0-154.8\\\ &=+5.2\ \text{MeV} \end{aligned} \]
The positive value indicates energy release. The important comparison is \(160.0\ \text{MeV}\) against \(154.8\ \text{MeV}\), not merely the change from \(7.1\) or \(7.9\) to \(8.0\ \text{MeV}\) per nucleon.
Question 2
A hypothetical nucleus with mass number \(A=100\) has a binding energy per nucleon of \(8.50\ \text{MeV}\). It emits an alpha particle with total binding energy \(28.3\ \text{MeV}\), leaving a daughter nucleus with \(A=96\) and binding energy per nucleon \(8.55\ \text{MeV}\).
Using these values, determine whether the specified alpha-emission channel releases energy or requires an energy input. Explain why the daughter nucleus’s higher binding energy per nucleon does not settle the question.
Solution 2
The specified channel requires approximately \(0.9\ \text{MeV}\) of energy input. Although the daughter has a higher binding energy per nucleon, the combined binding energy of the daughter and alpha particle is slightly lower than the initial total.
Step 1: Calculate the initial total binding energy.
\[ B_{\text{initial}}=100(8.50)=850.0\ \text{MeV} \]
Step 2: Calculate the total binding energy of the products.
The daughter nucleus has
\[ B_{\text{daughter}}=96(8.55)=820.8\ \text{MeV} \]
Including the alpha particle,
\[ \begin{aligned} B_{\text{final}}&=820.8+28.3\\\ &=849.1\ \text{MeV} \end{aligned} \]
Step 3: Calculate the energy change.
\[ \begin{aligned} Q&=849.1-850.0\\\ &=-0.9\ \text{MeV} \end{aligned} \]
The negative value means the channel requires an energy input of approximately \(0.9\ \text{MeV}\).
The trap is to look only at the daughter nucleus. Its \(B/A\) has increased, but the alpha particle must also be included. The total binding energy of every product determines the result.
Question 3
Consider two idealised fusion reactions. All binding-energy values are simplified curve readings, and the total numbers of protons and neutrons are conserved in each reaction.
- Reaction I: Two nuclei, each with \(A=20\) and \(B/A=8.0\ \text{MeV}\), fuse to form a nucleus with \(A=40\) and \(B/A=8.5\ \text{MeV}\).
- Reaction II: Two nuclei, each with \(A=60\) and \(B/A=8.8\ \text{MeV}\), fuse to form a nucleus with \(A=120\) and \(B/A=8.5\ \text{MeV}\).
Calculate the energy change for each reaction. Explain why the fact that both reactions involve fusion does not mean both release energy.
Solution 3
Reaction I releases \(20\ \text{MeV}\), whereas Reaction II requires \(36\ \text{MeV}\). Fusion can release or absorb energy depending on the total binding-energy change.
Step 1: Calculate the energy change for Reaction I.
The initial total binding energy is
\[ B_i=2(20)(8.0)=320\ \text{MeV} \]
The final total binding energy is
\[ B_f=40(8.5)=340\ \text{MeV} \]
Therefore,
\[ Q_1=340-320=+20\ \text{MeV} \]
Reaction I releases \(20\ \text{MeV}\) because the product is more tightly bound overall.
Step 2: Calculate the energy change for Reaction II.
The initial total binding energy is
\[ B_i=2(60)(8.8)=1056\ \text{MeV} \]
The final total binding energy is
\[ B_f=120(8.5)=1020\ \text{MeV} \]
Therefore,
\[ Q_2=1020-1056=-36\ \text{MeV} \]
Reaction II requires \(36\ \text{MeV}\) of energy input under the stated assumptions.
Step 3: Connect the results to the curve.
Reaction I moves from lighter nuclei towards the peak, increasing the total binding energy. Reaction II begins near the peak and produces a heavier nucleus with a lower binding energy per nucleon. Its total binding energy consequently decreases.
The tempting assumption is that fusion always releases energy because nuclei combine. The curve shows why that is false: fusion is favourable as an energy source only when the complete reaction’s energy balance supports it.
Question 4
A hypothetical heavy nucleus has \(A=208\) and \(B/A=7.9\ \text{MeV}\). An idealised fission channel produces two fragments, each with \(A=104\) and \(B/A=8.5\ \text{MeV}\). Assume the channel conserves the total numbers of protons and neutrons.
(a) Estimate the energy released.
(b) Suppose the nucleus does not undergo observable spontaneous fission. Does that contradict your calculation? Explain.
Solution 4
(a) The idealised fission channel releases approximately \(124.8\ \text{MeV}\).
(b) The absence of observable spontaneous fission does not contradict the energy calculation. The curve compares the initial and final binding energies but does not show the fission barrier or the rate of the process.
Step 1: Calculate the initial total binding energy.
\[ \begin{aligned} B_i&=208(7.9)\\\ &=1643.2\ \text{MeV} \end{aligned} \]
Step 2: Calculate the total binding energy of the fragments.
\[ \begin{aligned} B_f&=2(104)(8.5)\\\ &=1768.0\ \text{MeV} \end{aligned} \]
Step 3: Find the energy change.
\[ \begin{aligned} Q&=1768.0-1643.2\\\ &=+124.8\ \text{MeV} \end{aligned} \]
The positive result means the idealised products have greater total binding energy than the initial nucleus.
However, a favourable final energy does not guarantee that the nucleus will reach that final state. The fission pathway may involve a substantial energy barrier. Quantum tunnelling through that barrier may be extremely unlikely, giving the nucleus a very long lifetime.
This calculation is an estimate based on the supplied curve readings, not an exact prediction for a particular isotope. The essential distinction remains: energy release describes the endpoint energy difference, while stability and reaction rate depend on the available pathway as well.
Question 5
A hypothetical heavy nucleus \(X\) has mass number \(A=120\) and binding energy per nucleon \(8.50\ \text{MeV}\). Consider two idealised processes:
- Process I: \(X\) captures four free neutrons to form nucleus \(Y\), with \(A=124\) and binding energy per nucleon \(8.49\ \text{MeV}\).
- Process II: \(X\) splits into two fragments, each with \(A=60\) and binding energy per nucleon \(8.70\ \text{MeV}\).
Treat the supplied values as exact for these channels. Assume that the total numbers of protons and neutrons are conserved when the free neutrons are included, and that no other nuclear products are formed apart from photons carrying away the released energy.
(a) Calculate the energy released by each process.
(b) Which process releases more energy according to these values?
(c) A student argues that Process I cannot release energy because the product has a lower binding energy per nucleon than \(X\). Identify the error.
(d) Can you conclude that either process must occur spontaneously in an isolated sample of \(X\)? Explain your reasoning.
Solution 5
(a) Process I releases \(32.76\ \text{MeV}\), and Process II releases \(24.0\ \text{MeV}\).
(b) Process I releases \(8.76\ \text{MeV}\) more than Process II under the supplied assumptions.
(c) The student’s argument confuses binding energy per nucleon with total binding energy. Process I increases the total binding energy even though its average per nucleon decreases.
(d) Neither process is guaranteed to occur spontaneously. Neutron capture requires available neutrons, and the binding-energy curve alone cannot establish whether fission will occur spontaneously or how quickly it will happen.
Step 1: Calculate the initial total binding energy of \(X\).
\[ \begin{aligned} B_X&=120(8.50)\\\ &=1020.00\ \text{MeV} \end{aligned} \]
Step 2: Calculate the energy released by Process I.
The four incoming neutrons are free, so their nuclear binding energy is zero.
The final nucleus has total binding energy
\[ \begin{aligned} B_Y&=124(8.49)\\\ &=1052.76\ \text{MeV} \end{aligned} \]
The energy released is therefore
\[ \begin{aligned} Q_I&=1052.76-1020.00\\\ &=+32.76\ \text{MeV} \end{aligned} \]
Process I releases \(32.76\ \text{MeV}\).
Notice the surprising result: \(B/A\) decreases from \(8.50\) to \(8.49\ \text{MeV}\), yet the total binding energy increases. The nucleus has more nucleons, and the total binding energy of the larger nucleus exceeds that of \(X\) plus the four free neutrons.
Step 3: Calculate the energy released by Process II.
The two fragments have a combined mass number of \(120\), so their total binding energy is
\[ \begin{aligned} B_{\text{fragments}}&=2(60)(8.70)\\\ &=1044.0\ \text{MeV} \end{aligned} \]
The energy released is
\[ \begin{aligned} Q_{II}&=1044.0-1020.0\\\ &=+24.0\ \text{MeV} \end{aligned} \]
Process II releases \(24.0\ \text{MeV}\).
Step 4: Compare the two processes.
\[ \begin{aligned} Q_I-Q_{II}&=32.76-24.0\\\ &=8.76\ \text{MeV} \end{aligned} \]
Process I releases \(8.76\ \text{MeV}\) more energy than Process II, according to the supplied values.
This does not mean neutron capture is always more energy-releasing than fission. The result applies to these particular idealised channels. Different nuclei and reaction products give different energy balances.
Step 5: Decide what the calculations tell you about spontaneous reactions.
Process I cannot occur in an isolated sample of \(X\) if no free neutrons are available. Capturing neutrons requires an external supply of them.
Process II has a positive energy release, but that alone does not prove spontaneous fission will occur. The nucleus may face a substantial fission barrier, and the curve does not tell you the barrier height or the probability of crossing it.
The final lesson is that three separate questions require three separate pieces of reasoning:
- The binding-energy curve helps predict the direction of the energy change.
- Total binding energies, or exact nuclear masses, determine how much energy a specified reaction releases.
- Reaction pathways and barriers determine whether the reaction can occur and how quickly it proceeds.
09Next step: From the curve to nuclear mass calculations
When an HSC question gives you a binding-energy curve, use it to predict why light-nucleus fusion and heavy-nucleus fission can release energy. When it asks for a numerical energy release, calculate the total binding energies of all the products and reactants, or use their masses to calculate \(Q\) directly.
For stellar evolution questions, connect the broad peak near iron and nickel to the iron limit: ordinary fusion can no longer provide a continuing net energy source once the core reaches the iron-group region. That is an energy-production limit, not a claim that heavier nuclei cannot exist or form.
The most useful habit is to separate the energy balance from the reaction pathway. A favourable energy change tells you what the products can gain energetically; it doesn’t, by itself, tell you whether the reaction will happen.