
Why a Galvanic Cell’s Measured Voltage Differs from E°
A galvanic cell's measured voltage may differ from its standard potential because real experimental conditions are not always standard. Learn how concentration, temperature, electrode surfaces, salt bridges, and measurement effects influence the result, and how to troubleshoot discrepancies systematically.
A zinc-copper galvanic cell has a tabulated standard cell potential of +1.10 V. You build one in the lab, connect a voltmeter, and read +1.04 V. Is the table wrong, or has the experiment failed?
Neither conclusion follows yet. The tabulated value applies to defined standard conditions, while your reading comes from the cell you actually made.
Before checking the equipment, predict this: if you reduce the concentration of \(\mathrm{Cu}^{2+}\) from 1.0 mol L\(^{-1}\) to 0.10 mol L\(^{-1}\), while keeping \(\mathrm{Zn}^{2+}\) at 1.0 mol L\(^{-1}\), will the cell potential rise, fall, or stay the same?
It will fall. Copper(II) ions are a reactant in the forward cell reaction, so reducing their concentration makes that reaction less favourable. But there’s a catch: changing both solution concentrations together can produce a different result. Understanding why requires separating the cell’s predicted potential from the voltage your experiment measures.
Standard conditions versus a real cell
| Standard cell potential, E° | Aqueous species: 1.0 mol L⁻¹; temperature: 25 °C; gases: 100 kPa. Pure solids and liquids in their standard states. |
|---|---|
| Practical voltage, E | Actual solution concentrations, temperature, and electrode surfaces. Salt bridge, electrical connections, and meter effects can influence the reading. |
01What does a standard potential actually mean?
A standard reduction potential describes a half-reaction written as a reduction under standard conditions. It is a reference value, not a guarantee that every practical cell containing the same substances will produce exactly that voltage.
For HSC Chemistry, the usual standard conditions are:
- Aqueous species at concentrations of 1.0 mol L\(^{-1}\).
- Gases at a pressure of 100 kPa.
- A temperature of 25°C, or 298 K.
- Pure solids and liquids in their standard states.
These conditions define the circumstances to which the tabulated values refer. If your solutions have different concentrations, your cell is operating under non-standard conditions even if you use exactly the same metals.
How are standard reduction potentials measured?
There is an experimental problem here: a voltmeter measures a potential difference between two terminals. You cannot connect a voltmeter to a single isolated half-cell and directly measure its absolute electrode potential.
Scientists solve this by comparing the half-cell with a reference electrode called the standard hydrogen electrode.
The reference half-cell contains a platinum electrode in an acidic solution with a hydrogen-ion concentration of 1.0 mol L\(^{-1}\). Hydrogen gas at 100 kPa contacts the platinum surface, and the system is maintained at 25°C.
The reference electrode and the half-cell being investigated are connected in two ways:
- An external wire connects their conducting terminals, allowing electrons to flow.
- A salt bridge connects their solutions, allowing ions to migrate and maintain electrical neutrality.
A voltmeter connected across the terminals measures the potential difference between the two half-cells. The standard hydrogen electrode is assigned a potential of exactly 0.00 V, establishing the reference scale used for the table.
How standard reduction potentials are established
- Prepare the test half-cell
Use standard conditions: 1.0 mol L⁻¹ aqueous species, 25 °C, and 100 kPa for gases.
- Connect the reference
Connect to the standard hydrogen electrode, assigned 0.00 V, using a wire and salt bridge.
- Measure and assign
Measure the potential difference and interpret its sign to determine the test half-cell’s standard reduction potential.
The important consequence is that standard reduction potentials are relative measurements. Every value in the table uses the same reference convention.
Calculating a standard cell potential
The table lists reduction potentials for individual half-reactions. To calculate the standard potential of a complete galvanic cell, subtract the anode’s standard reduction potential from the cathode’s standard reduction potential.
\[ E^\circ_{\text{cell}} = E^\circ_{\text{red,cathode}} - E^\circ_{\text{red,anode}} \]
Here:
- \(E^\circ_{\text{cell}}\) is the standard cell potential, in volts.
- \(E^\circ_{\text{red,cathode}}\) is the standard reduction potential of the cathode.
- \(E^\circ_{\text{red,anode}}\) is the standard reduction potential of the anode, also taken from the reduction-potential table.
The anode is where oxidation occurs, but the table still lists its half-reaction as a reduction. That’s why you subtract its tabulated value.
Worked example: Calculate the standard potential of a Zn/Cu cell
A standard galvanic cell contains a zinc electrode in a 1.0 mol L\(^{-1}\) solution of \(\mathrm{Zn}^{2+}\) and a copper electrode in a 1.0 mol L\(^{-1}\) solution of \(\mathrm{Cu}^{2+}\). The standard reduction potentials are:
- \(\ce{Cu^2+ + 2e^- -> Cu}\): \(+0.34\text{ V}\)
- \(\ce{Zn^2+ + 2e^- -> Zn}\): \(-0.76\text{ V}\)
Calculate the standard cell potential and identify the direction of electron flow.
Step 1
Copper(II) ions are reduced at the cathode. Zinc is oxidised at the anode.
Step 2
\[ \begin{aligned} E^\circ_{\text{cell}} &=E^\circ_{\text{red,cathode}} -E^\circ_{\text{red,anode}}\\ &=+0.34-(-0.76)\\ &=+1.10\text{ V} \end{aligned} \]
Step 3
The standard cell potential is \(+1.10\text{ V}\). The positive value indicates that the cell reaction as written is spontaneous under standard conditions.
Electrons travel through the external wire from zinc to copper. The calculated value is the standard-condition prediction, not necessarily the voltage a practical cell will display.
02Why concentration changes the cell potential
Consider the overall reaction in the zinc-copper cell:
\[ \ce{Zn(s) + Cu^2+(aq) -> Zn^2+(aq) + Cu(s)} \]
Zinc reacts to form zinc ions, while copper(II) ions gain electrons to form copper metal.
The standard cell potential is \(+1.10\text{ V}\) when both aqueous ions are at their standard concentrations. What happens when one solution is diluted?
The answer depends on which concentration changes.
Case 1: Lower the zinc-ion concentration
Suppose \([\mathrm{Zn}^{2+}]\) decreases to 0.10 mol L\(^{-1}\), while \([\mathrm{Cu}^{2+}]\) remains at 1.0 mol L\(^{-1}\).
Zinc ions are products of the forward reaction. Lowering their concentration makes the forward reaction more favourable relative to the reverse reaction. The cell potential increases above its standard value under the ideal model.
Case 2: Lower the copper-ion concentration
Now keep \([\mathrm{Zn}^{2+}]\) at 1.0 mol L\(^{-1}\), but reduce \([\mathrm{Cu}^{2+}]\) to 0.10 mol L\(^{-1}\).
Copper(II) ions are reactants. Lowering their concentration makes the forward reaction less favourable, so the cell potential decreases below its standard value.
This is the prediction from the opening example. The electrodes and the overall reaction have not changed, but the conditions under which the reaction occurs have.
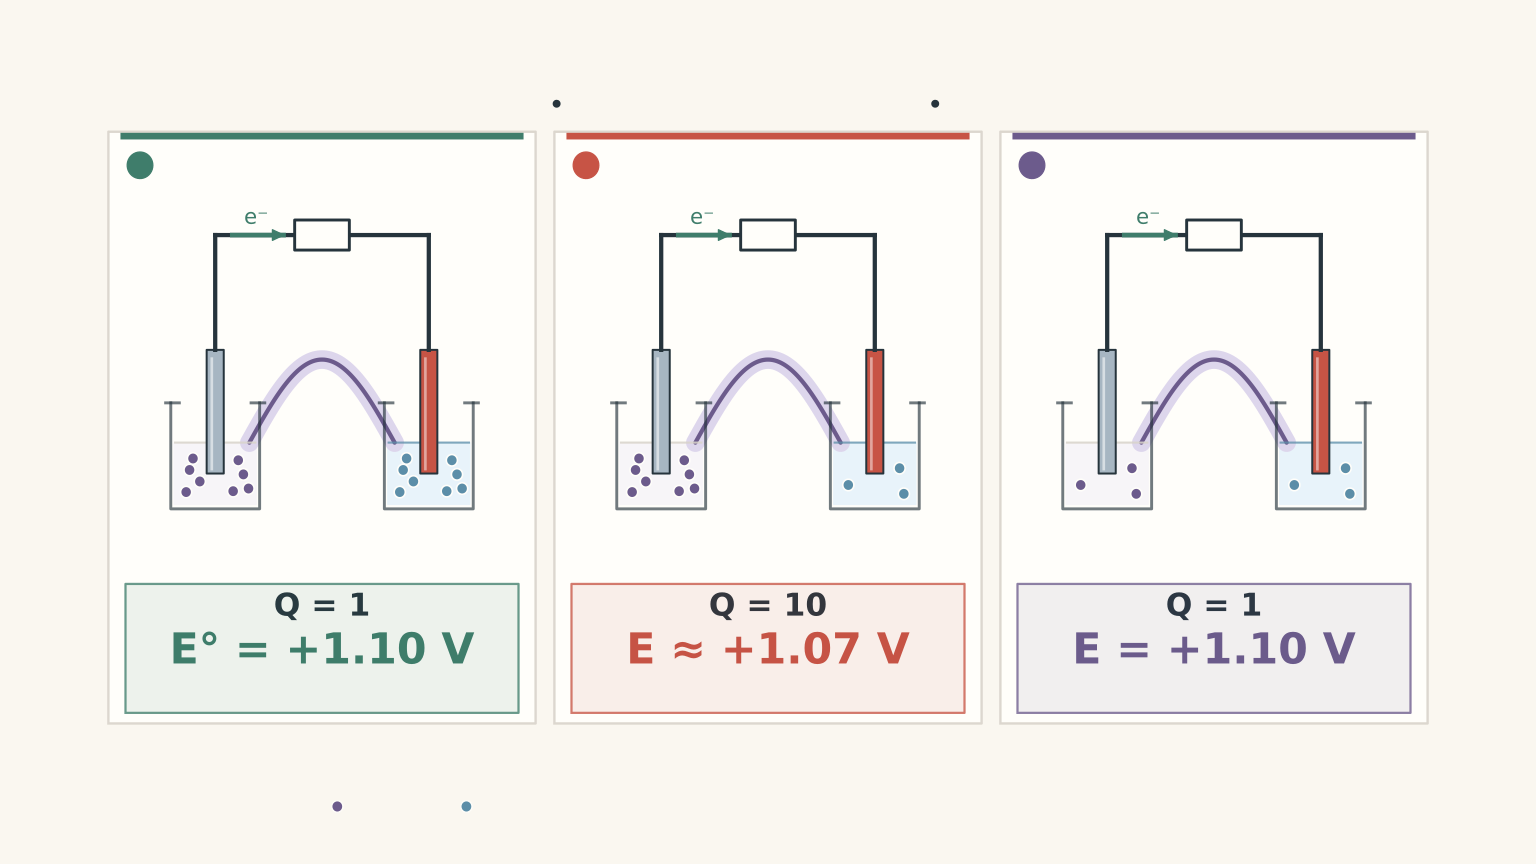
The deeper idea: the two concentrations interact
For this reaction, the concentration ratio is represented by the reaction quotient \(Q\):
\[ Q=\frac{[\mathrm{Zn}^{2+}]}{[\mathrm{Cu}^{2+}]} \]
The pure solids are omitted because their activities are treated as constant.
Under standard conditions, both ion concentrations are 1.0 mol L\(^{-1}\), so \(Q=1\). If the zinc-ion concentration falls while the copper-ion concentration stays fixed, \(Q\) falls below 1. If the copper-ion concentration falls while the zinc-ion concentration stays fixed, \(Q\) rises above 1.
This ratio helps explain a result that initially seems strange: if both ion concentrations are diluted by the same factor, the ratio stays unchanged.
For example, if both concentrations decrease from 1.0 mol L\(^{-1}\) to 0.10 mol L\(^{-1}\), then \(Q\) remains equal to 1. In the ideal model at constant temperature, the concentration effects on the two half-cell potentials cancel when their difference is calculated. The predicted open-circuit cell potential therefore remains equal to the standard cell potential.
This is a more precise model than simply saying that a dilute solution must produce a lower voltage.
For non-standard conditions, the Nernst equation calculates the size of the potential change. The standard reduction-potential table alone does not give the exact cell potential for arbitrary concentrations.
Temperature matters, too
Standard potentials are defined at a specified temperature, conventionally 25°C for HSC problems. Changing the temperature can change the potential of the cell as well as the conductivity of its solutions.
Do not assume that increasing the temperature must increase or decrease the cell potential. The direction depends on the particular reaction and its thermodynamic properties.
If you are comparing experimental readings, keep the temperature constant. Otherwise, a concentration change and a temperature change may both contribute to the observed difference.
What about the electrode surfaces?
A zinc strip covered with an oxide layer is not necessarily going to behave as neatly as a clean zinc surface.
Contamination, oxidation, and passivation can interfere with electron transfer. They can slow the electrode reaction, cause polarisation, and make readings unstable or lower under load. If the surface is chemically altered, the electrode may no longer behave like the intended pure-metal/ion half-cell.
There is an important distinction here. A dirty surface does not automatically change the ideal standard reduction potential of the same chemical half-reaction. It can, however, make a practical experiment less representative of that ideal system.
03Why the voltmeter can show a different voltage
Even if you have the correct substances and concentrations, you need to consider how the voltage is measured.
An open-circuit measurement uses a high-input-resistance voltmeter connected across the cell terminals. Very little current flows through the meter, so the reading approximates the cell’s electromotive force, or emf, under its actual conditions.
That is not necessarily the standard cell potential. If the concentrations or temperature differ from standard conditions, the open-circuit reading can differ from \(E^\circ_{\text{cell}}\).
Now connect a resistor or another device to the cell. Current begins to flow. The voltage measured across the cell terminals can fall because the cell has internal resistance.
A simple model describes this as
\[ V=E-Ir_{\text{int}} \]
where:
- \(V\) is the terminal voltage under load, in volts.
- \(E\) is the cell’s open-circuit emf under the same chemical conditions, in volts.
- \(I\) is the current, in amperes.
- \(r_{\text{int}}\) is the effective internal resistance, in ohms.
The equation is an approximation. Real cells can also show polarisation and other effects that depend on current and time.
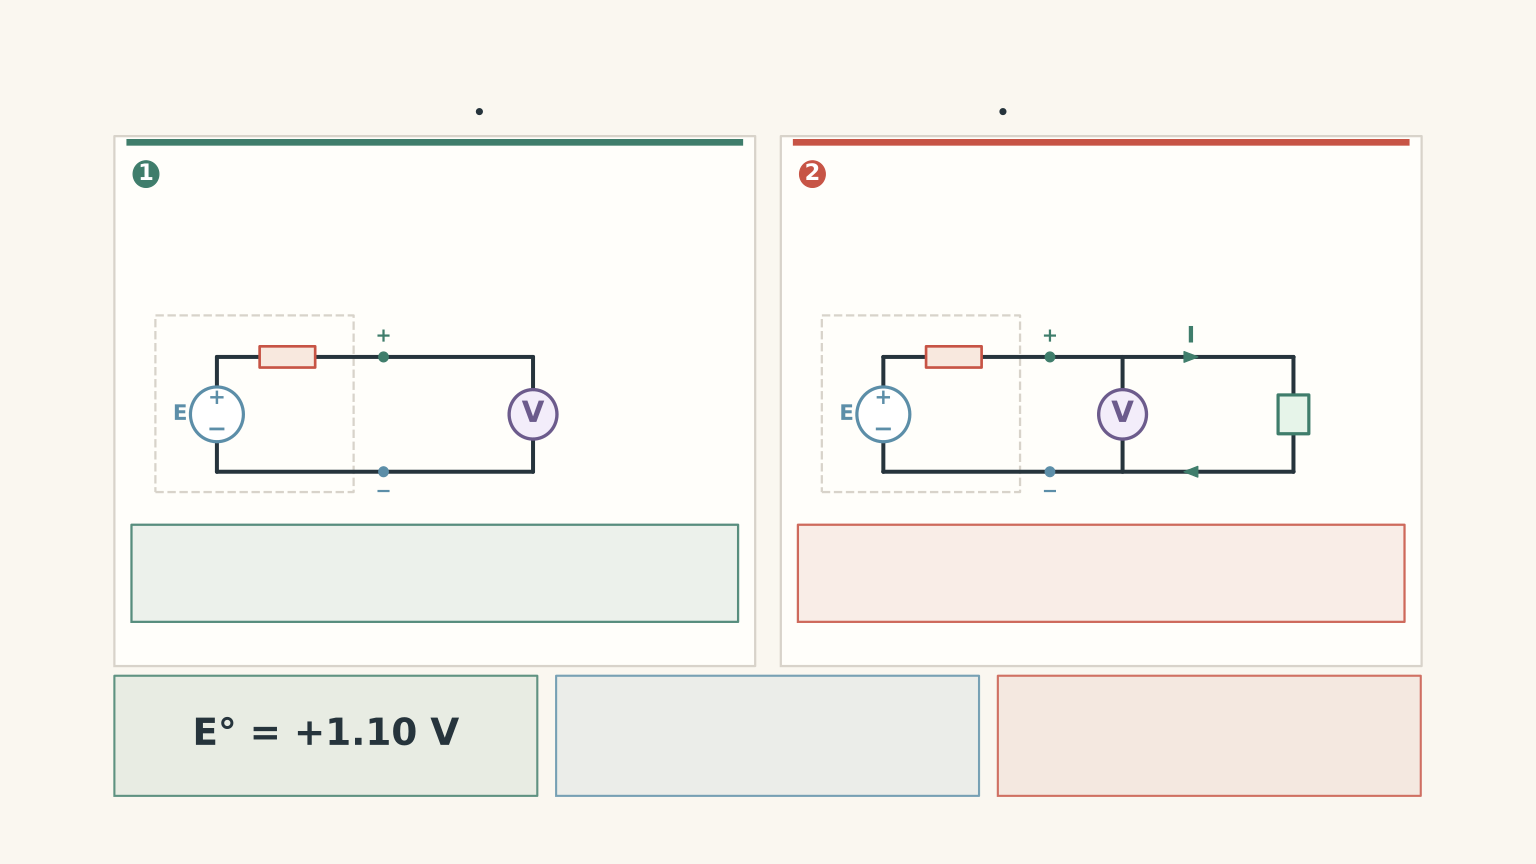
Worked example: Separate a standard-potential difference from a load effect
A Zn/Cu cell has a calculated standard cell potential of \(+1.10\text{ V}\). A high-resistance voltmeter reads \(+1.07\text{ V}\) when the cell is open circuit. When a load is connected, the terminal voltage falls to \(+0.98\text{ V}\).
Calculate the difference between the standard potential and the open-circuit reading, then calculate the additional drop under load. Explain what each difference suggests.
Step 1
\[ \begin{aligned} \Delta V_{\text{standard-open}} &=1.10-1.07\\ &=0.03\text{ V} \end{aligned} \]
The open-circuit reading is 0.03 V below the standard prediction. Possible explanations include non-standard concentrations, a temperature difference, measurement uncertainty, or an experimental limitation.
Step 2
\[ \begin{aligned} \Delta V_{\text{load}} &=1.07-0.98\\ &=0.09\text{ V} \end{aligned} \]
The terminal voltage drops by another 0.09 V when current flows. This points towards internal resistance, polarisation, or related effects under load.
Step 3
The first difference compares a practical open-circuit measurement with a standard-condition prediction. The second compares the cell’s open-circuit emf with its terminal voltage under load.
Treating both differences as the same kind of error would hide useful information about how the cell is behaving.
04A practical checklist before blaming the table
When your reading differs from the predicted value, work through these checks in order. Change one variable at a time so you can identify which change affects the result.

1. Check the calculation and reaction direction
- [ ] Identify the cathode and anode correctly.
- [ ] Use the standard reduction potentials as tabulated.
- [ ] Calculate \(E^\circ_{\text{cell}}\) by subtracting the anode reduction potential from the cathode reduction potential.
- [ ] Check that you have not reversed the sign twice.
- [ ] Confirm that the overall reaction matches the half-reactions you used.
A sign error can produce a perfectly consistent calculation for the wrong reaction. Check this before investigating the equipment.
2. Check the solution preparation
- [ ] Verify the concentration of each solution, rather than relying only on its label.
- [ ] Check the dilution calculations and the volumetric equipment used.
- [ ] Make sure the solutions have not been contaminated or mixed accidentally.
- [ ] Check that the solutions have not been diluted by residual rinse water or changed by evaporation.
- [ ] Record the actual temperature.
If the concentration of either ion differs from the standard concentration, the standard cell potential is not an exact prediction of the open-circuit voltage. A correctly assembled cell can produce a different reading without any fault in the table.
3. Check the electrode surfaces
- [ ] Confirm that each electrode is made from the correct metal.
- [ ] Remove oxide layers or contamination using the appropriate laboratory procedure.
- [ ] Rinse the electrodes and avoid transferring contaminants between solutions.
- [ ] Check that the electrical leads make firm contact with the metal.
- [ ] Keep the immersed electrode area and preparation method consistent when comparing trials.
The aim is to make the electrode reactions reproducible. Cleaning alone cannot correct an incorrectly prepared solution or a miscalculated cell potential.
4. Check the salt bridge
- [ ] Make sure the bridge is properly wetted and both ends contact the solutions.
- [ ] Check for blockages or poor ionic contact.
- [ ] Use an electrolyte that does not react with the half-cell solutions or form an unwanted precipitate.
- [ ] Check that the bridge has not dried out during the experiment.
The salt bridge completes the ionic part of the circuit. It allows ions to migrate so that charge does not build up in the half-cells and stop the reaction.
Think of it as a separate route for ions that prevents a charge build-up from bringing the process to a halt. The analogy has a limit: the bridge does not supply the electrons, and it does not create the cell’s energy.
A dry or poorly conducting bridge can increase internal resistance and cause low or unstable readings. Differences in the liquid junction between solutions can also introduce a small contribution to the measured voltage.
5. Check the electrical connections
- [ ] Confirm that the leads make firm, clean contact with the correct electrodes.
- [ ] Check for corroded clips or loose wires.
- [ ] Make sure the voltmeter is set to measure DC voltage.
- [ ] Check the polarity of the meter connections.
Reversing the voltmeter leads reverses the sign of the reading, not the cell’s chemical behaviour. A reading of \(-1.08\text{ V}\) instead of \(+1.08\text{ V}\) may simply indicate reversed connections.
A loose connection is more likely to produce a fluctuating or intermittent reading than a reliable, stable voltage.
6. Check how the voltage is measured
- [ ] Use a high-input-resistance voltmeter for an open-circuit measurement.
- [ ] Allow the reading to stabilise, and note whether it changes with time.
- [ ] Compare the open-circuit reading with the reading under load.
- [ ] Check the instrument’s calibration if a stable discrepancy remains.
- [ ] Repeat the measurement under controlled conditions.
If the voltage falls only when current flows, investigate internal resistance and polarisation. If the open-circuit reading is already different from the expected value, check the concentrations, temperature, electrode conditions, and instrument before drawing conclusions.
Reading the symptoms
| Observation | First explanation to investigate |
|---|---|
| Correct magnitude, but negative sign | Reversed voltmeter leads or incorrect identification of the cell direction |
| Reading fluctuates or changes suddenly | Loose connections, a dry salt bridge, temperature changes, or changing conditions at an electrode |
| Open-circuit reading is reasonable, but voltage falls under load | Internal resistance or polarisation |
| Stable open-circuit reading differs from \(E^\circ_{\text{cell}}\) | Non-standard conditions, measurement uncertainty, calibration, or an incorrectly modelled reaction |
| Concentration changes produce the expected direction of voltage change | Non-standard concentrations are likely contributing to the difference |
A repeated reading is useful, but repetition alone does not remove a systematic error. Three identical readings from a miscalibrated meter can still be wrong.
Likewise, do not immediately blame the electrode surfaces whenever the voltage is low. A stable, reproducible difference may be a consequence of the solution conditions rather than a fault in the apparatus.
The strongest test is a controlled one: verify the conditions, change one factor, and observe whether the reading changes in the direction your chemical model predicts.
05Questions and solutions
Question 1
At 25°C, the standard reduction potentials are:
- \(\ce{Ag+ + e^- -> Ag}\): \(+0.80\text{ V}\)
- \(\ce{Cu^2+ + 2e^- -> Cu}\): \(+0.34\text{ V}\)
A standard galvanic cell uses silver as the cathode and copper as the anode.
Calculate the standard cell potential and state the direction of electron flow.
Solution 1
The standard cell potential is \(+0.46\text{ V}\), and electrons flow from the copper electrode to the silver electrode through the external circuit.
The cathode is where reduction occurs, so use the silver reduction potential as the cathode value. The copper electrode is the anode, but its value must still be taken from the reduction-potential table.
\[ \begin{aligned} E^\circ_{\text{cell}} &=E^\circ_{\text{red,cathode}} -E^\circ_{\text{red,anode}}\\ &=+0.80-(+0.34)\\ &=+0.46\text{ V} \end{aligned} \]
The positive result indicates a spontaneous cell reaction under standard conditions. The common trap is to reverse the sign of the anode potential and then subtract it again. Use the table values directly in the formula.
Question 2
A Zn/Cu galvanic cell operates at 25°C with \([\mathrm{Zn}^{2+}]=1.0\text{ mol L}^{-1}\) and \([\mathrm{Cu}^{2+}]=0.10\text{ mol L}^{-1}\). Its standard cell potential is \(+1.10\text{ V}\).
One student claims that the cell potential must remain \(+1.10\text{ V}\) because the electrodes and half-reactions are unchanged. Another predicts that the actual cell potential will be lower than the standard value.
Which prediction is better supported? Can the exact non-standard cell potential be calculated from the standard reduction-potential table alone?
Solution 2
The second student’s prediction is correct: the cell potential is expected to be lower than \(+1.10\text{ V}\) under the ideal model, and the standard reduction-potential table alone cannot provide its exact value under these non-standard conditions.
The overall reaction is
\[ \ce{Zn(s) + Cu^2+(aq) -> Zn^2+(aq) + Cu(s)} \]
Copper(II) ions are reactants in the forward reaction. Reducing their concentration while keeping the zinc-ion concentration unchanged makes the forward reaction less favourable relative to the reverse reaction.
The reaction quotient is
\[ Q=\frac{1.0}{0.10}=10 \]
The product-ion concentration is now high relative to the reactant-ion concentration, compared with the standard condition. This shifts the cell potential below the standard value.
The first student’s mistake is assuming that unchanged electrodes guarantee an unchanged cell potential. Electrode identity determines which half-reactions are possible, but the actual potential also depends on the conditions under which those reactions occur.
The exact numerical value requires a relationship for non-standard conditions, such as the Nernst equation.
Question 3
Two nominally standard Zn/Cu cells use the same solutions, clean electrodes, and high-input-resistance voltmeter.
Cell A uses a fresh, properly wetted potassium nitrate salt bridge and gives a stable reading of \(+1.08\text{ V}\).
Cell B uses a salt bridge that has partly dried out. Its reading fluctuates between \(+0.62\text{ V}\) and \(+0.86\text{ V}\). When the bridge is replaced with a fresh, properly wetted one, Cell B stabilises at \(+1.08\text{ V}\).
Explain why the salt bridge affects the measurement. Does this observation prove that the standard reduction-potential table is wrong?
Solution 3
The observations identify the salt bridge as the source of the unstable reading, and they do not show that the standard reduction-potential table is wrong.
The salt bridge allows ions to migrate between the half-cells and maintain electrical neutrality. If it dries out, ionic conduction becomes less effective. Charge can accumulate, the cell’s internal resistance can increase, and the voltage reading can become unstable.
Replacing the bridge restores the ionic pathway, after which both cells produce the same reading under the stated conditions.
The salt bridge does not carry electrons through the external circuit. Its role is to maintain the ionic connection that allows the electrode reactions to continue.
The remaining difference between \(+1.08\text{ V}\) and the tabulated \(+1.10\text{ V}\) still needs to be assessed. It could reflect measurement uncertainty, small departures from standard conditions, or another experimental limitation. The original unstable reading, however, is directly linked to the bridge because replacing it removes the instability.
Question 4
A student investigates a Zn/Cu cell at 25°C. The standard cell potential is \(+1.10\text{ V}\). The same cleaned electrodes, fresh salt bridge, and high-input-resistance voltmeter are used for each trial.
| Trial | \([\mathrm{Zn}^{2+}]\) | \([\mathrm{Cu}^{2+}]\) | Open-circuit reading |
|---|---|---|---|
| A | 1.0 mol L\(^{-1}\) | 1.0 mol L\(^{-1}\) | \(+1.09\text{ V}\) |
| B | 0.10 mol L\(^{-1}\) | 1.0 mol L\(^{-1}\) | \(+1.12\text{ V}\) |
| C | 1.0 mol L\(^{-1}\) | 0.10 mol L\(^{-1}\) | \(+1.06\text{ V}\) |
Repeated readings are stable to approximately \(\pm 0.01\text{ V}\).
Calculate the change in voltage from Trial A to Trials B and C. Explain whether the results support a concentration effect, and evaluate the claim that all three readings are incorrect because they do not exactly match \(+1.10\text{ V}\).
Solution 4
The readings support the predicted concentration effects, and the small difference between Trial A and the standard value does not establish that the table is wrong.
Step 1: Calculate the change from Trial A to Trial B.
\[ \begin{aligned} \Delta V_{A\to B} &=1.12-1.09\\ &=+0.03\text{ V} \end{aligned} \]
The voltage increases when the zinc-ion concentration is lowered. Zinc ions are products of the forward reaction, so reducing their concentration makes the forward reaction more favourable relative to the reverse reaction.
Step 2: Calculate the change from Trial A to Trial C.
\[ \begin{aligned} \Delta V_{A\to C} &=1.06-1.09\\ &=-0.03\text{ V} \end{aligned} \]
The voltage decreases when the copper-ion concentration is lowered. Copper(II) ions are reactants in the forward reaction, so reducing their concentration makes the forward reaction less favourable.
Step 3: Evaluate the claim about the table.
Trial A is \(0.01\text{ V}\) below the tabulated value. That difference is comparable to the stated measurement uncertainty. Trials B and C are also consistent with the expected directions of the concentration effects.
The results therefore support the idea that concentration changes affect cell potential. They do not show that the standard reduction-potential table is incorrect.
To distinguish a meter offset from a solution-preparation error, first measure the same unchanged cell with a second calibrated, high-input-resistance voltmeter. Then, separately, prepare fresh standard solutions using calibrated volumetric equipment and repeat the measurement with the original meter. Changing one factor at a time makes the evidence more useful.
Question 5
Two idealised Zn/Cu cells operate at 25°C. Assume ideal solutions, negligible liquid-junction effects, identical clean electrodes and cell geometry, and the same salt bridge.
- Cell A contains \([\mathrm{Zn}^{2+}]=1.0\text{ mol L}^{-1}\) and \([\mathrm{Cu}^{2+}]=1.0\text{ mol L}^{-1}\).
- Cell B contains \([\mathrm{Zn}^{2+}]=0.10\text{ mol L}^{-1}\) and \([\mathrm{Cu}^{2+}]=0.10\text{ mol L}^{-1}\).
A high-input-resistance voltmeter reads \(+1.09\text{ V}\) for both cells, within its resolution of \(0.01\text{ V}\).
The same \(10.0\,\Omega\) resistor is then connected to each cell. Cell A gives a terminal voltage of \(0.88\text{ V}\), while Cell B gives \(0.76\text{ V}\).
A student argues that Cell B’s open-circuit reading must be lower because both solutions are more dilute. Another argues that the identical open-circuit readings prove dilution has no effect on either cell.
Evaluate both claims. Calculate the effective internal resistance of each cell using the simple internal-resistance model, and explain how the open-circuit readings can be the same while the loaded readings differ.
Solution 5
The first student’s claim is incorrect, and the second student’s conclusion is too broad. The open-circuit potentials can be the same because the concentration effects cancel in the ideal model, while the diluted cell can have a higher effective internal resistance and a lower terminal voltage under load.
Step 1: Compare the concentration ratios.
For Cell A,
\[ Q_A=\frac{1.0}{1.0}=1 \]
For Cell B,
\[ Q_B=\frac{0.10}{0.10}=1 \]
Both cells have the same ratio of product-ion concentration to reactant-ion concentration. In the ideal model, the concentration effects on the two half-cell potentials cancel when the cell potential is calculated as their difference.
Diluting both solutions does not necessarily lower the open-circuit cell potential. The first student has treated the individual half-cell changes as though they must add together rather than cancel.
The second student has identified a possible outcome but drawn the wrong conclusion. Equal cell potentials do not mean that dilution has no effect on the cell’s other properties.
Step 2: Calculate the current through the resistor in Cell A.
Using Ohm’s law, \(I=V/R\), where \(I\) is current, \(V\) is the voltage across the resistor, and \(R\) is its resistance,
\[ I_A=\frac{0.88\text{ V}}{10.0\,\Omega} =0.088\text{ A} \]
Step 3: Estimate Cell A’s effective internal resistance.
Using \(V=E-Ir_{\text{int}}\), rearrange to obtain
\[ r_{\text{int}}=\frac{E-V}{I} \]
Taking the open-circuit reading of \(1.09\text{ V}\) as the emf,
\[ \begin{aligned} r_A &=\frac{1.09-0.88}{0.088}\\ &\approx 2.4\,\Omega \end{aligned} \]
Step 4: Calculate the current and effective internal resistance of Cell B.
\[ I_B=\frac{0.76\text{ V}}{10.0\,\Omega} =0.076\text{ A} \]
Then,
\[ \begin{aligned} r_B &=\frac{1.09-0.76}{0.076}\\ &\approx 4.3\,\Omega \end{aligned} \]
Cell B has a higher effective internal resistance than Cell A: approximately \(4.3\,\Omega\), compared with \(2.4\,\Omega\).
Step 5: Explain the difference between open-circuit and loaded voltage.
The lower ion concentrations in Cell B reduce the conductivity of its solutions, which can increase the resistance to ionic current. Electrode polarisation and other internal effects can also contribute.
With the resistor connected, current flows and a larger internal voltage drop occurs in Cell B. Its terminal voltage therefore falls further, even though its open-circuit potential is the same within the stated measurement resolution.
The calculated resistances are effective values: the simple model groups the internal voltage losses together and does not prove that solution resistance is the only cause.
This is the key distinction to retain when interpreting a real galvanic cell: the standard cell potential is a reference under standard conditions, the open-circuit potential reflects the cell’s actual chemical conditions, and the loaded terminal voltage also reflects losses while current flows. To calculate the size of a concentration-driven potential change, the next quantitative concept is the Nernst equation.