
HSC Chemistry: Elemental and Gravimetric Analysis Practice Exam
Test your understanding of elemental and gravimetric analysis with this original 50-mark tutorgum Chemistry practice exam. Covers flame tests, atomic absorption and emission spectroscopy, and gravimetric calculations, with complete worked solutions and a marking guide.
This original tutorgum practice paper assesses the specified Chemistry 11-12 Syllabus (2025) scope for elemental and gravimetric analysis. It covers flame tests, atomic absorption spectroscopy (AAS), atomic emission spectroscopy (AES), and gravimetric analysis. It is a focused topic assessment, not a full-course mock exam or an official or NESA-endorsed paper.
01Exam instructions
Suggested working time: 60 minutes
Reading time: 5 minutes
Total marks: 50
Permitted equipment:
- Scientific calculator
- Periodic table
- Pen and pencil
Instructions:
- Answer all questions.
- Show all working for calculations, including equations, substitutions, and units.
- Give numerical answers to three significant figures unless the supplied data indicates otherwise.
- Use the information and assumptions provided in each question.
- Write chemical equations with appropriate formulae, charges, and state symbols where required.
Assessed content:
| Topic | Assessed knowledge and skills |
|---|---|
| Flame tests | Characteristic colours of selected aqueous metal cations and their use as qualitative evidence |
| Atomic absorption spectroscopy | Principles, measurement of metal ions in aqueous solutions, calibration, and concentration calculations |
| Atomic emission spectroscopy | Characteristic emission wavelengths, intensity measurements, calibration, and limitations |
| Gravimetric analysis | Precipitation, stoichiometric calculations, analyte concentration, and evaluation of experimental accuracy |
This paper does not assess other instrumental analysis techniques, titrations, or unrelated Chemistry modules.
All numerical data, calibration relationships, and experimental conditions needed to answer the questions are provided.
02Questions
Question 1 (7 marks)
A student is given five aqueous solutions containing different metal cations. The student performs flame tests using a clean wire loop and records the following observations.

| Solution | Observed flame colour |
|---|---|
| A | Intense yellow |
| B | Lilac |
| C | Brick-red |
| D | Blue-green |
| E | Crimson red |
The possible cations are \(\mathrm{Na^+}\), \(\mathrm{K^+}\), \(\mathrm{Ca^{2+}}\), \(\mathrm{Cu^{2+}}\), and \(\mathrm{Li^+}\).
(a) Identify the metal cation present in each solution, A-E. (5 marks)
(b) Explain why different metal cations produce characteristic flame colours. Explain why flame tests are considered qualitative rather than quantitative analytical techniques. (2 marks)
Question 2 (10 marks)
A water-quality laboratory uses atomic absorption spectroscopy (AAS) to determine the concentration of copper ions in an aqueous sample.
The sample is introduced into a flame atomiser, where it is converted into free gaseous atoms. Light of a suitable wavelength is passed through the atomised sample, and the instrument measures the absorbance.
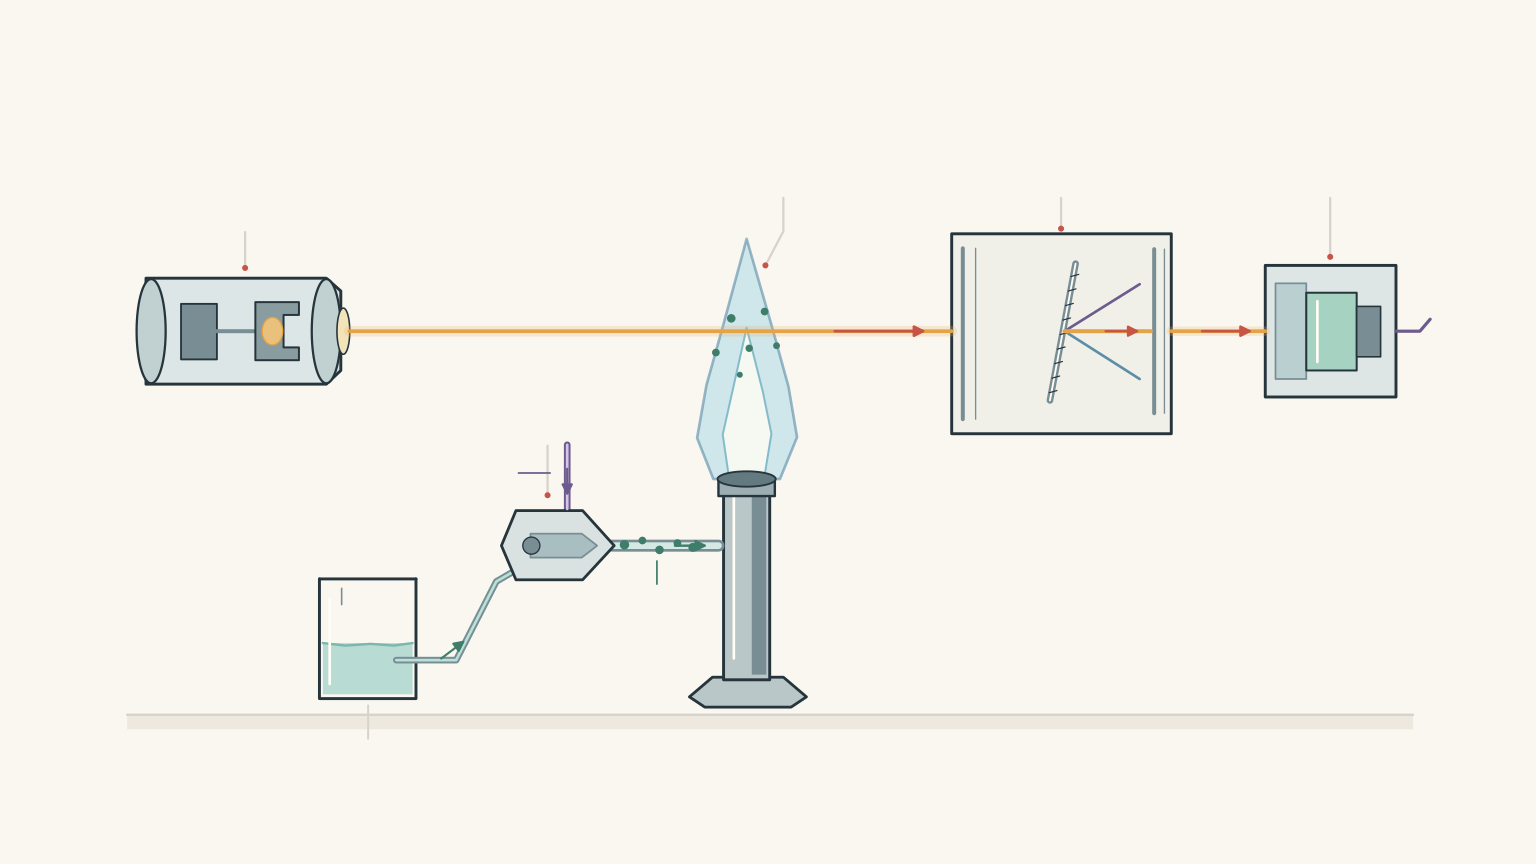
The laboratory prepares copper standards and obtains the following calibration data.
| Copper concentration (mg L\(^{-1}\)) | Absorbance |
|---|---|
| 0.0 | 0.00 |
| 2.0 | 0.12 |
| 4.0 | 0.24 |
| 6.0 | 0.36 |
| 8.0 | 0.48 |
| 10.0 | 0.60 |
An unknown water sample is prepared by transferring \(5.00\ \mathrm{mL}\) of the original sample into a \(100.0\ \mathrm{mL}\) volumetric flask and making it up to the calibration mark with distilled water.
The diluted sample produces an absorbance of 0.30.
Assume that:
- The calibration relationship is linear over the supplied concentration range.
- The absorbance readings have been corrected using a blank.
- There are no significant matrix interferences.
(a) Explain how AAS can be used to measure the concentration of metal ions in an aqueous solution. Include the role of light absorption by gaseous atoms. (3 marks)
(b) Use the calibration data to determine the copper concentration in the diluted sample. (2 marks)
(c) Calculate the copper concentration in the original water sample. (2 marks)
(d) Calculate the mass of copper present in \(250.0\ \mathrm{mL}\) of the original water sample. (2 marks)
(e) Explain why the calibration standards and unknown sample must be analysed under the same instrumental conditions. (1 mark)
Question 3 (8 marks)
A laboratory uses flame atomic emission spectroscopy, a form of atomic emission spectroscopy (AES), to investigate metal cations in an aqueous sample.
The instrument introduces the sample into a flame. Light emitted by excited atoms is separated according to wavelength and detected.
The following reference emission wavelengths are available:
| Element | Characteristic emission wavelength (nm) |
|---|---|
| Sodium | 589.0 |
| Potassium | 766.5 |
| Calcium | 422.7 |
| Copper | 324.8 |
The unknown sample produces distinct emission peaks at \(589.0\ \mathrm{nm}\) and \(766.5\ \mathrm{nm}\).

(a) Identify the two metal elements indicated by the emission spectrum. (2 marks)
(b) Explain how atomic emission produces characteristic wavelengths of light. (2 marks)
The laboratory also prepares sodium standards and measures their emission intensity at \(589.0\ \mathrm{nm}\).
| Sodium concentration (mg L\(^{-1}\)) | Emission intensity (arbitrary units) |
|---|---|
| 0.0 | 0 |
| 1.0 | 12 |
| 2.0 | 24 |
| 3.0 | 36 |
| 4.0 | 48 |
The unknown sample produces an emission intensity of 30 arbitrary units at this wavelength.
(c) Determine the sodium concentration in the unknown sample using the calibration data. (2 marks)
(d) State one assumption required when using emission intensity to determine concentration, and explain one limitation of flame atomic emission spectroscopy when analysing a mixture of metal ions. (2 marks)
Question 4 (14 marks)
A fertiliser manufacturer wants to determine the percentage by mass of sulfate ions in a solid fertiliser sample.
A student carries out a gravimetric analysis using barium chloride solution to precipitate sulfate ions as barium sulfate.
The following procedure is performed:
- A \(1.250\ \mathrm{g}\) fertiliser sample is dissolved in distilled water.
- The solution is transferred into a \(250.0\ \mathrm{mL}\) volumetric flask and made up to the calibration mark.
- A \(25.00\ \mathrm{mL}\) aliquot is transferred into a beaker.
- An excess of barium chloride solution is added.
- The resulting precipitate is collected using filter paper, washed, and dried.
- The filter paper and precipitate are weighed.
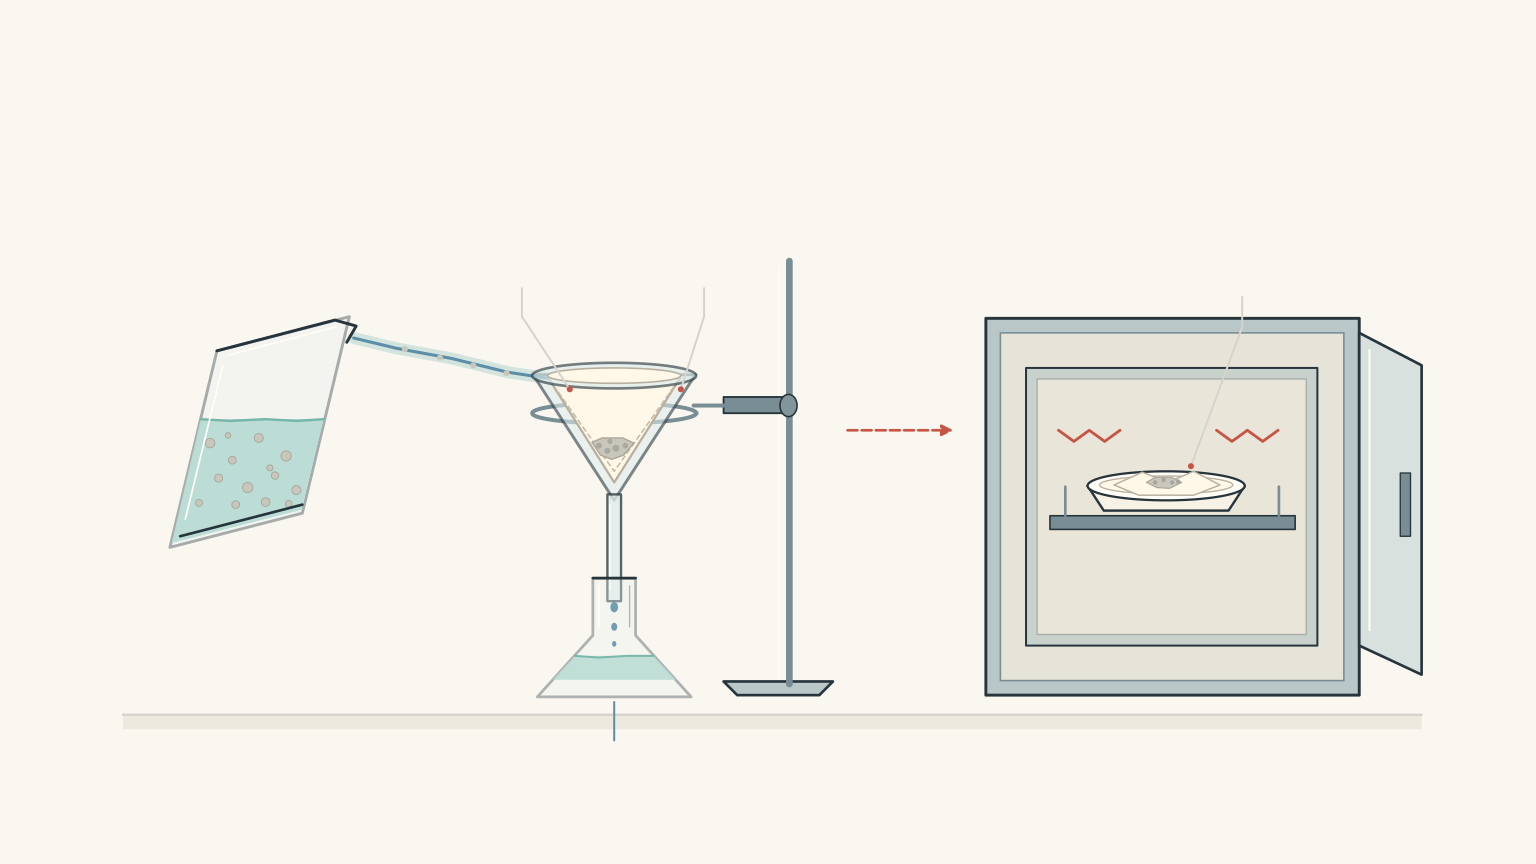
The following measurements are recorded:
| Measurement | Mass |
|---|---|
| Empty, dry filter paper | 0.8426 g |
| Filter paper and dry precipitate | 1.0310 g |
The precipitate is assumed to be pure barium sulfate, \(\mathrm{BaSO_4}\), and precipitation is assumed to be complete.
Use the following molar masses:
- \(M(\mathrm{BaSO_4}) = 233.39\ \mathrm{g\,mol^{-1}}\)
- \(M(\mathrm{SO_4^{2-}}) = 96.06\ \mathrm{g\,mol^{-1}}\)
(a) Write the balanced net ionic equation for the precipitation reaction, including state symbols. (2 marks)
(b) Calculate the mass of barium sulfate precipitate collected. (1 mark)
(c) Calculate the amount, in moles, of sulfate ions present in the \(25.00\ \mathrm{mL}\) aliquot. (2 marks)
(d) Determine the percentage by mass of sulfate ions in the original fertiliser sample. Show all working, including how you account for the full \(250.0\ \mathrm{mL}\) solution. (4 marks)
(e) Explain why excess barium chloride is added and why the precipitate must be washed and dried to constant mass. (3 marks)
(f) A student does not dry the precipitate completely before weighing it. Explain how this error affects the calculated percentage of sulfate ions in the fertiliser. (2 marks)
Question 5 (11 marks)
A laboratory is investigating lead contamination in a waterway.
An initial analysis indicates that the water contains lead ions at a concentration of \(0.20\ \mathrm{mg\,L^{-1}}\).
A laboratory technician considers using gravimetric analysis by precipitating the lead ions as lead sulfate, \(\mathrm{PbSO_4}\).
Assume:
- The water sample has a volume of \(100.0\ \mathrm{mL}\).
- Lead ions react with sulfate ions in a \(1:1\) mole ratio.
- All lead ions would precipitate if the gravimetric reaction were carried out.
- No other precipitates form.
Use the following molar masses:
- \(M(\mathrm{Pb}) = 207.2\ \mathrm{g\,mol^{-1}}\)
- \(M(\mathrm{PbSO_4}) = 303.26\ \mathrm{g\,mol^{-1}}\)
(a) Calculate the mass of lead present in the \(100.0\ \mathrm{mL}\) water sample. (2 marks)
(b) Calculate the theoretical mass of lead sulfate that would form if all the lead ions precipitated. (3 marks)
(c) Assess the suitability of gravimetric analysis for determining the lead concentration in this sample. Refer to your calculated precipitate mass and the practical requirements of gravimetric analysis. (2 marks)
(d) Recommend a more suitable analytical technique for determining the lead concentration in this sample. Explain why it is preferable to a visual flame test for this purpose. (2 marks)
(e) State one assumption involved in using an instrumental calibration to determine the lead concentration and describe one way a laboratory could check or control this assumption. (2 marks)
03Worked solutions and marking guide
Solution 1
(a) Identification of metal cations (5 marks)
| Solution | Flame colour | Metal cation |
|---|---|---|
| A | Intense yellow | \(\mathrm{Na^+}\) |
| B | Lilac | \(\mathrm{K^+}\) |
| C | Brick-red | \(\mathrm{Ca^{2+}}\) |
| D | Blue-green | \(\mathrm{Cu^{2+}}\) |
| E | Crimson red | \(\mathrm{Li^+}\) |
Award 1 mark for each correct identification.
(b) Explanation of flame colours (2 marks)
When a metal atom absorbs energy from the flame, some of its electrons move from lower to higher energy levels. This is called excitation.
The excited electrons are unstable. When they return to lower energy levels, they release energy as photons of light.
The energy of each photon determines its wavelength:
\[ \Delta E = hf \]
where:
- \(\Delta E\) is the energy difference between electron energy levels, in joules,
- \(h\) is Planck’s constant,
- \(f\) is the frequency of the emitted light, in hertz.
Different elements have different arrangements of electron energy levels. They therefore produce characteristic emission wavelengths, which can combine to produce a characteristic flame colour.
Flame tests are qualitative because they indicate the possible presence of an ion but do not provide a reliable numerical concentration. Visual colour intensity depends on several factors, including the amount of sample introduced, flame conditions, and contamination. A mixture may also contain ions whose colours mask weaker observations.
Marking guide:
- 1 mark for explaining electron excitation and the release of photons as electrons return to lower energy levels.
- 1 mark for linking characteristic wavelengths to element identification and distinguishing qualitative identification from quantitative measurement.
Solution 2
(a) Principle of atomic absorption spectroscopy (3 marks)
AAS measures the concentration of a metal by measuring how much light is absorbed by its free gaseous atoms.
The aqueous sample is first converted into a fine aerosol and introduced into a flame atomiser. This produces free gaseous atoms from the dissolved metal species.
Light at a characteristic wavelength for the metal being analysed passes through the atomised sample. Ground-state atoms absorb some of this light, causing the intensity reaching the detector to decrease.
The instrument measures this absorption. Within a suitable calibration range, absorbance increases with the concentration of the metal.
Marking guide:
- 1 mark for explaining atomisation of the aqueous sample into free gaseous atoms.
- 1 mark for explaining absorption of characteristic-wavelength light by the atoms.
- 1 mark for relating measured absorbance to metal concentration.

(b) Concentration of the diluted sample (2 marks)
From the calibration table:
- An absorbance of 0.24 corresponds to \(4.0\ \mathrm{mg\,L^{-1}}\).
- An absorbance of 0.36 corresponds to \(6.0\ \mathrm{mg\,L^{-1}}\).
The unknown has an absorbance of 0.30, exactly halfway between these values.
Therefore:
\[ [\mathrm{Cu^{2+}}]_{\text{diluted}} = 5.0\ \mathrm{mg\,L^{-1}} \]
Marking guide:
- 1 mark for correctly interpreting the calibration relationship.
- 1 mark for the correct concentration, including units.
(c) Concentration of the original sample (2 marks)
The dilution factor is:
\[ \text{Dilution factor} =\frac{100.0}{5.00}=20.0 \]
Therefore:
\[ \begin{aligned} C_{\text{original}} &=C_{\text{diluted}}\times 20.0\\ &=5.0\times20.0\\ &=100\ \mathrm{mg\,L^{-1}} \end{aligned} \]
The original sample contains \(100\ \mathrm{mg\,L^{-1}}\) of copper.
Marking guide:
- 1 mark for calculating the correct dilution factor.
- 1 mark for applying the factor correctly and giving the concentration with units.
(d) Mass of copper in the original sample (2 marks)
Convert the sample volume into litres:
\[ 250.0\ \mathrm{mL}=0.2500\ \mathrm{L} \]
Use:
\[ m=CV \]
where \(m\) is the mass in milligrams, \(C\) is the concentration in \(\mathrm{mg\,L^{-1}}\), and \(V\) is the volume in litres.
\[ \begin{aligned} m&=100\times0.2500\\ &=25.0\ \mathrm{mg} \end{aligned} \]
The mass of copper is \(25.0\ \mathrm{mg}\).
Marking guide:
- 1 mark for converting volume and applying the concentration-volume relationship.
- 1 mark for the correct mass and units.
(e) Importance of consistent instrumental conditions (1 mark)
Calibration standards and unknown samples must be measured under the same instrumental conditions so that their absorbance readings can be compared reliably.
Changes in flame temperature, wavelength selection, or instrument settings could change the measured absorbance independently of concentration.
Award 1 mark for linking consistent conditions to valid comparison with the calibration data.
Solution 3
(a) Identification of elements (2 marks)
The observed peaks correspond to:
- \(589.0\ \mathrm{nm}\): sodium.
- \(766.5\ \mathrm{nm}\): potassium.
Therefore, the sample contains sodium and potassium.
Award 1 mark for each correct identification.
(b) Formation of atomic emission wavelengths (2 marks)
In atomic emission spectroscopy, energy from the flame excites electrons in gaseous atoms to higher energy levels.
When these electrons return to lower energy levels, they release energy as photons. The energy released corresponds to the difference between the two energy levels.
Because each element has characteristic energy-level differences, it produces characteristic emission wavelengths.
Marking guide:
- 1 mark for explaining excitation of electrons.
- 1 mark for explaining photon emission during the return to lower energy levels and relating this to characteristic wavelengths.
(c) Sodium concentration (2 marks)
The calibration data show a linear relationship between sodium concentration and emission intensity.
From the table:
\[ 12\text{ units}\longleftrightarrow 1.0\ \mathrm{mg\,L^{-1}} \]
The unknown has an intensity of 30 units.
\[ \begin{aligned} [\mathrm{Na^+}] &=\frac{30}{12}\\ &=2.5\ \mathrm{mg\,L^{-1}} \end{aligned} \]
The sodium concentration is \(2.5\ \mathrm{mg\,L^{-1}}\).
Marking guide:
- 1 mark for correctly using the calibration relationship.
- 1 mark for the correct concentration and units.
(d) Assumptions and limitations (2 marks)
One important assumption is that emission intensity is proportional to concentration over the calibration range, provided that the flame and instrumental conditions remain consistent.
A limitation is that other substances in a mixed sample can interfere with the measurement. For example, overlapping emission lines may make it difficult to distinguish signals from different elements. Changes in the sample matrix can also affect atomisation and excitation, changing the emission intensity.
A calibration curve helps account for the relationship between concentration and measured intensity, but it does not automatically eliminate interference.
Marking guide:
- 1 mark for a valid assumption, such as linearity within the calibration range and consistent excitation conditions.
- 1 mark for a valid limitation, such as spectral overlap or matrix interference, with an appropriate explanation.
Solution 4
(a) Net ionic precipitation equation (2 marks)
Barium ions react with sulfate ions to produce insoluble barium sulfate.
\[ \ce{Ba^2+(aq) + SO4^2-(aq) -> BaSO4(s)} \]
The equation is balanced for both atoms and charge.
Marking guide:
- 1 mark for the correct reactant ions and product formula.
- 1 mark for correct balancing, charges, and state symbols.
(b) Mass of barium sulfate (1 mark)
Subtract the mass of the empty filter paper from the combined mass.
\[ \begin{aligned} m(\mathrm{BaSO_4}) &=1.0310-0.8426\\ &=0.1884\ \mathrm{g} \end{aligned} \]
The precipitate has a mass of \(0.1884\ \mathrm{g}\).
Marking guide:
- 1 mark for the correct subtraction and result.
(c) Amount of sulfate ions in the aliquot (2 marks)
First, calculate the amount of barium sulfate.
\[ n=\frac{m}{M} \]
Substitute the supplied values:
\[ \begin{aligned} n(\mathrm{BaSO_4}) &=\frac{0.1884}{233.39}\\ &=8.07\times10^{-4}\ \mathrm{mol} \end{aligned} \]
The balanced equation shows a \(1:1\) mole ratio between barium sulfate and sulfate ions.
Therefore:
\[ n(\mathrm{SO_4^{2-}}) =8.07\times10^{-4}\ \mathrm{mol} \]
Marking guide:
- 1 mark for correctly calculating the amount of barium sulfate.
- 1 mark for applying the \(1:1\) mole ratio to obtain the amount of sulfate ions.
(d) Percentage by mass of sulfate ions (4 marks)
The precipitate was obtained from a \(25.00\ \mathrm{mL}\) aliquot of the original \(250.0\ \mathrm{mL}\) solution.
The dilution or aliquot factor is:
\[ \text{Aliquot factor} =\frac{250.0}{25.00}=10.00 \]
Therefore, the total amount of sulfate ions in the original solution is:
\[ \begin{aligned} n_{\text{total}}(\mathrm{SO_4^{2-}}) &=8.07\times10^{-4}\times10.00\\ &=8.07\times10^{-3}\ \mathrm{mol} \end{aligned} \]
Now calculate the total mass of sulfate ions:
\[ m=nM \]
\[ \begin{aligned} m(\mathrm{SO_4^{2-}}) &=8.07\times10^{-3}\times96.06\\ &=0.775\ \mathrm{g} \end{aligned} \]
The original fertiliser sample had a mass of \(1.250\ \mathrm{g}\).
Calculate the percentage by mass:
\[ \begin{aligned} \%\mathrm{SO_4^{2-}} &=\frac{0.775}{1.250}\times100\\ &=62.0\% \end{aligned} \]
The fertiliser contains \(62.0\%\) sulfate ions by mass.
Marking guide:
- 1 mark for calculating the aliquot factor and scaling to the full solution.
- 1 mark for calculating the total mass of sulfate ions.
- 1 mark for correctly applying the percentage-by-mass formula.
- 1 mark for the correct final answer with units or percentage notation and appropriate precision.
(e) Purpose of excess reagent, washing, and drying (3 marks)
Excess barium chloride is added to encourage complete precipitation of the sulfate ions. If insufficient barium ions are present, some sulfate ions may remain dissolved, causing the measured precipitate mass to be too low.
The precipitate is washed to remove soluble impurities, including excess barium chloride and other dissolved ions. These impurities would otherwise increase the measured mass.
The precipitate is dried to constant mass to ensure that water has been removed. Constant mass means that further drying and weighing produces no significant change in the recorded mass.
This ensures that the measured mass represents the dry precipitate rather than a combination of precipitate and retained water.
Marking guide:
- 1 mark for explaining why excess reagent helps achieve complete precipitation.
- 1 mark for explaining why washing removes soluble impurities.
- 1 mark for explaining why drying to constant mass produces a reliable precipitate mass.
(f) Effect of incomplete drying (2 marks)
If the precipitate is not completely dry, some water remains with the solid.
This increases the measured mass above the true mass of dry barium sulfate.
The student then calculates too many moles of barium sulfate and, consequently, too many moles and too much mass of sulfate ions.
The calculated percentage by mass of sulfate ions will therefore be too high.
Marking guide:
- 1 mark for identifying that retained water increases the measured precipitate mass.
- 1 mark for explaining that the calculated sulfate percentage is consequently too high.
Solution 5
(a) Mass of lead in the sample (2 marks)
First, convert the water volume into litres:
\[ 100.0\ \mathrm{mL}=0.1000\ \mathrm{L} \]
The lead concentration is:
\[ C=0.20\ \mathrm{mg\,L^{-1}} \]
Use:
\[ m=CV \]
\[ \begin{aligned} m(\mathrm{Pb}) &=0.20\times0.1000\\ &=0.020\ \mathrm{mg} \end{aligned} \]
Convert milligrams into grams:
\[ 0.020\ \mathrm{mg} =2.0\times10^{-5}\ \mathrm{g} \]
The sample contains \(0.020\ \mathrm{mg}\) of lead.
Marking guide:
- 1 mark for correctly converting the volume and applying \(m=CV\).
- 1 mark for the correct lead mass and units.
(b) Theoretical mass of lead sulfate (3 marks)
First, calculate the amount of lead present.
\[ n=\frac{m}{M} \]
\[ \begin{aligned} n(\mathrm{Pb}) &=\frac{2.0\times10^{-5}}{207.2}\\ &=9.65\times10^{-8}\ \mathrm{mol} \end{aligned} \]
The mole ratio between lead ions and lead sulfate is \(1:1\).
Therefore:
\[ n(\mathrm{PbSO_4}) =9.65\times10^{-8}\ \mathrm{mol} \]
Calculate the mass of lead sulfate:
\[ m=nM \]
\[ \begin{aligned} m(\mathrm{PbSO_4}) &=9.65\times10^{-8}\times303.26\\ &=2.93\times10^{-5}\ \mathrm{g} \end{aligned} \]
Convert to milligrams:
\[ m(\mathrm{PbSO_4})=0.0293\ \mathrm{mg} \]
The theoretical mass of lead sulfate is \(2.93\times10^{-5}\ \mathrm{g}\).
Marking guide:
- 1 mark for calculating the amount of lead.
- 1 mark for applying the \(1:1\) mole ratio.
- 1 mark for calculating the theoretical precipitate mass with appropriate units.
(c) Suitability of gravimetric analysis (2 marks)
Gravimetric analysis would be unsuitable for this particular sample.
The theoretical precipitate mass is only \(0.0293\ \mathrm{mg}\). This is an extremely small amount of solid to collect, dry, and weigh accurately.
Small losses during filtration or transfer could cause a substantial error relative to the total precipitate mass. In addition, incomplete precipitation or some lead sulfate remaining dissolved would reduce the collected mass.
Gravimetric analysis is generally more appropriate when enough analyte is present to produce a measurable precipitate reliably.
Marking guide:
- 1 mark for using the very small calculated precipitate mass to evaluate suitability.
- 1 mark for explaining a relevant practical limitation, such as filtration losses, weighing precision, or incomplete precipitation.
(d) Recommended analytical technique (2 marks)
Atomic absorption spectroscopy (AAS) would be a suitable choice for determining the lead concentration.
AAS measures the absorption of characteristic-wavelength light by gaseous lead atoms produced from the aqueous sample. The absorbance can be compared with a calibration curve prepared using known lead concentrations.
This provides a quantitative measurement, even when the metal concentration is too low to produce a useful visible flame-test colour.
A visual flame test is primarily qualitative. It is not reliable for determining the numerical concentration of a trace metal in water.
Marking guide:
- 1 mark for recommending AAS.
- 1 mark for explaining its quantitative measurement and why it is preferable to visual flame testing.
(e) Calibration assumptions and quality control (2 marks)
One assumption is that the unknown sample behaves similarly to the calibration standards and that the calibration relationship remains valid over the concentration range being measured.
For example, other dissolved substances could affect atomisation or absorption, producing matrix interference.
A laboratory could use a matrix-matched calibration standard, analyse a reagent blank, or perform a spike-recovery test to check for interference.
A spike-recovery test involves adding a known amount of lead to a sample and checking whether the instrument measures the expected increase in concentration.
Marking guide:
- 1 mark for identifying a valid calibration assumption, such as linearity or the absence of significant matrix interference.
- 1 mark for describing an appropriate quality-control procedure, such as a blank, matrix-matched standard, or spike-recovery test.
End of practice paper
Total: 50 marks