
Infrared Spectroscopy Practice Exam: HSC Chemistry Revision
Test your understanding of infrared spectroscopy with this original 40-mark HSC Chemistry practice exam. Includes timed exam conditions, six original questions, and fully worked solutions with marking guides.
This is an original tutorgum practice paper for focused revision of infrared (IR) spectroscopy in HSC Chemistry. It tests your ability to interpret absorption bands, identify organic functional groups, recognise significant absences, and use spectral evidence to support a proposed structure.
The paper assesses infrared spectroscopy of organic compounds only. It is not a full-course Chemistry examination, and it is not an official, endorsed, past, or predicted NESA paper.
01Exam instructions
Assessment details
| Condition | Details |
|---|---|
| Suggested reading time | 5 minutes |
| Suggested working time | 50 minutes |
| Total marks | 40 |
| Questions | 6 |
| Permitted equipment | Pen, pencil, ruler, and non-programmable calculator |
| Reference material | The IR reference table supplied below |
Assessed content
- Identifying characteristic IR absorption bands in organic compounds.
- Using the presence and absence of absorption bands to identify functional groups.
- Distinguishing between plausible functional groups when their absorption ranges overlap.
- Using multiple spectral features to support the structure of a simple organic compound.
Not assessed: NMR spectroscopy, mass spectrometry, quantitative spectroscopy, detailed instrument construction, reaction mechanisms, or synthesis.
Important assumptions
- All absorption positions are approximate and are given in wavenumbers, measured in cm⁻¹.
- The spectra and peak lists show the significant absorptions relevant to each question. An explicitly stated absence means that no significant absorption was detected in that region.
- Relative intensities are described as weak, medium, or strong. Band shape is described as broad or sharp where relevant.
- Absorption ranges can overlap. A single absorption should not automatically be treated as proof of a particular functional group.
- Use the supplied reference table throughout the examination.
IR spectroscopy reference table
| Functional group | Characteristic absorption | Typical features |
|---|---|---|
| Alcohol | O-H: 3200-3600 cm⁻¹ | Broad, strong |
| Alcohol | C-O: 1000-1300 cm⁻¹ | Usually strong |
| Carboxylic acid | O-H: 2500-3300 cm⁻¹ | Very broad |
| Carboxylic acid | C=O: 1700-1725 cm⁻¹ | Strong |
| Amine | N-H: 3300-3500 cm⁻¹ | Medium; primary amines often show two bands, secondary amines one |
| Aldehyde | C=O: 1720-1740 cm⁻¹ | Strong |
| Aldehyde | C-H: 2700-2830 cm⁻¹ | Weak absorptions, sometimes difficult to detect |
| Ketone | C=O: 1705-1725 cm⁻¹ | Strong |
| Ester | C=O: 1735-1750 cm⁻¹ | Strong |
| Ester | C-O: 1050-1300 cm⁻¹ | Usually strong |
| Alkene | C=C: 1620-1680 cm⁻¹ | Medium |
| Alkene | =C-H: 3000-3100 cm⁻¹ | Medium |
| Alkane | C-H: 2850-2960 cm⁻¹ | Medium |
Remember that the shape and combination of absorption bands matter. For example, an O-H absorption in an alcohol is generally broad, while an N-H absorption in an amine is generally narrower.
For a transmittance spectrum, absorption bands appear as downward troughs. A deeper trough indicates greater absorption.
02Questions
Question 1 (6 marks)
An organic compound is analysed using infrared spectroscopy. Three separate samples produce the following significant absorption features.
(a) Sample A produces:
- A broad, strong absorption at 3350 cm⁻¹.
- A strong absorption at 1100 cm⁻¹.
- A medium absorption at 2950 cm⁻¹.
- No significant absorption in the carbonyl region.
Identify the most likely functional group present in Sample A. Use two features of the spectrum to support your answer. (2 marks)
(b) Sample B produces:
- A strong absorption at 1715 cm⁻¹.
- A very broad absorption extending from approximately 2500 to 3300 cm⁻¹.
Identify the most likely functional group present in Sample B. Explain how the two absorptions support your identification. (2 marks)
(c) Sample C produces:
- A medium absorption at 1645 cm⁻¹.
- A medium absorption at 3070 cm⁻¹.
- No strong absorption in the carbonyl region.
Identify the most likely functional group present in Sample C. Explain the significance of both absorption bands. (2 marks)
Question 2 (7 marks)
An unknown organic compound, Sample A, produces the following infrared transmittance spectrum.
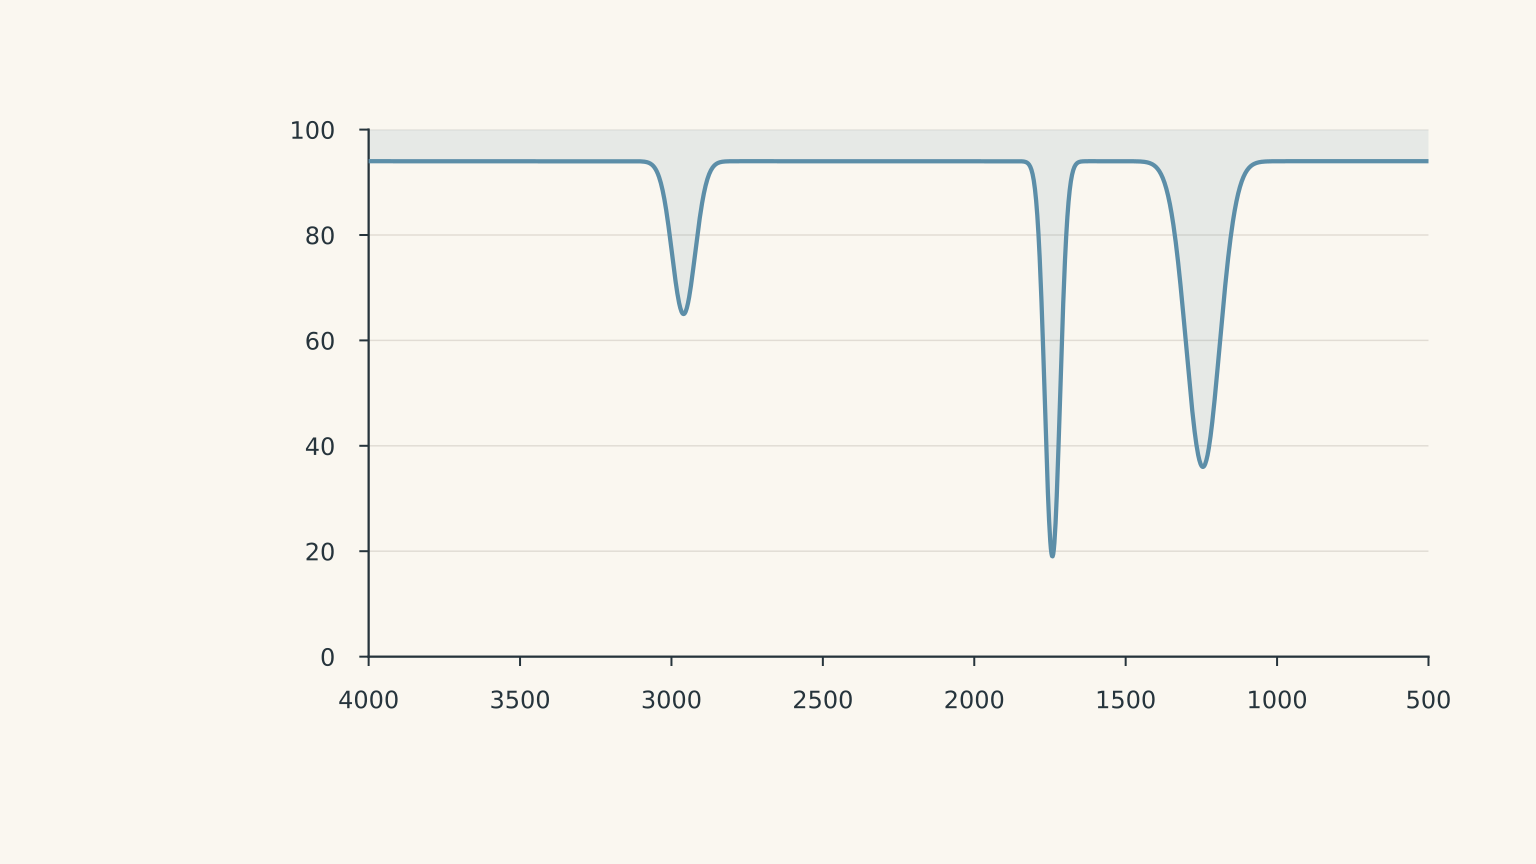
The significant absorptions are summarised below:
| Wavenumber (cm⁻¹) | Intensity and shape |
|---|---|
| 1742 | Strong, sharp |
| 1245 | Strong |
| 2960 | Medium |
No significant broad absorption is detected between 2500 and 3600 cm⁻¹.
(a) What does the absorption at 1742 cm⁻¹ suggest about the bonds present in Sample A? Explain why this absorption alone is insufficient to identify the functional group conclusively. (2 marks)
(b) Identify the most likely functional group present in Sample A. Use the absorption at 1245 cm⁻¹ and the absence of broad O-H absorption to support your answer. (3 marks)
(c) A student claims that the absorption at 2960 cm⁻¹ proves that Sample A is an alkane.
Evaluate this claim. (2 marks)
Question 3 (6 marks)
Two unknown organic compounds, Samples B and C, are analysed using infrared spectroscopy.
Their significant absorption features are shown below.
| Spectral feature | Sample B | Sample C |
|---|---|---|
| 3200-3600 cm⁻¹ | Broad, strong absorption | No broad absorption |
| 3390 cm⁻¹ | – | One narrow, medium absorption |
| 1050 cm⁻¹ | Strong absorption | No prominent absorption |
| 2950 cm⁻¹ | Medium absorption | Not significant |
| 1650-1750 cm⁻¹ | No strong absorption | No strong absorption |
(a) Identify the most likely functional group present in Sample B. Explain how two of its absorption features support your identification. (3 marks)
(b) Identify the most likely functional group present in Sample C. What does the number of N-H absorption bands suggest about the type of amine present? Explain your reasoning. (3 marks)
Question 4 (7 marks)
An unknown organic compound, Sample D, produces the following significant IR absorption features:
| Wavenumber (cm⁻¹) | Intensity |
|---|---|
| 1730 | Strong, sharp |
| 2720 | Weak |
| 2820 | Weak |
| 2960 | Medium |
No significant broad absorption is detected between 2500 and 3300 cm⁻¹.
(a) Identify the most likely carbonyl-containing functional group present in Sample D. Explain how the absorption at 1730 cm⁻¹ and the two weak absorptions support your identification. (3 marks)
(b) Explain why the absence of a very broad absorption between 2500 and 3300 cm⁻¹ makes a carboxylic acid less likely. (2 marks)
(c) Can the complete molecular structure of Sample D be determined from the information provided? Justify your answer. (2 marks)
Question 5 (6 marks)
An unknown compound, Sample E, is suspected to be one of the following three organic compounds:
- Butan-2-one
- Butanoic acid
- Butan-2-ol
Its IR spectrum contains the following significant features:
| Spectral feature | Observation |
|---|---|
| 1718 cm⁻¹ | Strong, sharp absorption |
| 2960 cm⁻¹ | Medium absorption |
| 2500-3300 cm⁻¹ | No very broad absorption |
| 3200-3600 cm⁻¹ | No broad O-H absorption |
| 1050-1300 cm⁻¹ | No significant strong absorption |
(a) Determine which of the three proposed compounds is most consistent with the spectrum. Explain your choice using the absorption at 1718 cm⁻¹. (2 marks)
(b) Explain how the absence of the characteristic absorptions helps eliminate the other two proposed compounds. (2 marks)
(c) Explain why the IR spectrum does not necessarily prove that Sample E is specifically butan-2-one, even if your selection in part (a) is correct. (2 marks)
Question 6 (8 marks)
An organic compound, Sample F, produces the following significant absorption features:
| Wavenumber (cm⁻¹) | Intensity |
|---|---|
| 1640 | Medium |
| 3070 | Medium |
| 2960 | Medium |
No strong, sharp absorption is detected in the 1700-1750 cm⁻¹ region.
No broad O-H or N-H absorption is detected in the relevant regions.
(a) Identify the most likely functional group present in Sample F. Explain how two of the absorption bands support your identification. (3 marks)
(b) Interpret the absorption at 2960 cm⁻¹. Explain what additional information it provides about the types of bonds in Sample F. (2 marks)
(c) A student concludes that Sample F must be but-1-ene because the spectrum contains absorptions at 1640 cm⁻¹ and 3070 cm⁻¹.
Explain why this conclusion is not justified by the available IR data. State two structural features that cannot be established from the information provided. (3 marks)
03Worked solutions and marking guide
Solution 1
(a) Most likely functional group: alcohol.
The broad, strong absorption at 3350 cm⁻¹ is consistent with an alcohol O-H bond. Alcohols typically produce broad absorptions between 3200 and 3600 cm⁻¹.
The strong absorption at 1100 cm⁻¹ is consistent with a C-O bond. The combination of these two features provides strong evidence for an alcohol.
The absence of a significant carbonyl absorption also supports this assignment.
Marking guide (2 marks):
- 1 mark: Identifies an alcohol.
- 1 mark: Correctly connects the broad O-H and strong C-O absorptions to the alcohol functional group.
(b) Most likely functional group: carboxylic acid.
The strong absorption at 1715 cm⁻¹ indicates a carbonyl (C=O) bond.
However, this absorption alone could be consistent with several carbonyl-containing functional groups.
The very broad absorption extending from 2500 to 3300 cm⁻¹ is characteristic of the O-H bond in a carboxylic acid.
The combination of a carbonyl absorption and a very broad acid O-H absorption strongly supports the presence of a carboxylic acid.
Marking guide (2 marks):
- 1 mark: Identifies a carboxylic acid.
- 1 mark: Explains that the combination of C=O and very broad O-H absorptions supports this identification.
(c) Most likely functional group: alkene.
The absorption at 1645 cm⁻¹ is consistent with a C=C bond in an alkene.
The absorption at 3070 cm⁻¹ is consistent with an alkene =C-H bond.
These two absorptions together support the presence of an alkene functional group. The absence of a strong carbonyl absorption provides additional supporting evidence.
Marking guide (2 marks):
- 1 mark: Identifies an alkene.
- 1 mark: Correctly assigns the 1645 cm⁻¹ and 3070 cm⁻¹ absorptions to C=C and =C-H bonds.
Solution 2
(a) The absorption at 1742 cm⁻¹ indicates a carbonyl (C=O) bond.
Carbonyl bonds generally produce strong absorptions in the region around 1700-1750 cm⁻¹.
The position of this absorption is consistent with an ester, but other carbonyl-containing functional groups have overlapping absorption ranges.
Therefore, the 1742 cm⁻¹ absorption alone cannot establish that the compound is an ester. Additional spectral evidence is needed.
Marking guide (2 marks):
- 1 mark: Identifies the absorption as evidence of a C=O bond.
- 1 mark: Explains that overlapping carbonyl absorption ranges prevent definitive identification from this band alone.
(b) Most likely functional group: ester.
The strong absorption at 1245 cm⁻¹ is consistent with a C-O bond in an ester.
The strong carbonyl absorption at 1742 cm⁻¹ provides additional evidence for an ester.
The absence of broad O-H absorption is also important. A carboxylic acid would typically produce a very broad O-H absorption between 2500 and 3300 cm⁻¹, while an alcohol would generally produce a broad absorption between 3200 and 3600 cm⁻¹.
Neither feature is present.
The combination of a strong carbonyl absorption, a strong C-O absorption, and the absence of broad O-H absorption makes an ester the most likely identification.
Marking guide (3 marks):
- 1 mark: Identifies an ester as the most likely functional group.
- 1 mark: Correctly identifies the 1245 cm⁻¹ absorption as evidence of a C-O bond.
- 1 mark: Uses the absence of broad O-H absorption to support the identification and distinguish it from an alcohol or carboxylic acid.
An annotated interpretation of the spectrum:
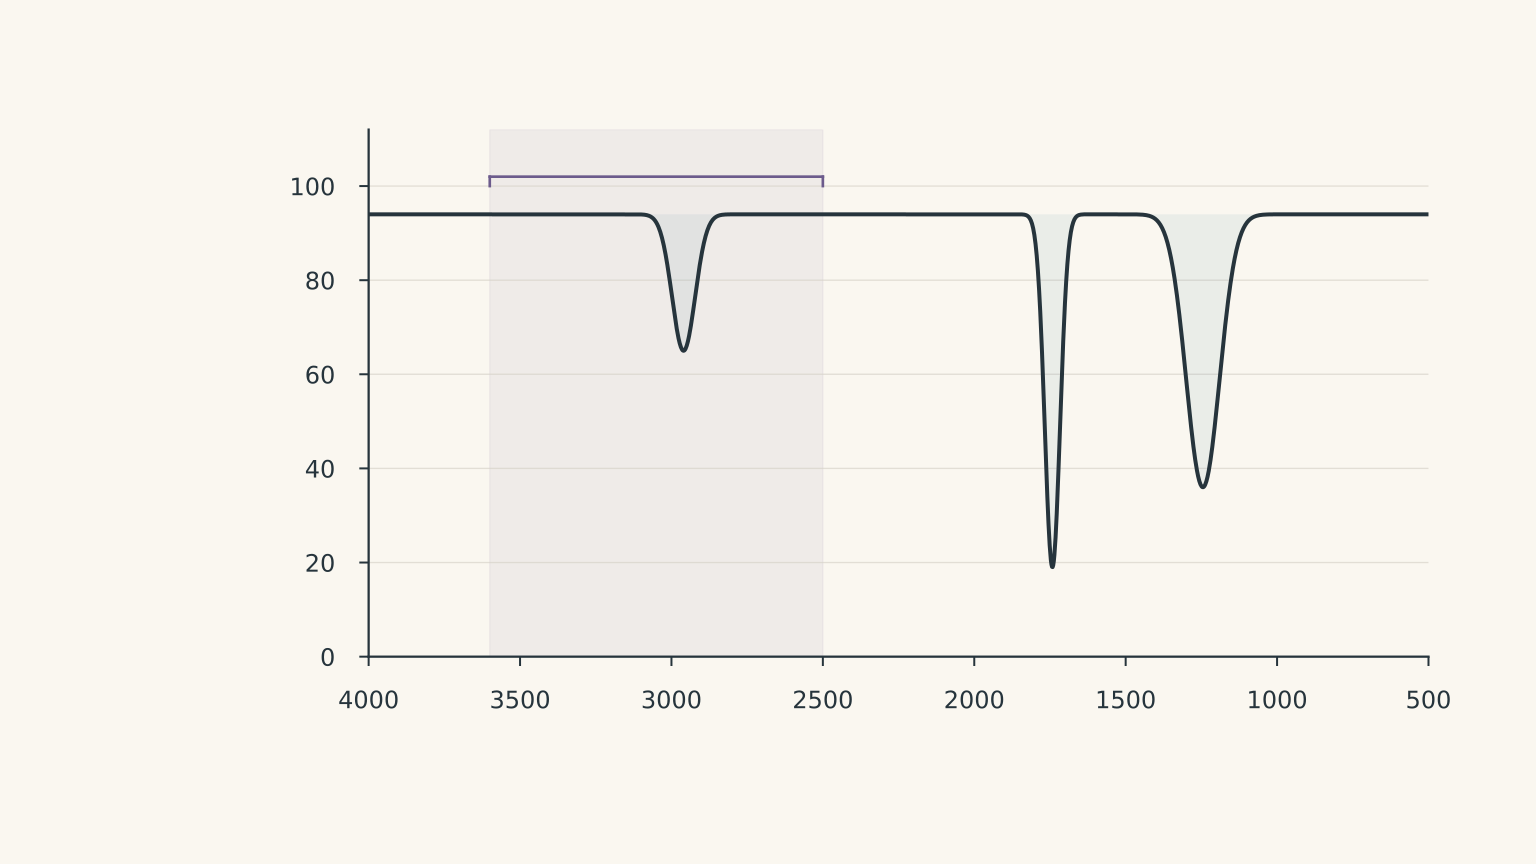
(c) The student’s claim is incorrect.
The absorption at 2960 cm⁻¹ indicates the presence of aliphatic C-H bonds.
However, these bonds are not exclusive to alkanes. They can also occur in the carbon chains attached to other functional groups, including esters.
Sample A has a strong carbonyl absorption at 1742 cm⁻¹, which provides evidence that it contains a functional group other than an alkane.
Therefore, the 2960 cm⁻¹ absorption does not prove that the compound is an alkane.
Marking guide (2 marks):
- 1 mark: Explains that the 2960 cm⁻¹ absorption indicates aliphatic C-H bonds, not an alkane exclusively.
- 1 mark: Explains that other functional groups can contain C-H bonds and refers to the carbonyl evidence.
Solution 3
(a) Most likely functional group in Sample B: alcohol.
Sample B has a broad, strong absorption between 3200 and 3600 cm⁻¹. This is characteristic of the O-H bond in an alcohol.
It also has a strong absorption at 1050 cm⁻¹, consistent with the C-O bond found in alcohols.
The combination of these features strongly supports the presence of an alcohol.
The absence of a strong carbonyl absorption also makes a carbonyl-containing functional group less likely.
Marking guide (3 marks):
- 1 mark: Identifies an alcohol.
- 1 mark: Identifies the broad 3200-3600 cm⁻¹ absorption as an O-H bond.
- 1 mark: Identifies the strong 1050 cm⁻¹ absorption as a C-O bond.
(b) Most likely functional group in Sample C: secondary amine.
Sample C has one narrow, medium absorption at 3390 cm⁻¹.
This falls within the typical N-H absorption range of 3300-3500 cm⁻¹.
The number of N-H absorption bands helps distinguish different types of amines:
- Primary amines typically produce two N-H stretching absorptions.
- Secondary amines typically produce one N-H stretching absorption.
- Tertiary amines do not contain an N-H bond and therefore do not produce an N-H stretching absorption.
Since Sample C has one narrow absorption in the N-H region, a secondary amine is the most likely identification.
Its narrow absorption also differs from the broad O-H absorption expected for an alcohol.
Marking guide (3 marks):
- 1 mark: Identifies an amine as the likely functional group.
- 1 mark: Identifies a secondary amine as most consistent with the single N-H absorption.
- 1 mark: Explains that the narrow absorption is consistent with N-H rather than the broad O-H absorption of an alcohol.
Solution 4
(a) Most likely functional group: aldehyde.
The strong absorption at 1730 cm⁻¹ indicates a carbonyl (C=O) bond.
This wavenumber falls within the typical aldehyde carbonyl absorption range of 1720-1740 cm⁻¹.
However, this absorption alone is not conclusive because other carbonyl-containing functional groups can absorb in nearby regions.
The two weak absorptions at 2720 and 2820 cm⁻¹ provide additional evidence. These are consistent with the characteristic aldehydic C-H absorptions.
The combination of a strong carbonyl absorption and weak aldehydic C-H absorptions makes an aldehyde the most likely identification.
Marking guide (3 marks):
- 1 mark: Identifies an aldehyde as the most likely functional group.
- 1 mark: Identifies the 1730 cm⁻¹ absorption as a C=O absorption in the aldehyde range.
- 1 mark: Correctly interprets the weak absorptions at 2720 and 2820 cm⁻¹ as evidence of aldehydic C-H bonds.
(b) The absence of a very broad absorption makes a carboxylic acid less likely.
Carboxylic acids typically produce a very broad O-H absorption between 2500 and 3300 cm⁻¹.
This feature is an important distinguishing characteristic of carboxylic acids.
Since Sample D does not show a significant broad absorption in this region, there is no supporting evidence for a carboxylic acid.
The strong carbonyl absorption alone is insufficient to identify the compound as a carboxylic acid.
Marking guide (2 marks):
- 1 mark: States that carboxylic acids produce a very broad O-H absorption between 2500 and 3300 cm⁻¹.
- 1 mark: Explains that its absence makes a carboxylic acid less likely.
(c) No, the complete molecular structure cannot be determined.
IR spectroscopy provides information about the bonds and functional groups present in a compound.
The spectrum provides evidence for an aldehyde, but it does not establish the complete carbon skeleton.
For example, different aldehydes can produce similar characteristic absorptions even though they have different numbers of carbon atoms or different arrangements of their carbon chains.
Therefore, the spectrum supports a functional-group identification, not a unique molecular structure.
Marking guide (2 marks):
- 1 mark: States that the complete molecular structure cannot be established from the supplied IR data.
- 1 mark: Explains that different compounds can contain the same functional group and produce similar absorption bands.
Solution 5
(a) Most likely compound: butan-2-one.
Butan-2-one is a ketone.
Ketones typically produce a strong C=O absorption between 1705 and 1725 cm⁻¹.
The strong absorption at 1718 cm⁻¹ falls directly within this range.
This makes butan-2-one the most consistent candidate.
The medium absorption at 2960 cm⁻¹ is also consistent with the presence of aliphatic C-H bonds in its carbon chain.
Marking guide (2 marks):
- 1 mark: Selects butan-2-one.
- 1 mark: Explains that 1718 cm⁻¹ is consistent with a ketone C=O bond.
(b) Eliminating the other compounds.
Butanoic acid:
A carboxylic acid should produce a very broad O-H absorption between 2500 and 3300 cm⁻¹.
This absorption is absent from Sample E. Therefore, butanoic acid is less likely.
Butan-2-ol:
An alcohol should produce a broad O-H absorption between 3200 and 3600 cm⁻¹.
This absorption is also absent.
Furthermore, butan-2-ol does not contain a carbonyl bond, so it would not be expected to produce the strong absorption at 1718 cm⁻¹.
These observations make both alternatives less consistent with the spectrum.
Marking guide (2 marks):
- 1 mark: Eliminates butanoic acid using the absence of its very broad O-H absorption.
- 1 mark: Eliminates butan-2-ol using the strong C=O absorption and absence of its characteristic O-H absorption.
(c) IR spectroscopy does not establish a unique molecular structure.
The spectrum supports the presence of a ketone, but it does not prove that the compound is specifically butan-2-one.
Other ketones can also produce strong C=O absorptions in a similar wavenumber range, together with aliphatic C-H absorptions.
The IR data therefore support a ketone functional group, but they do not uniquely establish the number of carbon atoms or the precise arrangement of the carbon chain.
Marking guide (2 marks):
- 1 mark: Recognises that other ketones could produce similar absorption features.
- 1 mark: Explains that IR spectroscopy alone does not establish the exact carbon skeleton or unique molecular structure.
Solution 6
(a) Most likely functional group: alkene.
The medium absorption at 1640 cm⁻¹ is consistent with a C=C bond in an alkene.
The medium absorption at 3070 cm⁻¹ is consistent with an alkene =C-H bond.
These two absorptions provide complementary evidence for an alkene.
The absence of a strong carbonyl absorption also makes a carbonyl-containing functional group less likely.
Marking guide (3 marks):
- 1 mark: Identifies an alkene.
- 1 mark: Identifies the 1640 cm⁻¹ absorption as evidence of a C=C bond.
- 1 mark: Identifies the 3070 cm⁻¹ absorption as evidence of an =C-H bond.
(b) The absorption at 2960 cm⁻¹ indicates aliphatic C-H bonds.
Alkanes typically produce C-H absorptions between 2850 and 2960 cm⁻¹.
The absorption at 2960 cm⁻¹ therefore suggests that Sample F contains aliphatic C-H bonds.
This is useful because it suggests that the molecule may contain a saturated carbon chain or alkyl groups alongside its alkene functional group.
Importantly, the presence of aliphatic C-H bonds does not mean that the entire molecule is an alkane.
Marking guide (2 marks):
- 1 mark: Identifies the 2960 cm⁻¹ absorption as evidence of aliphatic C-H bonds.
- 1 mark: Explains that these bonds can occur alongside an alkene in the same molecule.
(c) The student’s conclusion is not justified.
The absorptions at 1640 cm⁻¹ and 3070 cm⁻¹ provide evidence for an alkene.
However, these absorptions are characteristic of a functional group, not a unique molecular structure.
The spectrum does not provide enough information to establish the complete arrangement of the carbon atoms.
For example, it cannot establish:
- The exact position of the C=C bond along the carbon chain.
- The total number of carbon atoms or the precise branching of the carbon skeleton.
Different alkene isomers can produce similar characteristic IR absorptions.
Therefore, but-1-ene is one possible structure, but the supplied IR data do not establish that it is the correct one.
Marking guide (3 marks):
- 1 mark: Explains that the two absorptions support an alkene but do not identify a unique compound.
- 1 mark: Identifies the position of the C=C bond as information that cannot be established.
- 1 mark: Identifies the carbon-chain length, branching, or precise molecular structure as information that cannot be established.
04Final marking summary
| Question | Marks | Main skill assessed |
|---|---|---|
| Question 1 | 6 | Recognising characteristic functional-group absorptions |
| Question 2 | 7 | Interpreting a spectrum and evaluating supporting evidence |
| Question 3 | 6 | Distinguishing alcohols and amines |
| Question 4 | 7 | Identifying aldehydes using multiple absorption bands |
| Question 5 | 6 | Comparing plausible structures using significant absences |
| Question 6 | 8 | Interpreting combined spectral evidence and evaluating structural conclusions |
| Total | 40 |
Marking guidance
- Award marks for chemically correct explanations even when students use different wording from the solutions.
- Where a student makes a defensible initial identification, award follow-through marks for subsequent reasoning if the interpretation remains chemically consistent.
- Do not award the same spectral observation twice as separate evidence.
- A correct functional-group identification without the requested spectral justification should not receive full marks where explanation marks are allocated.
Key examination skill
The most important skill tested throughout this paper is interpreting combinations of absorption bands rather than memorising individual wavenumbers.
A strong IR spectroscopy response should generally do three things:
- Identify the relevant absorption and the bond it represents.
- Connect that bond to a plausible functional group.
- Use another absorption, or the absence of an expected absorption, to support or eliminate that identification.
Remember: IR spectroscopy is particularly useful for identifying functional groups. It does not automatically reveal the complete molecular structure.