
Force-Time Graphs: Impulse and Momentum Change in HSC Physics
Learn how to interpret the area under a force-time graph as impulse, connect it to momentum change, and avoid common sign and peak-force mistakes.
A force sensor records two collisions. Collision A reaches a much higher peak force than Collision B, but it lasts for less time. Which collision changes the object’s momentum more?
It is tempting to pick the taller graph. Bigger force means bigger effect, right? Not necessarily. On a force-time graph, the momentum change depends on both the force and how long it acts. The quantity that captures both is the area under the graph.
That area is called impulse.
01Why force alone is not enough
Imagine pushing a shopping trolley.
A hard shove for a tiny fraction of a second can get it moving. So can a gentler push that lasts much longer. If we want to know how much the trolley’s momentum changes, knowing only the largest force isn’t enough. We also need the duration of the push.
For a constant force, Newton’s second law can be written as
\[
F_{\text{net}}=\frac{\Delta p}{\Delta t}
\]
where:
- \(F_{\text{net}}\) is the net force in newtons (N)
- \(\Delta p\) is the change in momentum in kilogram metres per second (\(\text{kg m s}^{-1}\))
- \(\Delta t\) is the time interval in seconds (s)
Rearrange it:
\[
F_{\text{net}}\Delta t=\Delta p
\]
The product \(F\Delta t\) is the impulse, \(J\):
\[
J=F_{\text{net}}\Delta t=\Delta p
\]
So impulse tells us how much the object’s momentum changes.
Its unit is the newton second:
\[
\text{N s}
\]
Since \(1\text{ N}=1\text{ kg m s}^{-2}\),
\[
1\text{ N s}=1\text{ kg m s}^{-1}
\]
That is not a coincidence. Impulse and momentum have equivalent units because impulse is a change in momentum.
02Why the area under the graph gives impulse
Start with the easiest force-time graph: a constant force.
Suppose a force of \(40\text{ N}\) acts for \(0.20\text{ s}\).
On a force-time graph, this makes a rectangle:
- height = \(40\text{ N}\)
- width = \(0.20\text{ s}\)
The area is
\[
A=40\times0.20=8.0\text{ N s}
\]
But \(40\times0.20\) is also \(F\Delta t\), which is impulse.
So for a rectangular force-time graph,
\[
\boxed{\text{area under the graph}=J}
\]
Now suppose the force changes during the collision. We can imagine dividing the graph into many extremely thin vertical strips. Over one tiny time interval \(\Delta t\), the force is approximately constant, so that strip contributes approximately \(F\Delta t\) of impulse.
Add all those tiny contributions and you get the total area under the curve.
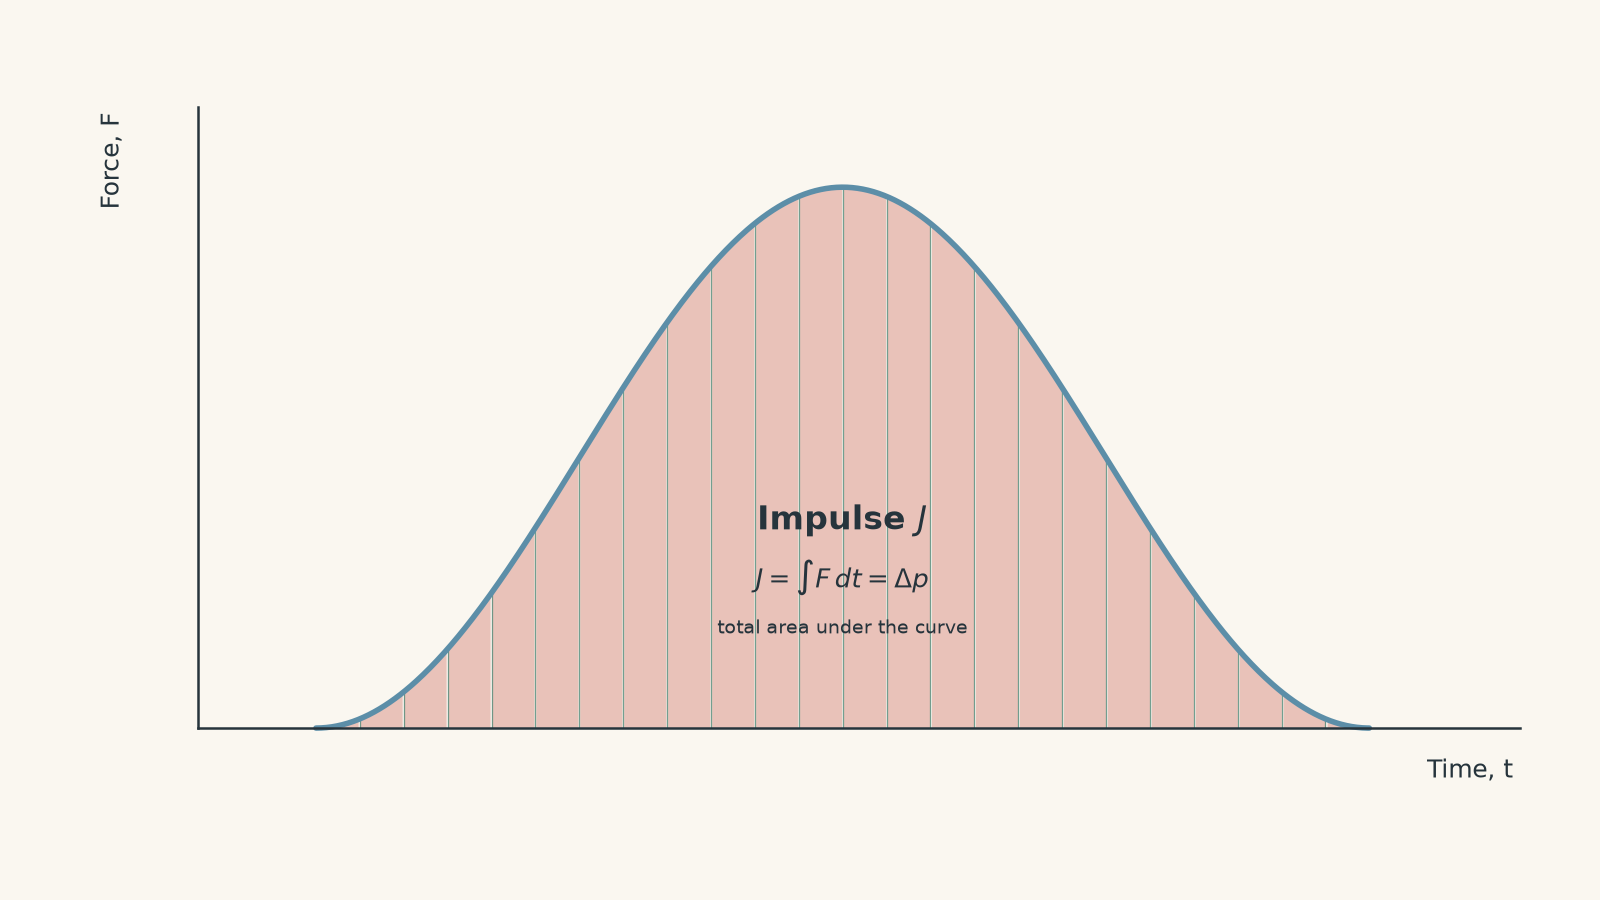
In exact mathematical form,
\[
J=\int_{t_1}^{t_2}F_{\text{net}}\,dt=\Delta p
\]
You do not usually need calculus to find the area of the simple straight-sided graphs used in HSC questions. Instead, split the graph into rectangles, triangles, and trapeziums.
03The decision rule you actually need
When you see a force-time graph, don’t immediately look for the peak force.
Ask:
What is the signed area between the graph and the time axis?
For a one-dimensional problem,
\[
\boxed{J=\text{signed area under the force-time graph}=\Delta p}
\]
That word signed matters.
If you define right as positive:
- area above the time axis gives positive impulse
- area below the time axis gives negative impulse
You must choose a positive direction and keep it consistent.
Worked example: Find the impulse from a triangular force pulse
A force on a cart rises uniformly from \(0\text{ N}\) to \(750\text{ N}\), then falls uniformly back to \(0\text{ N}\). The entire interaction lasts \(8.0\text{ ms}\). Find the impulse on the cart.
Step 1
The force-time graph is a triangle. Its area is
\[
A=\frac{1}{2}bh
\]
Here, the base is the time interval and the height is the maximum force.
Step 2
\[
8.0\text{ ms}=8.0\times10^{-3}\text{ s}
\]
Step 3
\[
\begin{aligned}
J&=\frac{1}{2}(8.0\times10^{-3})(750)\\
&=3.0\text{ N s}
\end{aligned}
\]
Step 4
The cart’s momentum changes by
\[
\boxed{3.0\text{ kg m s}^{-1}}
\]
in the positive direction of the force.
Notice that we did not multiply the maximum force by the full \(8.0\text{ ms}\). The force is only \(750\text{ N}\) at one instant. Treating it as \(750\text{ N}\) for the whole collision would double the impulse.
04Peak force and impulse are different ideas
Consider two force-time graphs.
Graph A has a very tall, narrow pulse. Graph B has a lower, wider pulse.
Which one has the larger impulse?
You cannot tell from the peak force alone. You need their areas.
This is one of the most common traps with force-time graphs:
A larger maximum force does not necessarily mean a larger change in momentum.
A force of \(1000\text{ N}\) acting briefly might have the same impulse as \(200\text{ N}\) acting for five times as long.
This also explains an important feature of cushioning. Suppose an object must undergo a particular momentum change, such as coming to rest. Its required impulse is fixed:
\[
J=\Delta p
\]
If the stopping time is increased, the same impulse can be delivered with a smaller average force.
For a changing force,
\[
J=F_{\text{avg}}\Delta t
\]
where \(F_{\text{avg}}\) is the average force during the interval.
You can picture \(F_{\text{avg}}\) as the height of a rectangle that has the same area as the real force-time graph.
The picture is useful, but don’t take it too far. The object does not actually experience the average force at every instant. The real force may rise, fall, or change direction.
05From impulse to final momentum
Finding the area is often only the first half of the problem.
Impulse tells you the change in momentum:
\[
J=\Delta p=p_f-p_i
\]
Therefore,
\[
p_f=p_i+J
\]
This is where signs become essential.
A positive impulse does not automatically mean the object ends up moving in the positive direction. It means its momentum has changed in the positive direction.
For example, an object moving rapidly to the left can receive a rightward impulse and still continue left, just more slowly.
Worked example: Can the impulse reverse the cart?
A \(1.5\text{ kg}\) cart initially moves to the left at \(4.0\text{ m s}^{-1}\). Take right as positive.
A rightward force acts on the cart as follows:
- from \(0\) to \(0.20\text{ s}\), the force rises uniformly from \(0\) to \(12\text{ N}\)
- from \(0.20\) to \(0.50\text{ s}\), the force remains at \(12\text{ N}\)
- from \(0.50\) to \(0.60\text{ s}\), the force falls uniformly from \(12\text{ N}\) to \(0\)
Find the impulse and determine the cart’s final velocity.
Step 1
\[
J_1=\frac{1}{2}(0.20)(12)=1.2\text{ N s}
\]
Step 2
Its duration is
\[
0.50-0.20=0.30\text{ s}
\]
so
\[
J_2=(12)(0.30)=3.6\text{ N s}
\]
Step 3
\[
J_3=\frac{1}{2}(0.10)(12)=0.60\text{ N s}
\]
The total impulse is
\[
\begin{aligned}
J&=J_1+J_2+J_3\\
&=1.2+3.6+0.60\\
&=5.4\text{ N s}
\end{aligned}
\]
So the momentum changes by \(+5.4\text{ kg m s}^{-1}\).
Step 4
Left is negative, so
\[
\begin{aligned}
p_i&=mv_i\\
&=(1.5)(-4.0)\\
&=-6.0\text{ kg m s}^{-1}
\end{aligned}
\]
Step 5
\[
\begin{aligned}
J&=p_f-p_i\\
5.4&=p_f-(-6.0)\\
p_f&=-0.60\text{ kg m s}^{-1}
\end{aligned}
\]
Step 6
\[
\begin{aligned}
v_f&=\frac{p_f}{m}\\
&=\frac{-0.60}{1.5}\\
&=-0.40\text{ m s}^{-1}
\end{aligned}
\]
Therefore,
\[
\boxed{v_f=-0.40\text{ m s}^{-1}}
\]
The positive impulse was not quite large enough to reverse the cart. It is still travelling left, but much more slowly.
That distinction is easy to miss: the sign of the impulse tells you the direction of the momentum change, not necessarily the direction of the final velocity.
06What if the graph goes below the time axis?
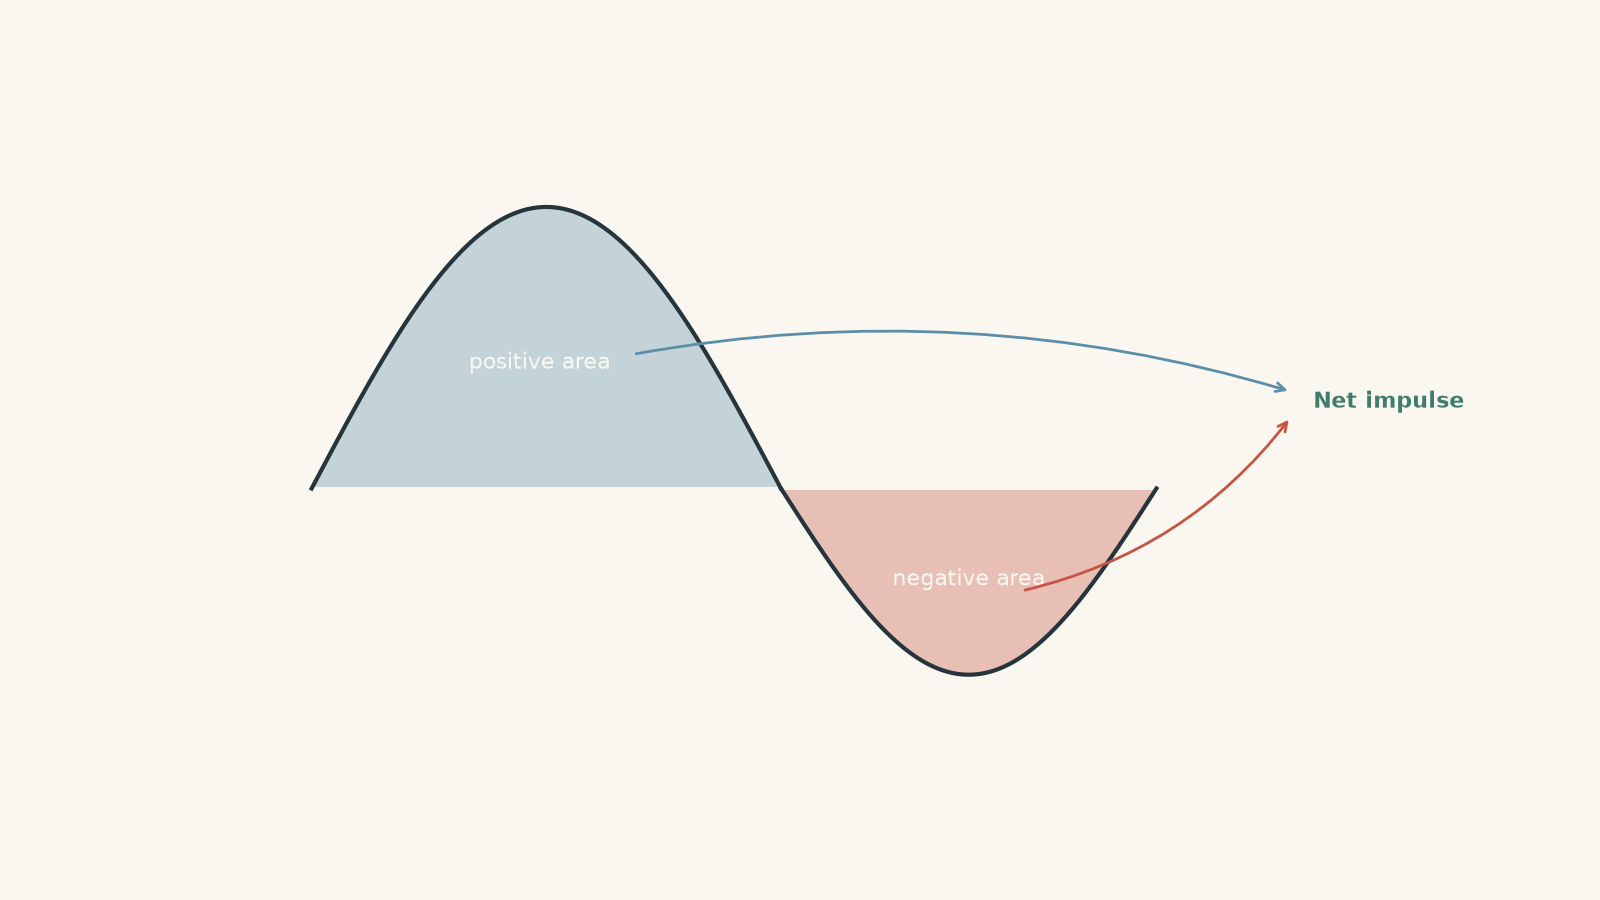
Suppose right is positive. A graph above the axis represents a rightward force, while a graph below it represents a leftward force.
If both occur during the same interval, calculate the positive and negative areas separately.
For example, suppose a graph has:
- \(+6.0\text{ N s}\) of area above the axis
- \(3.5\text{ N s}\) of area below the axis
The second area represents an impulse of \(-3.5\text{ N s}\).
Therefore,
\[
J_{\text{net}}=6.0-3.5=+2.5\text{ N s}
\]
The object’s momentum changes by \(+2.5\text{ kg m s}^{-1}\).
Do not add the magnitudes to get \(9.5\text{ N s}\). That would ignore direction.
07One precision that matters: which force is being graphed?
The exact relationship
\[
\Delta p=\int F_{\text{net}}\,dt
\]
uses the net force on the object.
Sometimes a question gives a graph of one particular interaction force, such as the force from a wall on a ball. The area then gives the impulse due to that force.
If other forces act during the same interval, they also contribute to the total impulse.
During a very short collision, forces such as weight may be tiny compared with the collision force, so their impulse may be negligible. But that is an assumption about the situation, not a new law of physics.
A strong answer notices what force the graph actually represents.
08A compact method for HSC force-time graphs
When you meet a force-time graph:
- Choose a positive direction.
- Check the time units. Convert milliseconds to seconds before calculating areas.
- Split the region into simple shapes such as rectangles, triangles, or trapeziums.
- Keep track of signs. Areas below the time axis are negative if the upward direction has been chosen as positive force.
- Add the signed areas to obtain impulse.
- Use
\[
J=\Delta p=p_f-p_i
\]
if momentum is required.
7. Use \(p=mv\) if the question asks for velocity.
8. Interpret the sign and check whether the result makes physical sense.
A useful final check is dimensional:
\[
\text{force}\times\text{time}=\text{N s}=\text{kg m s}^{-1}
\]
If your calculated “impulse” still has units of newtons, you have not found an area.
09Questions and solutions
Question 1
A constant force of \(80\text{ N}\) acts to the right on a cart for \(0.15\text{ s}\).
Find the impulse delivered to the cart and state the corresponding change in momentum.
Solution 1
The impulse is \(+12\text{ N s}\), so the cart’s momentum changes by \(+12\text{ kg m s}^{-1}\).
Taking right as positive,
\[
\begin{aligned}
J&=F\Delta t\\
&=(80)(0.15)\\
&=12\text{ N s}
\end{aligned}
\]
Since
\[
J=\Delta p
\]
the change in momentum is
\[
\boxed{\Delta p=+12\text{ kg m s}^{-1}}
\]
The positive sign means the momentum change is to the right.
Question 2
Two carts experience different force pulses for \(0.040\text{ s}\).
For Cart A, the force rises from zero to \(300\text{ N}\) and falls back to zero, forming a triangular force-time graph.
For Cart B, a constant force of \(160\text{ N}\) acts for the entire \(0.040\text{ s}\).
Which cart receives the larger impulse?
Solution 2
Cart B receives the larger impulse, even though Cart A experiences the larger peak force.
For Cart A, the graph is triangular:
\[
\begin{aligned}
J_A&=\frac{1}{2}(0.040)(300)\\
&=6.0\text{ N s}
\end{aligned}
\]
For Cart B, the graph is rectangular:
\[
\begin{aligned}
J_B&=(160)(0.040)\\
&=6.4\text{ N s}
\end{aligned}
\]
Therefore,
\[
\boxed{J_B>J_A}
\]
Cart B has the greater momentum change.
The tempting mistake is to compare \(300\text{ N}\) with \(160\text{ N}\) and stop there. Impulse depends on the whole area, not just the maximum height.
Question 3
Take right as positive. A \(2.0\text{ kg}\) object initially has momentum
\[
p_i=-3.0\text{ kg m s}^{-1}.
\]
It then experiences a constant force of \(+100\text{ N}\) for \(0.050\text{ s}\), followed immediately by a constant force of \(-40\text{ N}\) for \(0.10\text{ s}\).
Find its final momentum and velocity. Has its speed increased or decreased?
Solution 3
The final momentum is \(-2.0\text{ kg m s}^{-1}\), the final velocity is \(-1.0\text{ m s}^{-1}\), and the object’s speed has decreased.
The first impulse is
\[
\begin{aligned}
J_1&=(100)(0.050)\\
&=+5.0\text{ N s}
\end{aligned}
\]
The second force is negative, so
\[
\begin{aligned}
J_2&=(-40)(0.10)\\
&=-4.0\text{ N s}
\end{aligned}
\]
The net impulse is
\[
\begin{aligned}
J&=J_1+J_2\\
&=5.0-4.0\\
&=+1.0\text{ N s}
\end{aligned}
\]
Now use
\[
J=p_f-p_i
\]
so
\[
\begin{aligned}
1.0&=p_f-(-3.0)\\
p_f&=-2.0\text{ kg m s}^{-1}
\end{aligned}
\]
The final velocity is
\[
\begin{aligned}
v_f&=\frac{p_f}{m}\\
&=\frac{-2.0}{2.0}\\
&=-1.0\text{ m s}^{-1}
\end{aligned}
\]
Therefore,
\[
\boxed{v_f=-1.0\text{ m s}^{-1}}
\]
The object is still moving left. Its initial speed was
\[
\frac{3.0}{2.0}=1.5\text{ m s}^{-1},
\]
so its speed has decreased from \(1.5\text{ m s}^{-1}\) to \(1.0\text{ m s}^{-1}\).
A positive impulse does not necessarily produce a positive final momentum. Here it made the negative momentum less negative.
Question 4
Two carts have different masses but experience identical net force-time graphs.
Cart X has a mass of \(1.0\text{ kg}\), while Cart Y has a mass of \(2.5\text{ kg}\).
A student claims:
“Because the force-time graphs are identical, both carts must have the same change in velocity.”
Is the claim correct? Explain.
Solution 4
No. The carts have the same change in momentum, but they do not have the same change in velocity.
Identical force-time graphs have identical signed areas, so they produce the same impulse:
\[
J_X=J_Y
\]
Since
\[
J=\Delta p,
\]
the two carts have equal momentum changes:
\[
\Delta p_X=\Delta p_Y
\]
But momentum is
\[
p=mv.
\]
If the mass remains constant,
\[
\Delta p=m\Delta v
\]
and therefore
\[
\Delta v=\frac{\Delta p}{m}.
\]
Cart Y has the larger mass, so the same momentum change produces a smaller change in velocity.
The student’s mistake is treating “same change in momentum” and “same change in velocity” as equivalent. They are only equivalent when the masses are also the same.
Question 5
An object starts at rest. During the next \(0.40\text{ s}\), the signed area above the time axis on its net force-time graph is exactly equal in magnitude to the signed area below the axis.
A student says:
“The total impulse is zero, so the object must have remained at rest for the whole \(0.40\text{ s}\).”
Evaluate the student’s reasoning.
Solution 5
The conclusion is incorrect. Zero net impulse means the object’s final momentum equals its initial momentum, not that its momentum stayed constant throughout the interval.
The positive and negative areas cancel, so
\[
J_{\text{net}}=0.
\]
Since
\[
J_{\text{net}}=p_f-p_i,
\]
and the object starts at rest,
\[
\begin{aligned}
0&=p_f-0\\
p_f&=0.
\end{aligned}
\]
So the object is again at rest at the end of the \(0.40\text{ s}\).
However, the positive part of the force-time graph gives the object momentum during an earlier part of the motion. The later negative impulse can then remove that momentum.
For example, the object could accelerate to the right and later slow back to rest.
Its final momentum is zero, but it may have moved a significant distance while its momentum was non-zero.
This exposes an important limit of total impulse: knowing the net area over an entire interval tells you the overall momentum change. It does not tell you what the object was doing at every instant inside that interval.
10What this lets you understand next
Once you can read impulse from a force-time graph, collision questions become much easier to organise. The area tells you \(\Delta p\), momentum tells you how the velocity changes, and the width of the graph helps explain why increasing stopping time can reduce the force needed for the same momentum change.
The next useful step is to connect this with conservation of momentum. During a collision, each object experiences an impulse from the other. Tracking those impulses explains why their individual momenta change while the total momentum of an isolated system remains constant.