
Wavelength in HSC Physics: How to Measure It Correctly
Learn how to identify corresponding points, measure wavelength from wave diagrams, and avoid common mistakes with phase, spacing, and time graphs.
A wave graph has a crest at \(x=1.2\text{ m}\) and a trough at \(x=2.0\text{ m}\). Is the wavelength \(0.8\text{ m}\)?
It’s tempting to say yes. Those are obvious points on the wave, and they are \(0.8\text{ m}\) apart. But a crest and the next trough are at different stages of the repeating pattern. Their separation is only half a wavelength.
So before measuring wavelength, the important question is not just “How far apart are these points?” It is “Are these corresponding points?”
01What wavelength is actually measuring
Imagine taking a photograph of a repeating wave at one instant. Start at one crest and move along the wave. Eventually, the entire pattern begins to repeat.
The distance you travel before reaching the same point in the pattern again is the wavelength, written \(\lambda\), where \(\lambda\) is the Greek letter lambda.
For a periodic wave:
\[
\lambda = \text{shortest distance over which the wave pattern repeats in space}
\]
The key word is space. Wavelength tells you how spread out the wave is along a distance axis. Its SI unit is the metre, \(\text{m}\).
You can picture this like patterned wallpaper. Measuring from the left edge of one flower to the left edge of the next identical flower gives the spatial repeat of the pattern. Measuring from the flower to the leaf halfway through the pattern does not.
The wallpaper analogy has a limit. A real wave involves oscillating particles or fields, while wallpaper just sits there. But for identifying the repeating spatial pattern, the idea is useful.
02Corresponding points are at the same stage of the wave
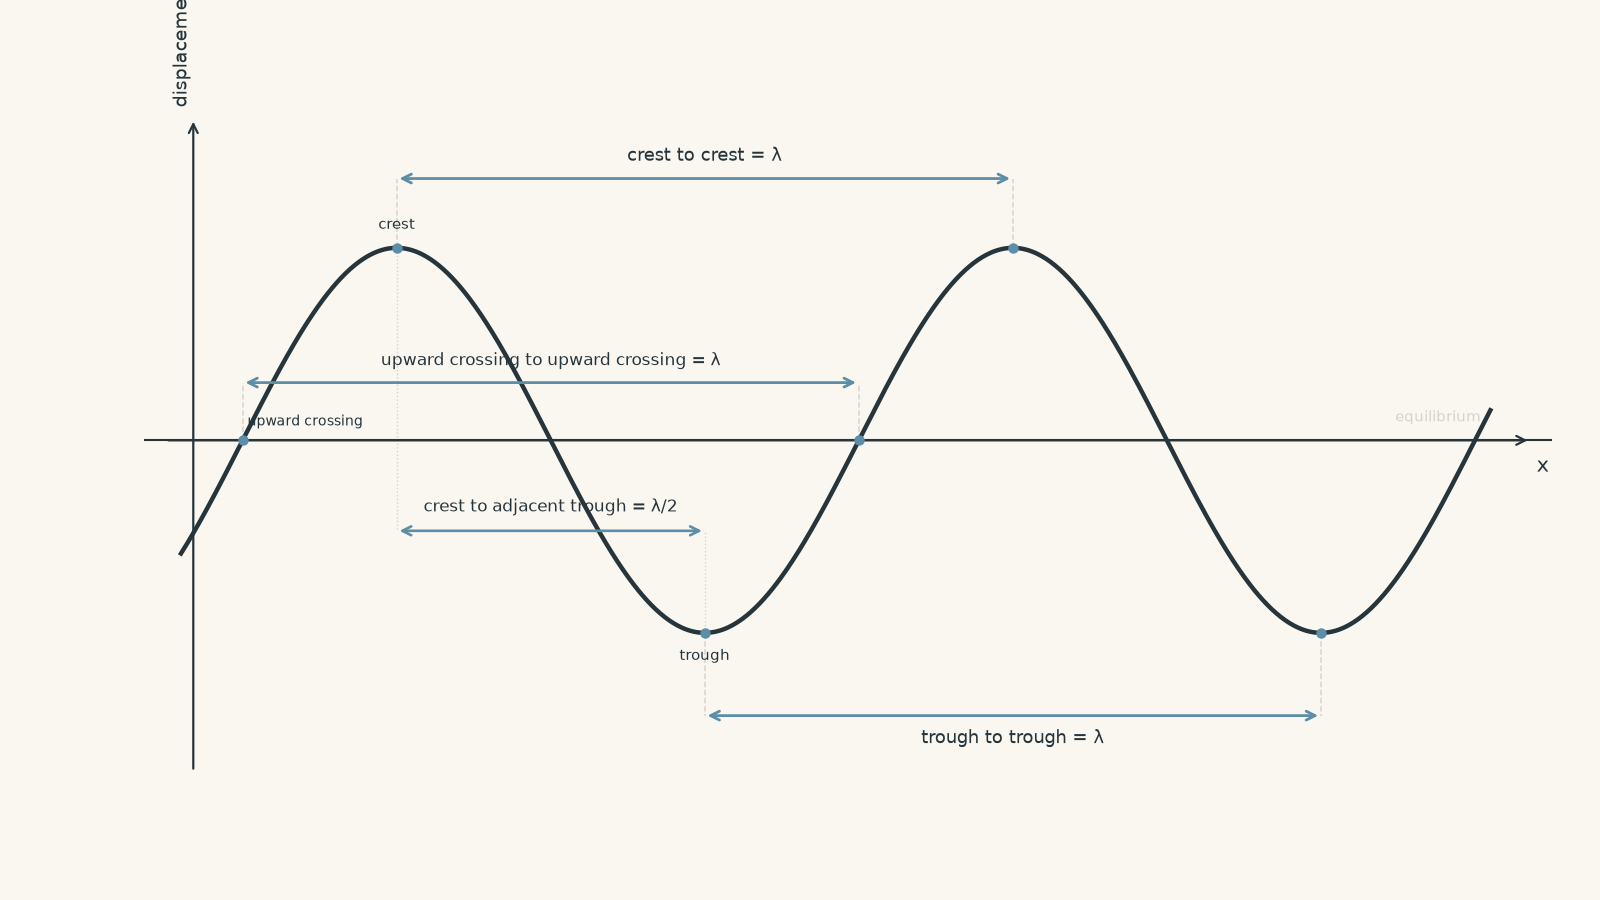
Two points are corresponding when they occupy the same position within successive repetitions of the wave.
Easy examples are:
- one crest and the next crest
- one trough and the next trough
- the centre of one compression and the centre of the next compression
- one upward equilibrium crossing and the next upward equilibrium crossing
Each pair is separated by one wavelength.
There is a more precise way to say this. Corresponding points are in phase. They are at the same stage of the oscillation.
That precision matters because having the same displacement does not automatically mean two points correspond.
Consider a sinusoidal wave crossing its equilibrium position. In each wavelength, it crosses equilibrium twice. Once the curve is rising and once it is falling.
If you measure from an upward equilibrium crossing to the next downward equilibrium crossing, have you measured one wavelength?
No. You have only moved halfway through the cycle:
\[
\text{upward crossing} \rightarrow \text{crest} \rightarrow \text{downward crossing}
\]
That distance is
\[
\frac{\lambda}{2}
\]
To get one full wavelength, continue until the wave reaches the next upward crossing.
A reliable decision rule
When choosing two points for a wavelength measurement, ask:
If I copied the small piece of wave around the first point and slid it horizontally to the second point, would it line up with the same part of the pattern?
If yes, they are corresponding points.
For a standard sinusoidal wave graph, this usually means matching both:
- the same displacement, and
- the same direction or slope of the curve.
So an upward equilibrium crossing corresponds to another upward equilibrium crossing, not to a downward one.
03Some useful fractions of a wavelength
Recognising parts of a wave can save you from guessing.
For a sinusoidal wave:
| Points being compared | Separation |
|---|---|
| Crest to next crest | \(\lambda\) |
| Trough to next trough | \(\lambda\) |
| Upward equilibrium crossing to next upward crossing | \(\lambda\) |
| Crest to adjacent trough | \(\frac{\lambda}{2}\) |
| Upward equilibrium crossing to next downward crossing | \(\frac{\lambda}{2}\) |
| Equilibrium crossing to nearest crest or trough | \(\frac{\lambda}{4}\) |
These fractions come from dividing one complete cycle into four equal stages:
\[
\text{equilibrium} \rightarrow \text{crest} \rightarrow \text{equilibrium} \rightarrow \text{trough} \rightarrow \text{equilibrium}
\]
Each step covers one quarter of a wavelength.
Worked example: Crest to trough
A snapshot of a sinusoidal wave shows a crest at \(x=1.2\text{ m}\) and the adjacent trough at \(x=2.0\text{ m}\). Determine the wavelength.
Step 1
\[
\Delta x = 2.0 – 1.2 = 0.8\text{ m}
\]
Step 2
A crest and its adjacent trough are half a cycle apart, so:
\[
0.8\text{ m} = \frac{\lambda}{2}
\]
Step 3
\[
\lambda = 2(0.8\text{ m}) = 1.6\text{ m}
\]
The wavelength is therefore \(1.6\text{ m}\).
The important part is not the arithmetic. The measured \(0.8\text{ m}\) was a real distance on the graph, but it was not yet a full spatial period.
04Measuring several wavelengths is often more accurate
Suppose a graph is small, thickly drawn, or read from experimental data. Estimating the centre of one crest might be slightly uncertain.
Instead of measuring one crest-to-crest interval, you can measure across several complete wavelengths and divide.
If two corresponding points are separated by \(n\) complete wavelengths, then
\[
\lambda = \frac{\Delta x}{n}
\]
where:
- \(\lambda\) is the wavelength in metres,
- \(\Delta x\) is the total distance between the chosen corresponding points in metres,
- \(n\) is the number of complete wavelength intervals between them.
Be careful when counting. Five crests do not contain five crest-to-crest intervals.
Try picturing five fence posts. How many gaps are between them?
Four.
The same logic applies to five consecutive crests. The first crest to the fifth crest spans four wavelengths.
Worked example: Measuring across several cycles
Five consecutive troughs occur at positions \(0.35\text{ m}\), \(1.15\text{ m}\), \(1.95\text{ m}\), \(2.75\text{ m}\), and \(3.55\text{ m}\). Determine the wavelength using the widest useful measurement.
Step 1
These are corresponding points, and using the widest separation reduces the effect of small reading errors.
The total distance is
\[
\Delta x = 3.55 – 0.35 = 3.20\text{ m}
\]
Step 2
From the first trough to the fifth trough there are four complete intervals:
\[
n=4
\]
Step 3
\[
\lambda = \frac{\Delta x}{n}
= \frac{3.20\text{ m}}{4}
= 0.800\text{ m}
\]
The wavelength is \(0.800\text{ m}\).
The trap here is counting five troughs and dividing by five. Wavelength is measured across the gaps between corresponding points, not by counting the points themselves.
05Wavelength is not always crest-to-crest
Crests are convenient for transverse wave drawings, but they are not part of the definition of wavelength.
A longitudinal wave, such as a sound wave travelling through air, does not have physical crests and troughs in the same sense. Instead, the air alternates between regions of greater and lower pressure or particle density.
One wavelength can be measured from:
- one compression centre to the next compression centre, or
- one rarefaction centre to the next rarefaction centre.
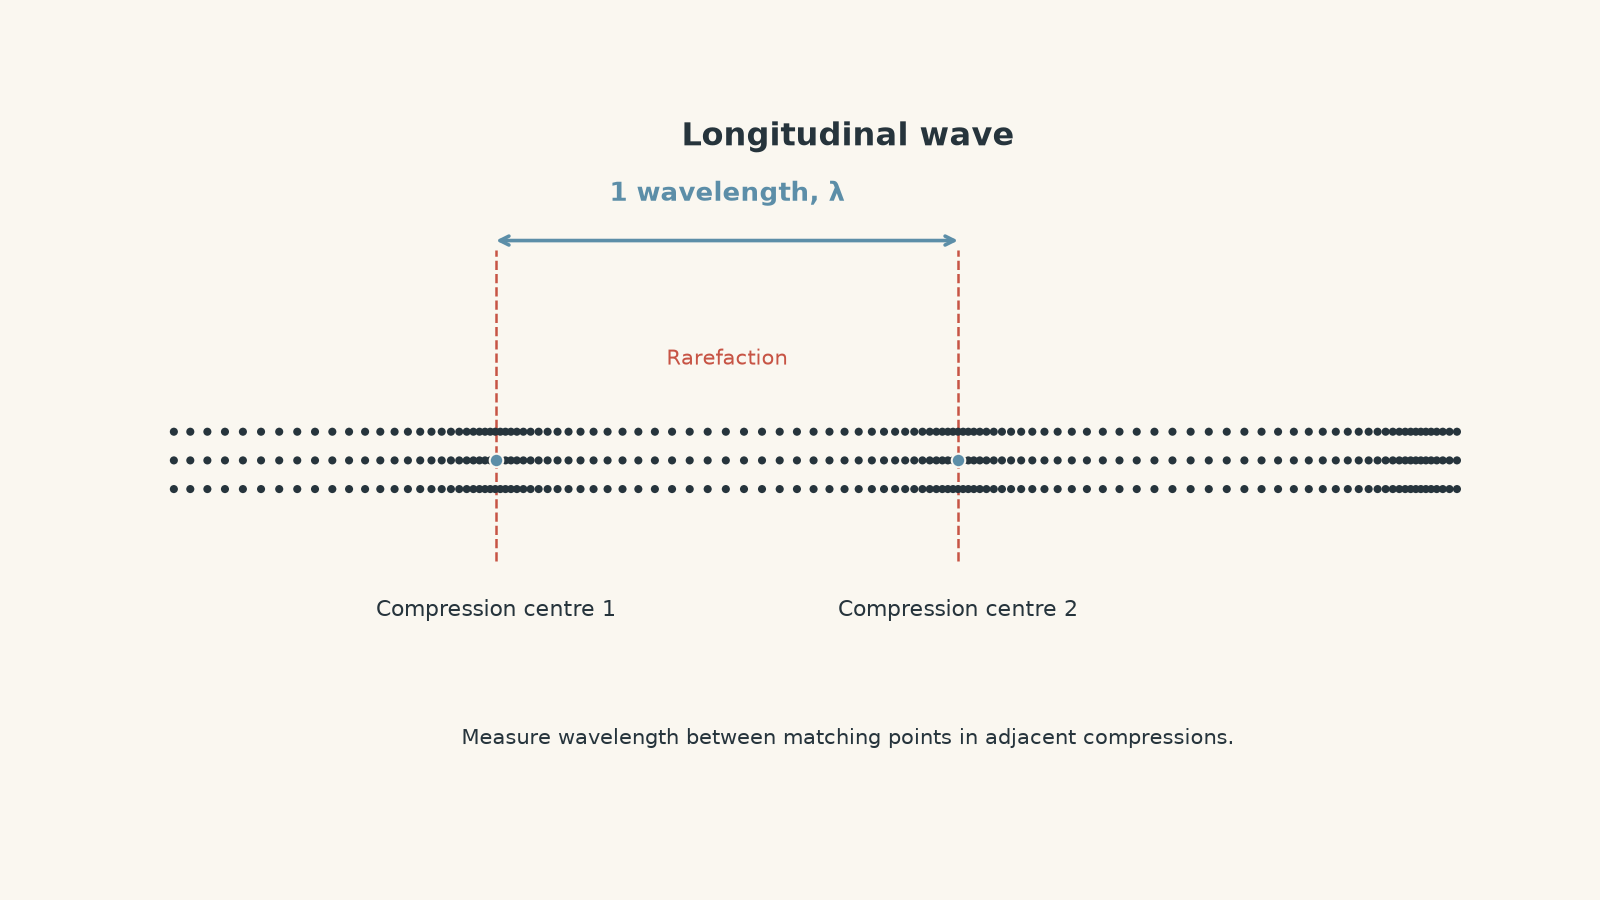
Again, the rule is the same: find where the spatial pattern repeats.
06Do not confuse a wave snapshot with a time graph
This is one of the easiest mistakes to make in HSC Physics.
Suppose a graph looks sinusoidal. The horizontal spacing between two peaks is \(0.020\).
Can you immediately call that the wavelength?
No. First check the horizontal axis.
If the horizontal axis is position, such as \(x\) in metres, the graph shows how the wave varies through space at an instant. The repeat distance is a wavelength.
If the horizontal axis is time, such as \(t\) in seconds, the graph shows how one location oscillates as time passes. The repeat interval is the period, \(T\), not the wavelength.
Compare these two ideas:
\[
\lambda = \text{spatial period}
\]
\[
T = \text{time period}
\]
They describe the same repeating behaviour from different viewpoints.
A wave might repeat every \(0.50\text{ m}\) through space and every \(0.0020\text{ s}\) in time. Those numbers describe different quantities and have different units.
Only if you know the wave speed can you connect them using
\[
v=f\lambda
\]
or, because \(f=\frac{1}{T}\),
\[
v=\frac{\lambda}{T}
\]
where \(v\) is wave speed in metres per second, \(f\) is frequency in hertz, \(\lambda\) is wavelength in metres, and \(T\) is period in seconds.
07The most tempting mistake: “These two points have the same height”
Imagine two points on a sinusoidal wave that are both \(2.0\text{ cm}\) above equilibrium. One lies on the rising part of the wave and the other lies on the falling part.
A student might predict that they are corresponding points because their displacements are equal.
That feels reasonable. But displacement only tells you one piece of information about the wave’s stage.
Picture going around a circular running track. You might be directly east of the centre once while running north and later reach a geometrically related position while moving differently. One coordinate alone does not tell you your complete position in the cycle.
Similarly, two wave points can have equal displacement without having equal phase.
For a sinusoidal snapshot, check the local shape as well:
- same height and same slope direction can identify corresponding points,
- same height but opposite slopes generally cannot.
There is one extra piece of precision worth keeping in mind. A still graph by itself does not necessarily tell you the instantaneous motion of each particle. “Rising curve” here refers to the spatial slope of the drawn wave, not automatically to a particle moving upwards in time.
08A quick method for unfamiliar wave diagrams
When you need to find wavelength from a diagram or graph:
- Check the horizontal axis. It must represent position or distance if you want to measure wavelength directly.
- Choose an unmistakable point in the pattern. A crest, trough, compression centre, or clearly directed equilibrium crossing works well.
- Find the next corresponding point. Match the same stage of the repeating pattern.
- Measure the horizontal separation. Wavelength is a spatial distance, so do not measure diagonally along the curved wave.
- If possible, measure across several wavelengths. Divide the total separation by the number of complete wavelength intervals.
That fourth step deserves attention. Wavelength is not the length of the wiggly curve between two crests. It is the distance the pattern takes to repeat along the direction in which the wave is travelling.
09Questions and solutions
Question 1
A wave snapshot has consecutive crests at \(x=0.60\text{ m}\) and \(x=2.10\text{ m}\). Determine the wavelength.
Solution 1
The wavelength is \(1.50\text{ m}\).
Consecutive crests are corresponding points, so their horizontal separation is one complete wavelength.
\[
\lambda = 2.10\text{ m} – 0.60\text{ m}
= 1.50\text{ m}
\]
Therefore,
\[
\boxed{\lambda=1.50\text{ m}}
\]
The result means the entire spatial pattern repeats every \(1.50\text{ m}\).
Question 2
A sinusoidal wave crosses its equilibrium position while sloping upwards at \(x=1.4\text{ m}\). Its next equilibrium crossing, which slopes downwards, occurs at \(x=2.1\text{ m}\).
Determine the wavelength.
Solution 2
The wavelength is \(1.4\text{ m}\), not \(0.7\text{ m}\).
The separation between the two given crossings is
\[
\Delta x = 2.1\text{ m} – 1.4\text{ m}
= 0.7\text{ m}
\]
However, an upward crossing and the next downward crossing are half a cycle apart:
\[
\Delta x = \frac{\lambda}{2}
\]
Therefore,
\[
\lambda = 2\Delta x
=2(0.7\text{ m})
=1.4\text{ m}
\]
So,
\[
\boxed{\lambda=1.4\text{ m}}
\]
The tempting error is to treat any two equilibrium crossings as corresponding. Their opposite slopes show that they are at different stages of the pattern.
Question 3
Seven consecutive compression centres in a longitudinal wave occupy a total distance of \(2.70\text{ m}\), measured from the first compression centre to the seventh.
Determine the wavelength.
Solution 3
The wavelength is \(0.450\text{ m}\).
Compression centre to compression centre represents one wavelength, but seven compression centres contain only six complete intervals.
Thus,
\[
n=7-1=6
\]
Using
\[
\lambda=\frac{\Delta x}{n}
\]
gives
\[
\lambda
=\frac{2.70\text{ m}}{6}
=0.450\text{ m}
\]
Therefore,
\[
\boxed{\lambda=0.450\text{ m}}
\]
The main trap is dividing by seven because seven compression centres are visible. The wavelength intervals are the six gaps between them.
Question 4
A student records the displacement of one point on a rope. Successive maximum positive displacements occur at \(t=0.12\text{ s}\) and \(t=0.44\text{ s}\).
The student states, “The wavelength is \(0.32\text{ m}\) because the peaks are \(0.32\) apart.”
Explain what is wrong with this statement and determine the quantity that can actually be found from the data.
Solution 4
The student cannot determine the wavelength directly. The data give a period of \(0.32\text{ s}\).
The horizontal variable is time, not position. Therefore, the separation between repeating points is a time period:
\[
T = 0.44\text{ s} – 0.12\text{ s}
=0.32\text{ s}
\]
Hence,
\[
\boxed{T=0.32\text{ s}}
\]
The student’s numerical subtraction is fine, but the physical interpretation and unit are wrong. A wavelength must be a spatial distance, usually measured in metres.
If the wave speed \(v\) were also known, the wavelength could then be calculated from
\[
\lambda=vT
\]
Without the wave speed or some equivalent spatial information, the wavelength cannot be determined from this time graph alone.
Question 5
A sinusoidal wave snapshot has point \(P\) at \(x=0.50\text{ m}\), where the displacement is \(+3.0\text{ cm}\) and the curve slopes upwards.
Point \(Q\) is at \(x=1.10\text{ m}\), also with displacement \(+3.0\text{ cm}\), but the curve slopes downwards.
Point \(R\) is at \(x=2.30\text{ m}\), with displacement \(+3.0\text{ cm}\) and the curve slopes upwards.
Which of \(Q\) and \(R\) can be used with \(P\) to determine the wavelength directly? Calculate that wavelength.
Solution 5
Point \(R\) corresponds to \(P\), giving a wavelength of \(1.80\text{ m}\). Point \(Q\) does not correspond to \(P\).
Although \(P\), \(Q\), and \(R\) all have the same displacement, equal displacement alone does not guarantee equal phase.
At \(P\), the wave is at \(+3.0\text{ cm}\) and slopes upwards. Point \(Q\) has the same displacement but slopes downwards, so it is at a different stage of the spatial cycle.
Point \(R\) matches both the displacement and the local direction of the pattern. It is therefore a corresponding point.
The wavelength is the horizontal separation from \(P\) to \(R\):
\[
\lambda
=2.30\text{ m}-0.50\text{ m}
=1.80\text{ m}
\]
Therefore,
\[
\boxed{\lambda=1.80\text{ m}}
\]
This question exposes why “same height” is not a complete test for corresponding points. You need the pattern to have returned to the same stage.
Question 6
A student is given a periodic wave profile but no scale markings between \(x=0\text{ m}\) and \(x=4.8\text{ m}\). The graph shows a trough exactly at \(x=0\text{ m}\), then three more troughs, with the fourth trough exactly at \(x=4.8\text{ m}\).
The student argues that the wavelength is \(4.8/4=1.2\text{ m}\) because four troughs are shown. Determine the correct wavelength and explain the counting error.
Solution 6
The correct wavelength is \(1.6\text{ m}\). The four troughs create three wavelength intervals, not four.
Starting at the first trough, the pattern must repeat once to reach the second trough, twice to reach the third, and three times to reach the fourth.
So the \(4.8\text{ m}\) distance contains
\[
n=3
\]
complete wavelengths.
Using
\[
\lambda=\frac{\Delta x}{n}
\]
gives
\[
\lambda
=\frac{4.8\text{ m}}{3}
=1.6\text{ m}
\]
Therefore,
\[
\boxed{\lambda=1.6\text{ m}}
\]
The student’s error comes from counting landmarks instead of intervals. Whenever several corresponding points are given, count the spaces between them.
10What wavelength lets you understand next
Once you can identify wavelength correctly, several later wave ideas become much easier.
You can compare wavelength with frequency using
\[
v=f\lambda
\]
and reason about what must happen to \(\lambda\) when wave speed or frequency changes. You can also describe phase differences more precisely. Points separated by one wavelength are in phase, while points separated by half a wavelength are half a cycle out of phase.
Those relationships feed directly into interference, standing waves, diffraction, and electromagnetic waves. But all of them rely on the same first skill: finding where a wave has genuinely returned to the same point in its spatial pattern.