
Sound as a Longitudinal Pressure Wave: HSC Physics Guide
Understand how particle displacement creates compressions, rarefactions, and pressure variations in sound waves. Includes worked examples and HSC-style questions with solutions.
Imagine a loudspeaker cone suddenly moves forward. The air just in front of it gets squeezed. A moment later, that squeezed region has moved across the room towards your ear. But the air molecules themselves have not travelled from the speaker to you.
So what actually moves?
Before reading on, predict this: at the centre of a compression, where the pressure is highest, are the air particles at their maximum displacement from their normal positions?
A very tempting answer is yes. It is also the key misconception we need to fix.
01Start with a row of air
Picture the air as a row of tiny parcels. Each parcel represents a small group of molecules near an equilibrium position.
When there is no sound, the average spacing is uniform and the pressure is approximately constant.
Now imagine the first parcel is pushed to the right. It crowds the next parcel, which crowds the next one, and so on.
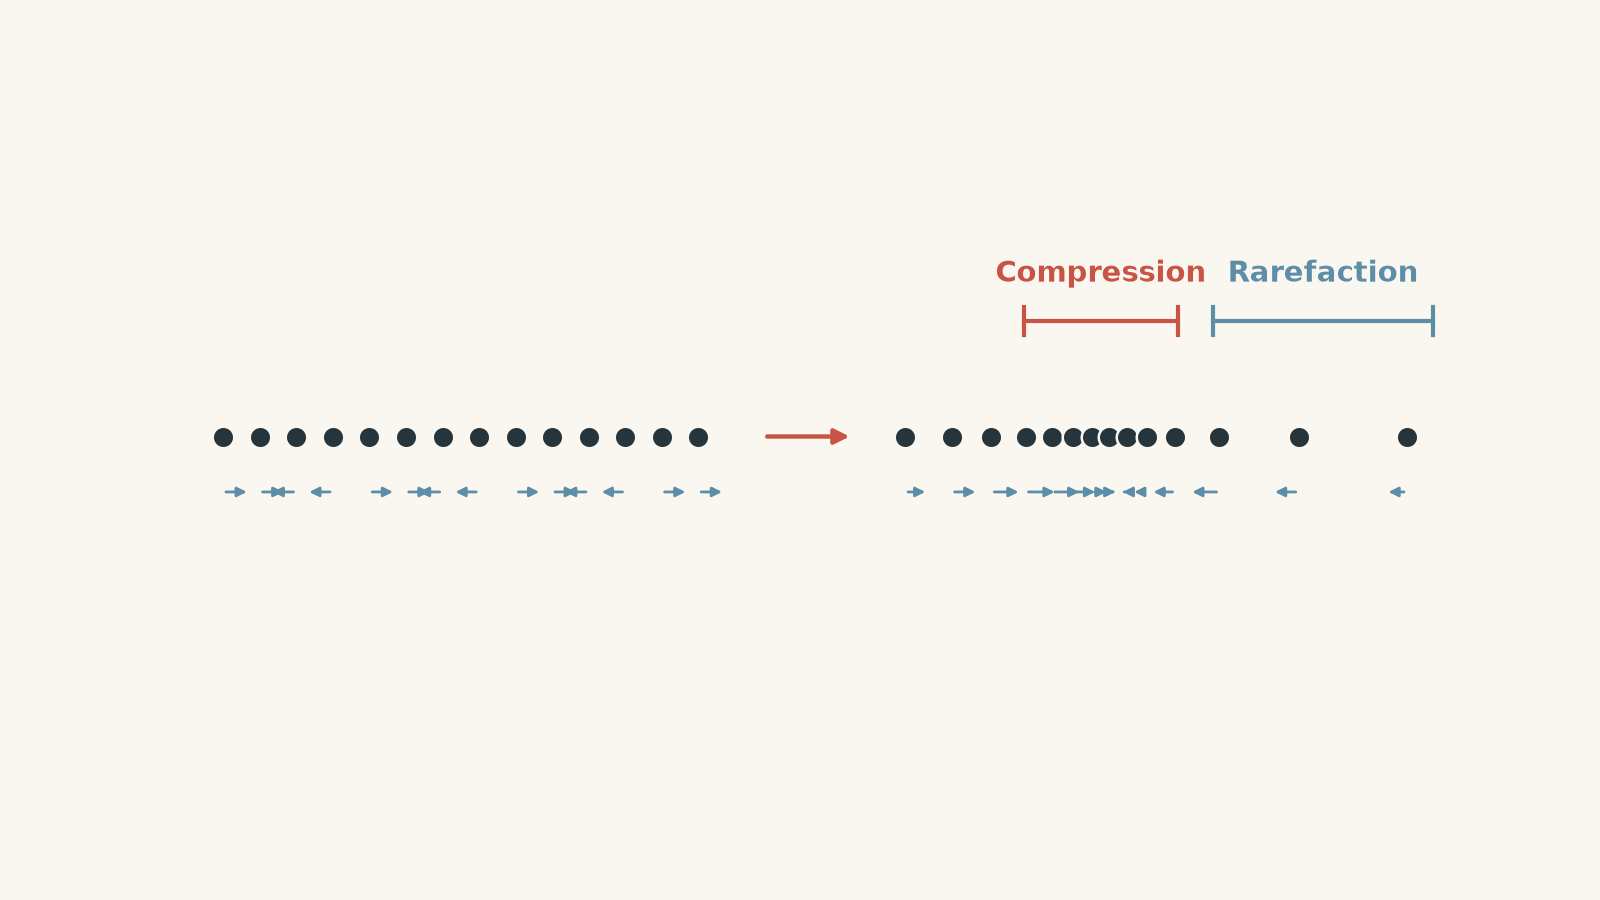
The important point is that the disturbance travels, while each parcel only oscillates backwards and forwards around its usual position.
This is why sound in air is called a longitudinal wave. The particles of the medium oscillate parallel to the direction in which the wave travels.
If the sound travels to the right, the air parcels move left and right.
They do not steadily drift to the right with the sound.
02Compressions and rarefactions
Suppose neighbouring air parcels move closer together.
There are now more molecules, on average, in the same small volume. The local pressure rises. This region is a compression.
Now suppose neighbouring parcels move further apart.
There are fewer molecules, on average, in that volume. The local pressure falls. This region is a rarefaction.
So the basic connection is:
| What the air is doing | Spacing | Pressure |
|---|---|---|
| Particles crowd together | Smaller than normal | Higher than normal |
| Particles have normal spacing | Normal | Normal |
| Particles spread apart | Larger than normal | Lower than normal |
A sound wave can therefore be described as a travelling pattern of alternating high-pressure compressions and low-pressure rarefactions.
It is worth being precise here. Individual gas molecules already move rapidly and randomly because of thermal motion. When we talk about particle displacement in a sound wave, we mean the small organised motion of a parcel of air averaged over many molecules.
03A useful queue analogy
Imagine a long queue of people, each standing roughly one metre apart.
Everyone is told to step forwards and backwards around their original spot. If people on both sides move towards the same point, that section of the queue becomes crowded. That is like a compression.
If they move away from the same point, a gap opens. That is like a rarefaction.
With the right timing, the crowded region can travel along the queue even though nobody walks all the way from one end to the other.
That is roughly what a sound wave does.
The analogy breaks because real air molecules are not standing neatly in a line or watching the person beside them. They move randomly in three dimensions, and pressure forces between neighbouring regions of gas create the organised wave motion.
04Displacement is not the same thing as pressure
Now return to the prediction from the start.
At the centre of a compression, are particles at their maximum displacement?
No.
Pressure does not depend simply on how far a particle has moved from its equilibrium position. It depends on whether neighbouring particles have moved towards or away from one another.
That distinction is easier to see with three neighbouring air parcels.
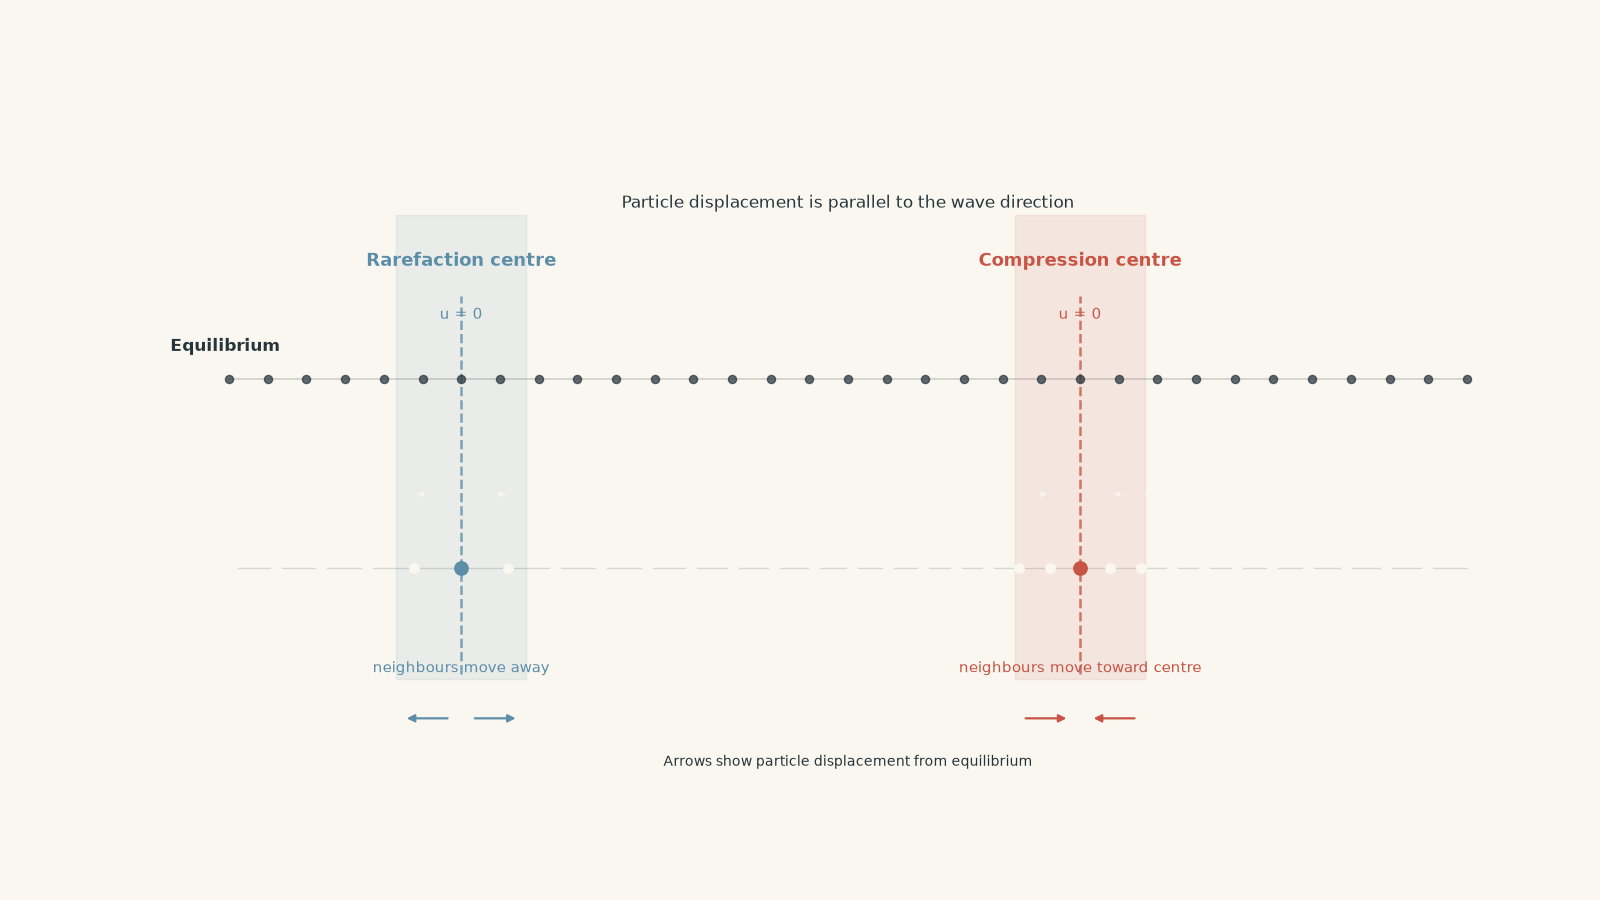
Suppose the parcel on the left has moved right and the parcel on the right has moved left. They have moved towards the middle.
The air near the middle is compressed, so its pressure is high.
Yet the parcel exactly at the centre of that compression can be passing through its equilibrium position. Its displacement can be zero.
This gives an important HSC-level idea:
A large particle displacement does not automatically mean a large pressure variation.
The relative displacement of neighbouring particles is what changes their spacing and therefore changes pressure.
05What happens at a compression centre?
Consider a smooth sinusoidal sound wave at one instant.
At the centre of a compression:
- the pressure is at a maximum,
- particles immediately to the left have been displaced towards the centre,
- particles immediately to the right have also been displaced towards the centre,
- particle spacing is smallest,
- the particle at the exact centre can have zero displacement from its equilibrium position.
At the centre of a rarefaction:
- the pressure is at a minimum,
- particles on either side have moved away from the centre,
- particle spacing is largest,
- the particle at the exact centre can again have zero displacement.
This initially feels backwards. If displacement is zero, how can anything interesting be happening?
Because pressure is controlled by the difference in displacement between neighbouring positions, not just the displacement at one position.
A crowd can form around someone who has not moved at all if everyone beside them steps towards them. Slightly awkward for the person in the middle, but perfectly good wave physics.
06Where is particle displacement greatest?
Now make another prediction.
If the pressure variation is zero at some point in a sinusoidal sound wave, must the air there be completely undisturbed?
No.
At positions where the pressure is momentarily equal to the equilibrium pressure, the particle displacement can actually be at its maximum magnitude.
Why?
Around that point, neighbouring parcels are displaced by almost the same amount. Their spacing is therefore approximately normal, so there is no compression or rarefaction at that instant.
This gives the pattern:
| Location in a sinusoidal sound wave | Pressure variation | Particle displacement |
|---|---|---|
| Centre of compression | Maximum positive | Zero |
| Between compression and rarefaction | Zero | Maximum magnitude |
| Centre of rarefaction | Maximum negative | Zero |
| Between rarefaction and next compression | Zero | Maximum magnitude |
For a sinusoidal progressive sound wave, the pressure pattern and displacement pattern are shifted by one quarter of a wavelength in space.
That is:
\[
\frac{\lambda}{4}
\]
where \(\lambda\) is the wavelength in metres.
Do not confuse this with the distance from a compression to the next rarefaction. That separation is half a wavelength:
\[
\frac{\lambda}{2}
\]
07Wavelength in a longitudinal sound wave
Wavelength is not limited to the familiar crest-to-crest picture of a transverse wave.
For sound, one wavelength can be measured between any two nearest points in the same stage of the pressure pattern.
For example:
- compression centre to next compression centre: \(\lambda\),
- rarefaction centre to next rarefaction centre: \(\lambda\),
- compression centre to nearest rarefaction centre: \(\lambda/2\),
- compression centre to nearest maximum particle displacement: \(\lambda/4\).
The usual wave equation still applies:
\[
v = f\lambda
\]
where:
- \(v\) is wave speed in metres per second (\(\text{m s}^{-1}\)),
- \(f\) is frequency in hertz (\(\text{Hz}\)),
- \(\lambda\) is wavelength in metres (\(\text{m}\)).
Frequency tells us how many complete pressure cycles pass a point each second.
A microphone detects these pressure changes. Its signal rises and falls as compressions and rarefactions arrive.
Worked example: Finding the spacing of compressions
A sound wave has a frequency of \(680\ \text{Hz}\) and travels through air at \(340\ \text{m s}^{-1}\). Find the wavelength and the distance from the centre of one compression to the centre of the nearest rarefaction.
Step 1
\[
v = f\lambda
\]
Rearrange for wavelength:
\[
\lambda = \frac{v}{f}
\]
Step 2
\[
\lambda = \frac{340\ \text{m s}^{-1}}{680\ \text{s}^{-1}}
= 0.500\ \text{m}
\]
The wavelength is therefore \(0.500\ \text{m}\).
Step 3
A compression and the nearest rarefaction are separated by half a wavelength:
\[
\frac{\lambda}{2}
= \frac{0.500}{2}
= 0.250\ \text{m}
\]
So the nearest rarefaction centre is \(0.250\ \text{m}\) from the compression centre.
This means successive compression centres are \(0.500\ \text{m}\) apart, while high and low pressure regions alternate every \(0.250\ \text{m}\).
08Pressure variation at one fixed position
So far, we have imagined taking a snapshot of the whole wave.
Now stand at one fixed position and let the sound pass you.
The pressure there does not remain high at a compression forever. It changes with time:
- equilibrium pressure,
- higher pressure as a compression arrives,
- back through equilibrium,
- lower pressure as a rarefaction arrives,
- back to equilibrium.
Then the cycle repeats.
If \(P_0\) is the normal atmospheric pressure at that location and \(\Delta P\) is the pressure variation caused by the sound, then the instantaneous pressure can be written as
\[
P = P_0 + \Delta P
\]
A compression has \(\Delta P > 0\).
A rarefaction has \(\Delta P < 0\).
The sound pressure variation is usually tiny compared with the total atmospheric pressure. A sound wave does not mean the pressure is alternating between “pressure” and “no pressure”. It is a small variation around the existing atmospheric pressure.
09Period, frequency, and the arrival of compressions
The period \(T\) is the time for one complete oscillation:
\[
T = \frac{1}{f}
\]
where \(T\) is measured in seconds and \(f\) in hertz.
For a microphone at a fixed point, one period is also the time between successive equivalent parts of the pressure pattern, such as one pressure maximum and the next pressure maximum.
Worked example: Connecting a microphone signal to particle displacement
A microphone records consecutive pressure maxima \(1.25\ \text{ms}\) apart. The speed of sound is \(340\ \text{m s}^{-1}\).
Find the frequency, the wavelength, and the distance from a compression centre to the nearest position of maximum particle displacement.
Step 1
\[
T = 1.25\ \text{ms}
= 1.25\times10^{-3}\ \text{s}
\]
Step 2
\[
f = \frac{1}{T}
= \frac{1}{1.25\times10^{-3}\ \text{s}}
= 800\ \text{Hz}
\]
So \(800\) complete pressure cycles pass the microphone each second.
Step 3
Using \(v=f\lambda\),
\[
\lambda = \frac{v}{f}
= \frac{340\ \text{m s}^{-1}}{800\ \text{s}^{-1}}
= 0.425\ \text{m}
\]
Step 4
A compression centre is a pressure maximum. Maximum particle displacement occurs one quarter of a wavelength from a pressure maximum:
\[
\frac{\lambda}{4}
= \frac{0.425\ \text{m}}{4}
= 0.10625\ \text{m}
\]
To three significant figures:
\[
\frac{\lambda}{4}=0.106\ \text{m}
\]
So the nearest position of maximum particle displacement is \(0.106\ \text{m}\) from the compression centre.
Notice what would go wrong if we assumed “maximum pressure means maximum displacement”. We would place both maxima at the same position, but a sinusoidal sound wave does not behave that way.
10A pressure graph is not a picture of air moving up and down
A common diagram of sound shows a sine curve.
That curve can be useful, but it is easy to misread.
If the vertical axis is pressure variation, an upward peak represents high pressure. It does not mean air molecules have physically moved upwards.
Likewise, if a graph shows particle displacement, the vertical axis represents displacement along the direction of wave travel, even though the curve itself has been drawn vertically so we can see it.
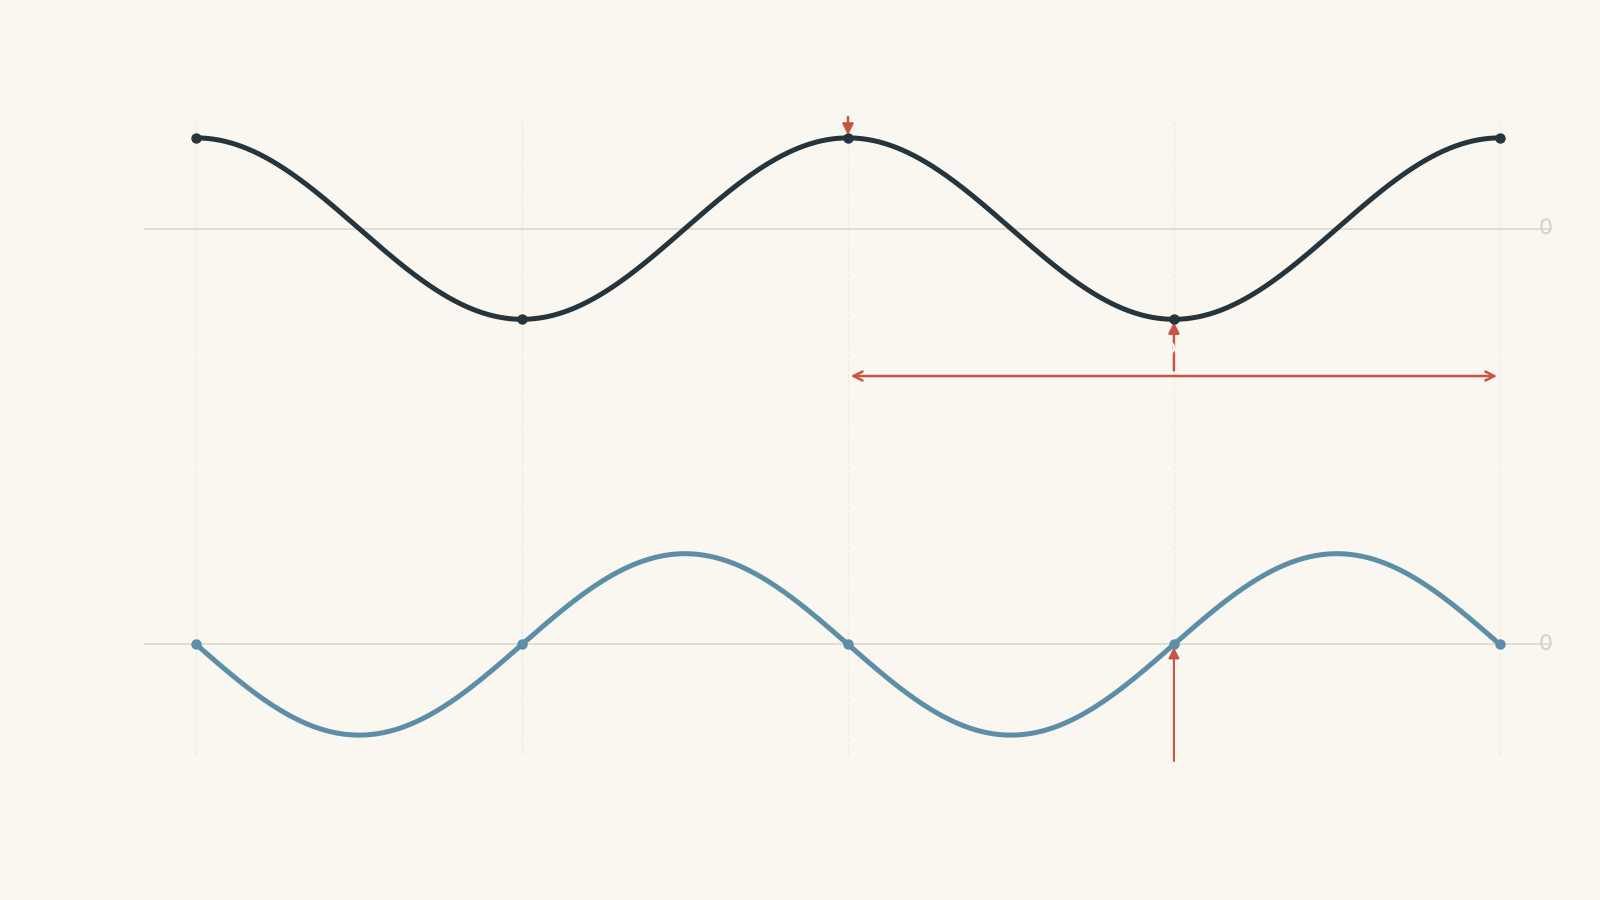
The graph is a mathematical representation of a quantity changing with position. It is not the literal shape of the sound wave in space.
This matters because sound in air is longitudinal, even when its pressure graph looks like the familiar sine-shaped drawing of a transverse wave.
11The most useful way to connect the four ideas
When you see particle displacement, compression, rarefaction, and pressure variation in the same problem, work through them in this order:
- Ask how neighbouring particles are displaced.
- Decide whether their spacing becomes smaller, larger, or stays approximately unchanged.
- Smaller spacing means compression and increased pressure.
- Larger spacing means rarefaction and decreased pressure.
- Similar displacement of neighbouring particles can produce large particle displacement but little pressure change.
That last point is usually the trap.
The pressure at one location cannot be determined just by asking, “How far has this particle moved?” You need to know what nearby particles are doing too.
12Questions and solutions
Question 1
A loudspeaker produces a sound wave travelling to the right through air. At one instant, a small region contains air parcels that are closer together than their equilibrium spacing.
Identify the type of region, state whether its pressure is above or below the equilibrium pressure, and describe the general direction in which particles on either side of its centre have been displaced.
Solution 1
The region is a compression, its pressure is above the equilibrium pressure, and particles on either side have been displaced towards the compressed region.
A compression forms when neighbouring air parcels become closer together than normal. More molecules are then present, on average, within a given small volume, so the local pressure is higher than its equilibrium value.
The particles do not need to be travelling with the wave. They only need to have been displaced in a way that reduces their local spacing.
Question 2
A sound wave travels at \(336\ \text{m s}^{-1}\) and has a frequency of \(420\ \text{Hz}\).
Calculate:
a. its wavelength,
b. the distance between a compression centre and the nearest rarefaction centre,
c. the distance between a compression centre and the nearest position of maximum particle displacement.
Solution 2
The wavelength is \(0.800\ \text{m}\), the compression-to-rarefaction distance is \(0.400\ \text{m}\), and the nearest maximum particle displacement is \(0.200\ \text{m}\) from the compression centre.
For part a, use
\[
v=f\lambda
\]
so
\[
\lambda=\frac{v}{f}
=\frac{336\ \text{m s}^{-1}}{420\ \text{s}^{-1}}
=0.800\ \text{m}
\]
For part b, a compression and its nearest rarefaction are half a wavelength apart:
\[
\frac{\lambda}{2}
=\frac{0.800\ \text{m}}{2}
=0.400\ \text{m}
\]
For part c, a pressure maximum and a maximum particle displacement are one quarter wavelength apart:
\[
\frac{\lambda}{4}
=\frac{0.800\ \text{m}}{4}
=0.200\ \text{m}
\]
The important distinction is that a rarefaction is not the point of maximum particle displacement. A rarefaction is a pressure minimum, and for a sinusoidal wave its centre corresponds to zero particle displacement.
Question 3
At one instant in a sinusoidal sound wave, air parcel A is displaced \(2.0\ \text{mm}\) to the right of its equilibrium position. The parcels immediately beside A are also displaced approximately \(2.0\ \text{mm}\) to the right.
A student claims that parcel A must be inside a strong compression because its displacement is large.
Explain why this conclusion does not follow from the information given.
Solution 3
The large displacement does not imply a strong compression because pressure depends on changes in spacing between neighbouring parcels, not on the absolute displacement of one parcel.
Parcel A and its neighbours have all moved approximately the same distance in the same direction. Their relative spacing may therefore be almost unchanged.
If their spacing is unchanged, the local air is neither strongly compressed nor strongly rarefied, so the pressure variation can be close to zero even though the particle displacement is large.
The tempting mistake is to treat particle displacement as though it directly measures pressure. It does not. Compression occurs when nearby particles are displaced towards one another.
Question 4
A pressure sensor detects a sinusoidal sound wave with a period of \(2.00\ \text{ms}\). The sound speed is \(350\ \text{m s}^{-1}\).
At a particular instant, point X is at the centre of a compression. Point Y is \(0.175\ \text{m}\) further along the direction of travel.
Determine the pressure condition and particle displacement at Y relative to their equilibrium values.
Solution 4
Point Y is at the centre of a rarefaction, so its pressure variation is maximally negative, while its particle displacement is zero.
First calculate the frequency:
\[
T=2.00\times10^{-3}\ \text{s}
\]
\[
f=\frac{1}{T}
=\frac{1}{2.00\times10^{-3}\ \text{s}}
=500\ \text{Hz}
\]
Now calculate the wavelength:
\[
\lambda=\frac{v}{f}
=\frac{350\ \text{m s}^{-1}}{500\ \text{s}^{-1}}
=0.700\ \text{m}
\]
The separation between X and Y is
\[
0.175\ \text{m}
=\frac{0.700\ \text{m}}{4}
=\frac{\lambda}{4}
\]
At first glance, it is tempting to say that a quarter-wavelength from a pressure maximum must be a pressure minimum. That is incorrect. A quarter-wavelength from a pressure maximum, the pressure variation is zero and particle displacement is at a maximum.
So the stated conclusion above needs to be corrected: Y has equilibrium pressure at that instant and maximum-magnitude particle displacement.
This is exactly why the quarter-wavelength and half-wavelength relationships need to be kept separate. A rarefaction centre is half a wavelength from the compression centre:
\[
\frac{\lambda}{2}=0.350\ \text{m}
\]
Point Y is only \(0.175\ \text{m}\) away, so it lies between the compression and rarefaction centres.
Question 5
Two diagrams are proposed for the same right-travelling sinusoidal sound wave.
In Diagram A, every pressure maximum occurs at a position where particle displacement is also at a positive maximum.
In Diagram B, every pressure maximum occurs where particle displacement is zero. On one side of that position particles are displaced towards it, and on the other side particles are also displaced towards it.
Which diagram is physically consistent with a longitudinal sound wave in air? Explain why, without relying only on a memorised phase difference.
Solution 5
Diagram B is physically consistent with the sound wave.
A pressure maximum requires a local compression. For a compression to exist, neighbouring air parcels must be closer together than their equilibrium spacing.
In Diagram B, parcels on both sides are displaced towards the same location. Their separation decreases, producing a compression and therefore a pressure maximum. The parcel at the exact centre can still have zero displacement because the compression is produced by the way the surrounding displacement changes with position.
Diagram A contains the tempting misconception that the greatest particle displacement must produce the greatest pressure. If nearby parcels all had similarly large positive displacements, they could move together without substantially changing their separation. Large displacement alone therefore does not establish high pressure.
The deeper rule is that pressure variation comes from spatial changes in particle displacement. Once that connection is clear, the quarter-wavelength offset between displacement and pressure becomes a consequence of the physics rather than a fact that has to be memorised.
Understanding this relationship is the useful next step towards analysing wave phase, interference, and standing sound waves. In a standing wave, the locations of pressure nodes, pressure antinodes, displacement nodes, and displacement antinodes depend directly on the same distinction between particle motion and pressure variation.