
AAS vs AES: How Absorption and Emission Identify Elements
Learn how atomic absorption spectroscopy (AAS) and atomic emission spectroscopy (AES) use electron energy changes and characteristic wavelengths to identify elements and measure their concentrations. Compare their instruments, calibration methods, and connections to flame tests.
Heat two colourless solutions in separate flames. One produces an intense yellow glow; the other barely colours the flame. Which solution contains more of its metal?
You can’t reliably tell. A tiny amount of sodium can produce such intense yellow emission that it overwhelms the colours from other elements. The brightest flame does not necessarily belong to the most concentrated solution.
Now predict what a scientific instrument would need to measure. Would recording the total brightness of each flame solve the problem? Not by itself. The instrument needs to separate light by wavelength to help identify the elements, then measure a calibrated signal to determine how much of each element is present.
Flame brightness is not concentration
| Sample A: sodium | Small amount; intense yellow flame. Spectrum: dominant doublet near 589.0 nm and 589.6 nm. |
|---|---|
| Sample B: another metal | Faintly coloured flame; distinct emission lines. It may contain more metal than Sample A. |
01From flame colour to spectroscopy
A flame test is a useful starting point because different elements can produce different characteristic colours when heated. However, the human eye sees a blended colour rather than a precise record of every wavelength present.
Scientists needed a way to separate those wavelengths.
In the mid-19th century, Robert Bunsen and Gustav Kirchhoff investigated the light emitted by heated substances. Their work helped establish spectroscopy as a method for identifying elements, including the discoveries of caesium in 1860 and rubidium in 1861.
The key improvement was to examine the light more carefully.
Imagine the apparatus arranged from left to right:
- A burner heats a sample, causing it to emit light.
- The light enters a narrow slit, which produces a defined beam.
- Optical components direct the beam through a prism, separating its wavelengths.
- A telescope or eyepiece allows the observer to examine the resulting spectrum.
If every element emitted exactly the same pattern of light, this apparatus would tell us very little. Instead, the observations revealed distinct spectral lines at characteristic wavelengths for different elements.
How a prism spectroscope separates light
- Burner
Heats the sample, producing emitted light.
- Narrow slit
Forms a narrow, defined beam of light.
- Collimating optics
Makes the light rays approximately parallel.
- Prism
Refracts different wavelengths by different amounts.
Separates the light into distinct spectral lines.
- Viewing telescope
Magnifies the separated spectrum for observation.
Line wavelengths help identify the emitting elements.
This established an important principle: the wavelengths an element emits can help identify it.
However, identifying an element and measuring its concentration are different problems. The intensity of emitted light can change with flame temperature, the amount of sample entering the flame, and the proportion of atoms that become excited. A visual observation is also affected by overlapping colours and contamination.
Two related techniques address these problems in different ways: atomic absorption spectroscopy (AAS) and atomic emission spectroscopy (AES).
02First, understand what happens to the electrons
Both techniques rely on electrons changing between allowed energy levels inside atoms.
Think of an atom’s energy levels as a staircase. An electron can occupy particular energy levels, rather than any arbitrary energy in between. The staircase is an analogy, though: quantum energy levels are not literal steps, and electrons do not travel along fixed little staircases.
An electron can move to a higher energy level by absorbing energy. It can also move to a lower energy level and release energy.
The crucial point is that the energy change must match the difference between the two levels.
Absorption: the electron moves up
If a photon has exactly the right energy, an atom can absorb it. The photon disappears from the incident light beam, and the electron moves to a higher energy level.
This is the basic process measured by AAS.
Emission: the electron moves down
An atom can first gain energy through collisions in a flame or plasma. An electron then occupies a higher energy level. When it returns to a lower level, the atom can emit a photon.
This is the basic process measured by AES.
Absorption vs emission: electron energy transitions
| Absorption (AAS) | ΔE = hf = hc/λ Incoming photon travels towards the atom. Electron moves from lower to higher energy; the photon is absorbed. |
|---|---|
| Emission (AES) | ΔE = hf = hc/λ Excited electron drops from higher to lower energy. A photon of energy ΔE is emitted and travels away from the atom. |
The energy of a photon is related to its frequency and wavelength by
\[ E = hf = \frac{hc}{\lambda} \]
where:
- \(E\) is the photon energy, measured in joules (J).
- \(h\) is Planck’s constant.
- \(f\) is the frequency of the light, measured in hertz (Hz).
- \(c\) is the speed of light in a vacuum.
- \(\lambda\) is the wavelength, measured in metres (m).
Different elements have different sets of allowed energy levels. Consequently, they can absorb and emit light at characteristic wavelengths.
For a given pair of energy levels, the absorption and emission wavelengths correspond to the same energy difference. One process takes the electron up between those levels; the other takes it down.
This gives us the basis for both techniques. The difference is which light signal the instrument measures.
03Atomic absorption spectroscopy (AAS): measure the light that disappears
AAS asks a specific question: how much light at a chosen wavelength is absorbed by atoms in the sample?
In 1955, Alan Walsh described atomic absorption as a practical method for chemical analysis. Rather than relying on the sample to produce enough light through electronic excitation, the technique uses an external light source and measures how much of that light the sample absorbs.
Follow the light through an AAS instrument
Consider a typical flame AAS instrument.
Step 1: Prepare the sample.
A liquid sample is drawn into a nebuliser, which converts it into a fine aerosol. The aerosol enters a flame, where the solvent evaporates and the remaining material is vaporised and broken down to produce free gaseous atoms.
This process is called atomisation. The instrument needs free atoms because the characteristic atomic absorption lines arise from transitions in individual atoms, rather than simply from the original dissolved compound.
Step 2: Send in light from an external source.
A typical AAS instrument uses a hollow-cathode lamp designed for the element being analysed. For example, a copper lamp produces characteristic copper wavelengths.
The lamp sends light through the flame containing the sample atoms.
Step 3: Allow the atoms to absorb matching wavelengths.
Many of the free analyte atoms are in their ground state, the lowest electronic energy state. If a photon has the correct energy to move an electron to a higher level, the atom can absorb it.
The absorbed photon no longer continues along the original beam.
Step 4: Measure the remaining light.
After the beam passes through the flame, a monochromator selects the analytical wavelength. A detector measures the transmitted light intensity.
The instrument compares this with a reference intensity to determine how much light has been absorbed.
Flame AAS: light path and sample path
| Optical path: left to right | Hollow-cathode lamp → flame → monochromator → detector. Reference intensity I₀ enters the flame; transmitted intensity I leaves, with I < I₀ when absorption occurs. |
|---|---|
| Sample path: enters from the side | Sample aerosol enters the flame separately and forms free atoms. Ground-state analyte atoms absorb matching wavelengths. |
How does AAS turn absorption into a number?
The instrument measures absorbance, \(A\), using
\[ A = \log_{10}\left(\frac{I_0}{I}\right) \]
where:
- \(I_0\) is the incident or reference light intensity.
- \(I\) is the transmitted light intensity after the beam passes through the sample’s atom cloud.
- \(A\) is absorbance, which is dimensionless.
Suppose the reference intensity is 100 arbitrary units and the detector records 63.1 units after the beam passes through the flame.
Then
\[ \begin{aligned} A &= \log_{10}\left(\frac{100}{63.1}\right)\\\ &\approx 0.200 \end{aligned} \]
The sample has an absorbance of 0.200.
Why is this useful? If more suitable ground-state atoms are present in the light path, more photons can be absorbed. Under suitable conditions, absorbance increases with analyte concentration.
However, that relationship is not guaranteed to remain perfectly linear at every concentration. In actual analysis, the instrument uses a calibration curve to convert absorbance into concentration.
AAS is particularly useful for measuring a selected element at low concentrations. Its signal still depends on effective atomisation, the sample matrix, and possible background absorption or chemical interference. These effects must be controlled or corrected where necessary.
04Atomic emission spectroscopy (AES): measure the light that appears
AES approaches the problem from the opposite direction.
Instead of sending a known beam through the sample and measuring what disappears, it provides energy to the sample and measures the characteristic light the sample emits.
Follow the light through an AES instrument
Step 1: Introduce the sample.
As in flame AAS, a liquid sample can be converted into a fine aerosol and introduced into a flame. Other AES instruments use an excitation source such as an inductively coupled plasma (ICP), which produces a very hot plasma.
Step 2: Excite the atoms or ions.
Energy from collisions allows electrons to occupy higher energy levels. The sample now contains excited species that can emit light as they return to lower energy states.
Step 3: Collect the emitted light.
The instrument collects light from the flame or plasma. Unlike AAS, it does not need an element-specific lamp to send a beam through the sample.
Step 4: Separate and measure the wavelengths.
A monochromator or diffraction grating separates the emitted light into its component wavelengths. A detector measures the intensity at selected emission lines.
How atomic emission spectroscopy works
- Sample introduction
Aerosol enters a flame or plasma.
- Excitation and emission
Excited atoms or ions emit light as electrons drop to lower energy levels.
- Wavelength separation
Emitted light enters a slit and reaches a diffraction grating.
Different wavelengths separate into distinct spectral lines.
- Detection
A detector measures selected emission-line intensities.
No external lamp beam passes through the sample.
Why does the emitted light identify the element?
When an excited electron drops between two energy levels, it emits a photon corresponding to that energy difference.
Because different elements have different energy levels, they produce characteristic emission lines. An instrument can compare the measured wavelengths with reference spectra to identify the elements present.
For example, sodium has a prominent pair of emission lines near 589.0 nm and 589.6 nm. Their presence can provide evidence that sodium is present in the sample.
AES can also measure several elements in the same sample. This is particularly useful with ICP-AES, where a plasma and suitable optical system can support multi-element analysis.
But the same distinction between identity and quantity still applies. The wavelength helps identify the element; the intensity of its emission line can help determine its concentration.
The difficulty is that emission intensity depends not only on how many atoms are present, but also on how many are excited and able to emit at the selected wavelength. Changes in excitation conditions, sample introduction, and matrix composition can change the measured signal.
That is why AES also requires calibration.
05AAS vs AES: the essential differences
| Feature | Atomic absorption spectroscopy (AAS) | Atomic emission spectroscopy (AES) |
|---|---|---|
| What happens to electrons? | Electrons absorb energy and move to higher levels. | Excited electrons return to lower levels and release energy. |
| Source of the measured light | An external, element-specific lamp supplies the incident light. | The excited sample produces the light. |
| What does the detector measure? | The reduction in transmitted light intensity. | The intensity of emitted light at selected wavelengths. |
| Analytical signal | Absorbance. | Emission-line intensity. |
| How are elements identified? | The characteristic absorption wavelength is selected, usually using an element-specific lamp. | Emission wavelengths are matched to reference spectra. |
| How is concentration determined? | A calibration relating absorbance to concentration. | A calibration relating emission intensity to concentration. |
| Common limitation | Atomisation problems, background absorption, and chemical interference can affect the signal. | Excitation conditions, spectral interference, and matrix effects can affect the signal. |
The simplest way to remember the difference is this:
- AAS: shine light through the atoms and measure how much is absorbed.
- AES: excite the atoms and measure the light they emit.
Both use characteristic atomic energy transitions. Neither can determine concentration reliably from an uncalibrated signal alone.
06How spectroscopy identifies and quantifies elements
Identification and quantification are two separate stages of the analysis.
1. Identify the element using wavelength
A spectrum records light intensity against wavelength.
In AES, characteristic emission lines can be matched to known reference wavelengths. In AAS, the instrument uses the appropriate absorption wavelength for the target element.
The position of a line is the key evidence for identity. Its height or intensity is not enough on its own.
Real samples can contain overlapping lines or background signals, so analysts may check more than one characteristic line when the instrument allows it.
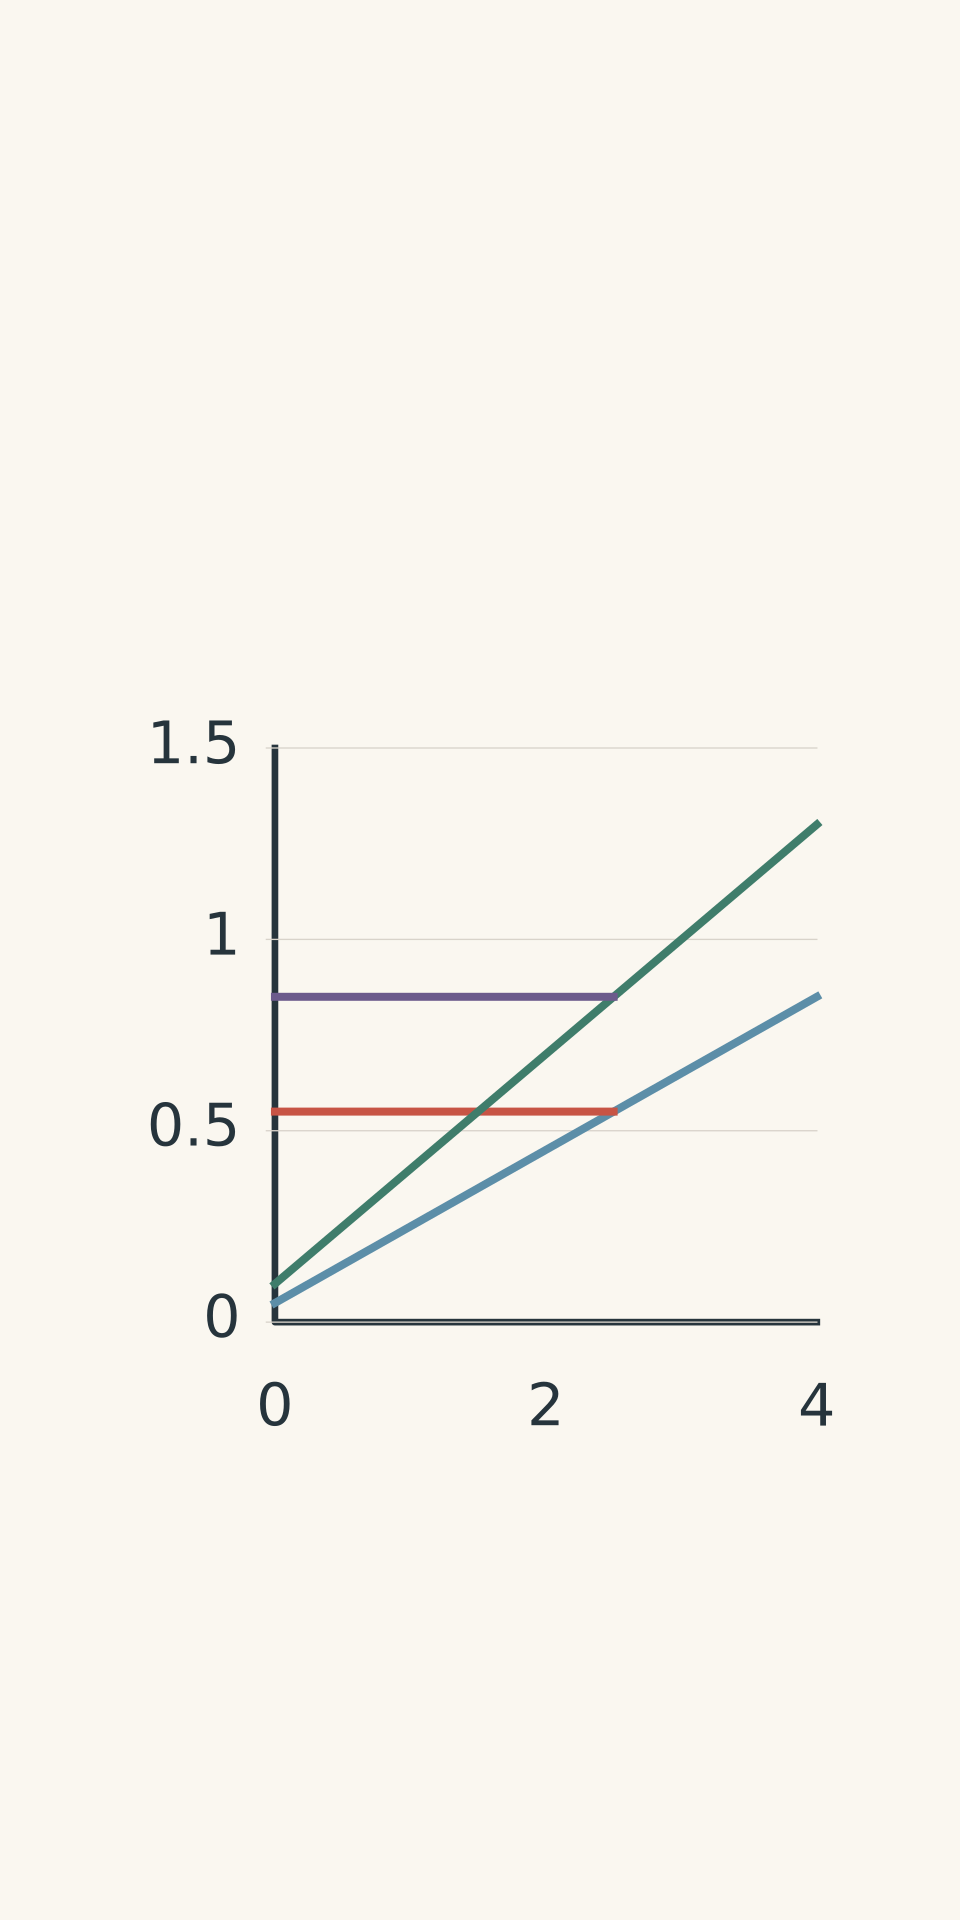
2. Determine the concentration using calibration
Suppose you want to determine the copper concentration in an unknown solution.
You cannot simply observe an absorbance value and declare a concentration. You first need to establish how the instrument responds to known concentrations of copper under the same measurement conditions.
The usual process is:
- Prepare standards containing known concentrations of the element.
- Measure each standard using the same instrument settings.
- Plot the analytical signal against concentration.
- Measure the unknown sample.
- Use the calibration curve to determine the concentration corresponding to its signal.
For AAS, the analytical signal is absorbance. For AES, it is emission intensity.
- AAS standards
- AAS unknown signal
- AES standards
- AES unknown signal
The calibration curve is essential because a real instrument does not necessarily produce a perfectly proportional response over its entire operating range. At high concentrations, for example, the relationship may become nonlinear.
If an unknown gives a signal outside the useful calibration range, the analyst may need to dilute the sample and measure it again. The dilution factor must then be included in the calculation.
Worked example: Find copper concentration from an AAS calibration
An AAS calibration for copper is described by
\[ A = 0.0500c + 0.0020 \]
where \(A\) is absorbance and \(c\) is copper concentration in mg/L. The coefficient 0.0500 has units of L/mg.
An unknown sample gives an absorbance of 0.127. Calculate its copper concentration.
Step 1: Rearrange the calibration equation to make concentration the subject.
\[ c = \frac{A - 0.0020}{0.0500} \]
Step 2: Substitute the measured absorbance.
\[ \begin{aligned} c &= \frac{0.127 - 0.0020}{0.0500}\\\ &= 2.50\ \text{mg/L} \end{aligned} \]
Step 3: Interpret the result.
The measured solution contains 2.50 mg/L of copper. If the sample had been diluted before measurement, this would be the concentration of the diluted solution, and the original concentration would need to be calculated using the dilution factor.
The important point is that the absorbance becomes a concentration only because the calibration relationship is known.
Worked example: Find potassium concentration using AES
An AES calibration for the potassium emission line at 766.5 nm is
\[ I = 18.0c + 4.0 \]
where \(I\) is the detector signal in arbitrary units, \(c\) is potassium concentration in mg/L, and 18.0 is the calibration slope in detector units per mg/L.
An unknown sample is diluted by a factor of 3.00. The diluted sample produces an emission intensity of 220 units at the potassium line. Calculate the original potassium concentration.
Step 1: Rearrange the calibration equation.
\[ c = \frac{I - 4.0}{18.0} \]
Step 2: Calculate the concentration in the diluted sample.
\[ \begin{aligned} c_{\text{diluted}} &= \frac{220 - 4.0}{18.0}\\\ &= 12.0\ \text{mg/L} \end{aligned} \]
Step 3: Correct for dilution.
The original solution was three times as concentrated as the diluted sample.
\[ \begin{aligned} c_{\text{original}} &= 3.00 \times 12.0\\\ &= 36.0\ \text{mg/L} \end{aligned} \]
Step 4: Interpret the result.
The original solution contains 36.0 mg/L of potassium, assuming the calibration is valid for the measured sample and the stated dilution was performed correctly.
Notice that two different pieces of information were needed. The characteristic wavelength identified the element, while the calibrated intensity determined its concentration.
07How do AAS and AES relate to flame tests?
A flame test is closely related to AES, not AAS.
When a suitable sample is introduced into a flame, the material can vaporise and produce gaseous atoms or ions. Collisions transfer energy to some of these species, exciting their electrons. As the electrons return to lower energy levels, light is emitted.
The wavelengths of this light help produce the characteristic flame colours observed in school chemistry.
However, a flame test and an instrumental AES measurement are not the same thing.
A flame test relies on the colour perceived by the human eye. Instrumental AES separates the emitted light into wavelengths and measures selected emission-line intensities with a detector.
AAS works differently again. It uses an external light source and measures the absorption of selected wavelengths by atoms in the sample.
What the eye sees vs what AES resolves
| Naked-eye flame test | The flame appears predominantly yellow. Strong sodium emission can mask weaker potassium colour. |
|---|---|
| Instrumental flame AES | Strong sodium doublet: 589.0 nm and 589.6 nm. Weaker potassium line: approximately 766.5 nm. |
Why can a flame test miss an element?
Return to the original puzzle: why might a sample containing sodium and potassium produce a yellow flame without an obvious lilac colour?
Sodium produces intense yellow emission. If its signal dominates the visible light, weaker emissions from other elements may be difficult to recognise by eye. Contamination and overlapping colours can make the interpretation even harder.
An instrumental method can separate wavelengths that the eye blends together. However, even an instrument has limits: a weak signal may fall below its detection limit, or interference may make it difficult to distinguish the analyte’s signal from the background.
For a closer explanation of why visual flame tests can miss ions in mixtures, see Why Flame Tests Can Miss Ions in a Chemical Mixture.
The distinction to remember is that a flame test provides a qualitative clue, while instrumental spectroscopy can provide quantitative evidence when supported by suitable calibration and interference checks.
08Questions and solutions
Question 1
A flame AAS instrument has a reference light intensity of 120 units. After the light passes through the sample’s atom cloud, the detector records 60 units.
Calculate the absorbance of the sample.
Solution 1
The absorbance is approximately 0.301. It measures the logarithmic reduction in light intensity caused by absorption.
Use
\[ A = \log_{10}\left(\frac{I_0}{I}\right) \]
Substitute the given values:
\[ \begin{aligned} A &= \log_{10}\left(\frac{120}{60}\right)\\\ &= \log_{10}(2)\\\ &\approx 0.301 \end{aligned} \]
Absorbance is dimensionless, so the intensity units cancel in the ratio.
The result does not give the analyte concentration by itself. You would need a suitable calibration curve to convert this absorbance into a concentration.
Question 2
An AAS calibration for zinc is
\[ A = 0.0320c + 0.0040 \]
where \(A\) is absorbance and \(c\) is zinc concentration in mg/L. The coefficient 0.0320 has units of L/mg.
A student transfers 2.00 mL of an unknown zinc solution into a 10.00 mL volumetric flask and makes it up to the mark with solvent. The diluted sample gives an absorbance of 0.164.
Calculate the zinc concentration in the original solution.
Solution 2
The original zinc concentration is 25.0 mg/L. First calculate the concentration of the diluted sample using the calibration equation, then correct for the dilution.
Step 1: Rearrange the calibration equation.
\[ c = \frac{A - 0.0040}{0.0320} \]
Step 2: Calculate the diluted concentration.
\[ \begin{aligned} c_{\text{diluted}} &= \frac{0.164 - 0.0040}{0.0320}\\\ &= 5.00\ \text{mg/L} \end{aligned} \]
Step 3: Calculate the dilution factor.
The original sample was diluted from 2.00 mL to a final volume of 10.00 mL.
\[ \text{Dilution factor} = \frac{10.00}{2.00} = 5.00 \]
Step 4: Calculate the original concentration.
\[ \begin{aligned} c_{\text{original}} &= 5.00 \times 5.00\\\ &= 25.0\ \text{mg/L} \end{aligned} \]
The original solution contains 25.0 mg/L of zinc. The common mistake is to report 5.00 mg/L as the final answer. That is the concentration in the diluted sample, not the original solution.
Question 3
An unknown sample produces a yellow flame. Instrumental AES identifies the characteristic sodium doublet near 589.0 nm and 589.6 nm, but the potassium emission line near 766.5 nm is weak.
A separate AAS measurement, using the appropriate potassium lamp and analytical wavelength, gives a clear absorption signal above the blank after suitable background correction.
Explain what can be concluded about the sample, why the weak potassium emission does not contradict the AAS result, and what additional step is needed to determine the potassium concentration.
Solution 3
The evidence supports the presence of both sodium and potassium, assuming the signals have been correctly identified and relevant interferences have been controlled. The potassium concentration still requires a suitable calibration.
The sodium emission lines indicate that sodium is present. The potassium absorption signal indicates that potassium atoms are absorbing light at the selected potassium wavelength.
These observations are compatible because AAS and AES measure different processes. AAS measures absorption by suitable atoms in the sample, whereas AES measures light emitted by excited species.
A weak potassium emission signal does not necessarily mean potassium is absent. Its emission depends on how many potassium species are excited, the measurement conditions, and the instrument’s sensitivity. Meanwhile, intense sodium emission can dominate the flame’s visible colour.
To determine the potassium concentration, the analyst must measure potassium standards of known concentration under suitable conditions, construct an AAS calibration curve, and compare the sample’s absorbance with that calibration. Any dilution must also be accounted for.
Question 4
An AES instrument records a sodium emission-line intensity of 500 units and a potassium emission-line intensity of 120 units in the same sample.
A student calculates \(500/120 = 4.17\) and concludes that the sodium concentration is 4.17 times the potassium concentration.
Is this conclusion justified? Explain why or why not, and describe how the concentrations should be determined.
Solution 4
No. The ratio of the two raw emission intensities does not establish the ratio of the sodium and potassium concentrations.
The two elements have different electronic energy levels and different emission transitions. Their emission efficiencies can differ, as can the fractions of atoms or ions occupying the relevant excited states. The detector may also respond differently at the two wavelengths.
Consequently, 500 units of sodium emission and 120 units of potassium emission do not necessarily represent a concentration ratio of 4.17.
The correct method is to calibrate each element separately using standards of known concentration and suitable analytical wavelengths. The sodium signal is compared with the sodium calibration, and the potassium signal is compared with the potassium calibration.
Only after converting both signals into concentrations can the concentration ratio be calculated. If either measurement is affected by spectral overlap or matrix effects, those problems must also be addressed.
Question 5
A solution produces an intense yellow flame. A high-resolution AES measurement identifies strong sodium lines, but the potassium line at 766.5 nm is below the instrument’s detection limit. A separate potassium AAS measurement is also below its detection limit.
Two explanations remain:
- The sample contains no potassium.
- The sample contains potassium at a concentration too low to detect, or its matrix interferes with the measurement.
You may prepare one additional aliquot and add a known amount of potassium standard. The added concentration is within the method’s calibrated working range.
Explain how this spike-recovery test should be used, what each possible outcome would tell you, and whether either outcome proves that the original sample contains exactly zero potassium.
Solution 5
A spike-recovery test can show whether the method responds appropriately to added potassium in the sample matrix, but it cannot prove that the original sample contains exactly zero potassium.
The test works by adding a known amount of potassium to a fresh aliquot and measuring the sample again. The analyst then compares the observed increase in signal with the increase expected from the calibration.
If the added potassium produces the expected response, the method is responding appropriately at the tested concentration. This provides evidence against a major matrix interference at that level. However, the original sample could still contain a small amount of potassium below the detection limit, or it could contain none. The successful spike does not distinguish those possibilities.
If the response is smaller than expected, the original non-detection becomes less conclusive. Matrix effects, chemical interference, spectral background, or an instrument setup problem may be suppressing or obscuring the signal. Further checks, such as matrix-matched standards, dilution, background correction, or a suitable alternative analytical line, may be needed.
The tempting conclusion is that two non-detections establish the absence of potassium. The problem is that both instruments have finite sensitivity, and both can be affected by the sample matrix. Agreement between two negative results strengthens the evidence only to the extent that their limitations have been considered.
The scientifically defensible conclusion is that potassium was not detected above the relevant method’s detection limit. Establishing a sufficiently low detection limit, and checking for matrix interference, are the next steps when the distinction between absence and a very small concentration matters.