
How to Separate Observation, Explanation and Evaluation in HSC Chemistry
Learn how to structure HSC Chemistry practical responses by separating observations, numerical evidence, chemical explanations, and specific method limitations. Includes worked examples on reaction rates and acid-base titrations, plus practice questions with detailed solutions.
A common HSC Chemistry practical answer looks like this: “The reaction got faster because more particles collided, so the experiment was accurate.”
It sounds scientific, but three different jobs have been squeezed into one sentence. The explanation doesn’t cite the results, and the claim about accuracy doesn’t follow from the explanation.
Before fixing it, consider this: which part of that sentence could you check directly against a results table? You can check the measured time. The collision explanation is a chemical model used to explain the result. Accuracy is a separate claim that needs its own evidence.
If you keep these jobs separate, your practical responses become clearer, more defensible, and much easier to mark.
01The four jobs in a practical response
A strong practical response moves through four stages: observation, data analysis, chemical explanation, and evaluation. Each stage answers a different question.
| Stage | The question it answers | Example from a reaction-rate practical |
|---|---|---|
| Observation | What did I see or measure? | The solution became cloudy, and the black cross disappeared. |
| Data analysis | What pattern do the results show? | Mean disappearance time fell from 45 s to 18 s as concentration increased. |
| Chemical explanation | Why does that pattern make chemical sense? | More frequent effective collisions produced sulfur more quickly. |
| Evaluation | How does the method limit the conclusion? | The visual endpoint depends on when the observer judges the cross to be obscured. |
Four stages of a practical response
- Observation
The cross disappeared after 18 s.
- Data pattern
Mean time fell from 45 s to 18 s as concentration increased.
- Chemical explanation
More frequent effective collisions produce sulfur faster.
- Evaluation
The visual endpoint limits timing precision.
The important point is that these stages connect, but they are not interchangeable.
1. Observation: describe what happened
An observation reports something directly seen, heard, or measured. It should not sneak in an explanation.
For example:
The solution became cloudy after hydrochloric acid was added, and the black cross became invisible.
This describes the experiment. It does not explain why the solution became cloudy.
Compare it with:
The solution became cloudy because the reaction rate increased.
The second statement jumps from an observation to an explanation. It also leaves out the actual chemical change responsible for the cloudiness.
When recording observations, include the relevant measurements and units. If the cross disappeared after 18 s, record 18 s rather than writing only that the reaction was fast.
2. Data analysis: use the numbers to establish a pattern
A list of measurements is not yet an analysis. You need to compare the results and state what they demonstrate.
Suppose the mean disappearance time decreases from 45 s to 18 s when the sodium thiosulfate concentration increases from \(0.040\ \mathrm{mol\,L^{-1}}\) to \(0.100\ \mathrm{mol\,L^{-1}}\).
You can conclude that the measured endpoint was reached sooner at the higher concentration.
You can go further by calculating a relative-rate indicator, \(1/t\), provided the method and endpoint are comparable. But the numbers alone do not establish the chemical reason for the trend.
A useful rule is to include at least two actual values when describing a relationship. “The reaction became faster” is much weaker than a statement showing how the measured time changed and under what conditions.
3. Chemical explanation: connect the evidence to a model
Now explain why the results make sense.
In a collision-theory explanation, higher reactant concentration means more reactant particles per unit volume. At the same temperature, this generally increases the frequency of collisions between reacting particles and therefore the number of successful collisions per second.
For the sodium thiosulfate practical, this means sulfur can form more quickly, making the solution cloudy sooner.
Notice the chain of reasoning:
Higher concentration → more frequent effective collisions → faster sulfur formation → cross obscured sooner.
Each step connects the chemical model to the observation. Simply writing “more collisions occurred” leaves the reader to work out the rest.
From chemical reaction to visible endpoint
- Reactants
Na₂S₂O₃(aq) + 2HCl(aq)
Aqueous sodium thiosulfate and hydrochloric acid react.
- Reaction products
2NaCl(aq) + SO₂(g) + S(s) + H₂O(l)
Solid sulfur forms as a finely divided suspension.
- Observed endpoint
S(s)
Sulfur scatters light; the cloudy solution obscures the black cross.
4. Evaluation: explain a specific limitation
This is where many responses lose precision.
“The experiment had human error” does not identify a limitation. It does not explain how the method affected the result or whether the conclusion is still reasonable.
Consider the disappearing-cross method. The endpoint is reached when the sulfur suspension makes the cross impossible to see. That judgement is visual, rather than a precise chemical boundary.
A student who stops the timer slightly earlier records a shorter time and therefore calculates a larger value of \(1/t\). If different students judge the endpoint differently, their results may not be directly comparable.
A stronger evaluation identifies the limitation, its consequence, and a practical improvement:
The endpoint was judged visually, so differences in the amount of cloudiness required to obscure the cross could change the recorded time. This affects the precision of the relative-rate estimates. Using the same cross, viewing position, lighting, and endpoint criterion would improve comparability; a suitable light sensor could make the endpoint more objective.
This is much more useful than blaming human error. It identifies exactly where the measurement can change.
Weak vs strong practical evaluation
| Weak evaluation | “Human error affected accuracy.” No specific mechanism, consequence, or targeted improvement is identified. |
|---|---|
| Strong evaluation | Limitation: Visual cloudiness endpoints can shift recorded times, changing 1/t. Improvement: Standardise viewing conditions or use an objective light sensor. |
02A repeatable method for exam conditions
You do not need to invent a new response structure every time you see a practical question. Use the same decision process and adapt it to the command verb.
Step 1: Identify what the question wants.
- Describe asks for observations or features.
- Analyse asks you to identify patterns, compare results, or interpret data.
- Explain asks for the chemical model that accounts for the evidence.
- Evaluate asks you to judge the method or conclusion using evidence, limitations, and improvements.
A question can contain more than one command verb. Answer each part separately.
Step 2: Select the evidence.
Choose the measurements that best support your claim. Include units and identify the conditions being compared.
If you are comparing reaction rates, check that the relevant conditions were controlled. A difference in time is not automatically evidence that concentration caused the difference.
Step 3: State the pattern before explaining it.
Write what changed and what happened to the measured result.
For example:
Increasing the sodium thiosulfate concentration from \(0.040\ \mathrm{mol\,L^{-1}}\) to \(0.100\ \mathrm{mol\,L^{-1}}\) reduced the mean disappearance time from 45 s to 18 s.
This is evidence-based. You can now explain the pattern using collision theory.
Step 4: Build the chemical link.
Name the relevant chemical principle, then connect it to the measured outcome.
For reaction rate, this might involve concentration, collision frequency, temperature, or activation energy. For acid-base titration, it might involve neutralisation, stoichiometric ratios, and the distinction between an indicator endpoint and the equivalence point.
Do not add a chemical explanation that the data cannot reasonably support.
Step 5: Evaluate one meaningful limitation.
Use this sequence:
- Identify the specific limitation.
- Explain how it affects the measurement or comparison.
- State how that limits the conclusion.
- Suggest an improvement that addresses the problem.
An improvement should target the limitation you identified. Repeating an experiment will not necessarily remove a systematic bias, and using more precise equipment will not fix a design in which two variables change together.
Know the difference between accuracy, reliability, and validity
These terms are related, but they describe different things.
| Term | Meaning | Evidence you might use |
|---|---|---|
| Accuracy | How close a result is to the accepted or true value. | Comparison with a reliable reference value. |
| Reliability | Whether repeated measurements give similar results. | Agreement between repeated trials. |
| Validity | Whether the method tests the intended relationship fairly. | Appropriate controls and a design that isolates the independent variable. |
A set of very similar measurements can be reliable but inaccurate. A method can also produce repeatable results while failing to isolate the variable you intended to investigate.
Do not call a result accurate merely because repeated trials agree.
03Worked example: What do the reaction-rate results show?
Question: A student investigates the effect of sodium thiosulfate concentration on reaction rate using the disappearing-cross method. Explain the results using observations, numerical evidence, collision theory, and one specific limitation of the method.
The following is an illustrative dataset for practising the response structure, not a claim about measurements from a real experiment. In your own practical report, use your recorded results.
The reaction produces solid sulfur:
\[ \ce{Na2S2O3(aq) + 2HCl(aq) -> 2NaCl(aq) + SO2(g) + S(s) + H2O(l)} \]
As sulfur forms, the solution becomes cloudy. The student measures the time taken for the cross to disappear.
The concentrations below refer to the final reaction mixtures. Hydrochloric acid concentration, total volume, temperature, vessel, and viewing conditions are held constant.
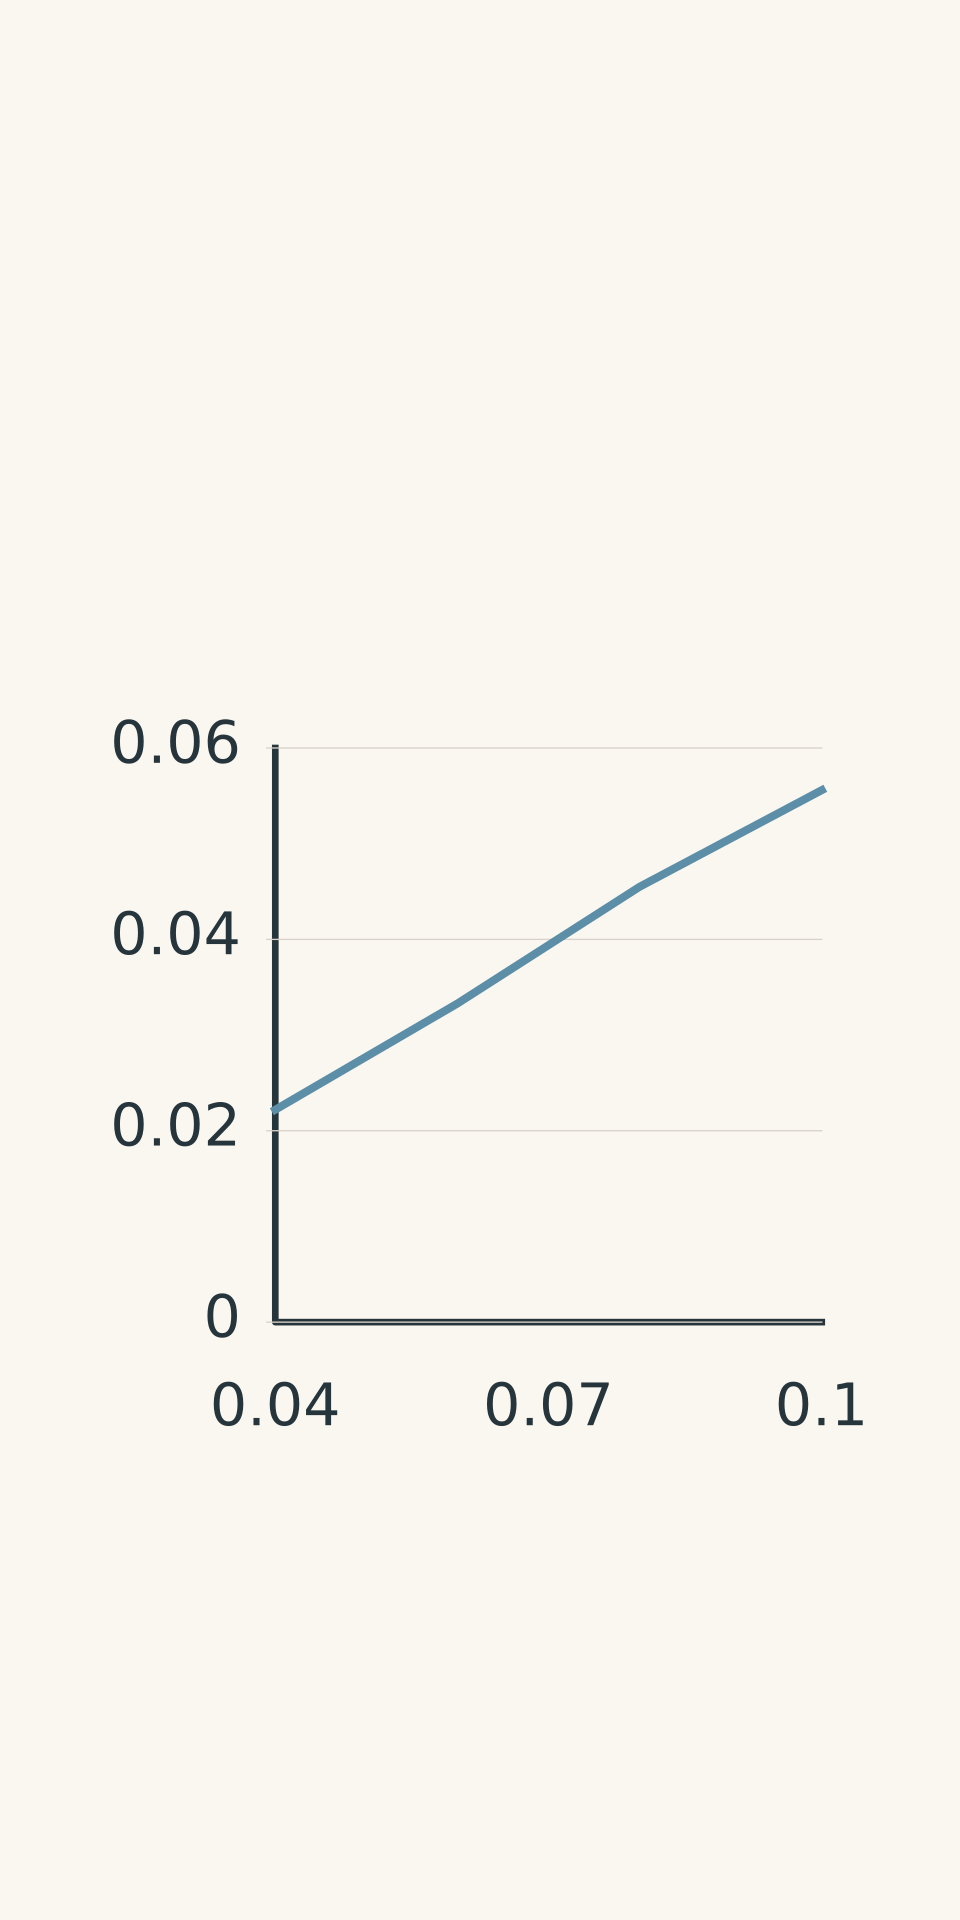
| \([\ce{Na2S2O3}]\) (\(\mathrm{mol\,L^{-1}}\)) | Trial times (s) | Mean time (s) | \(1/\bar t\) (\(\mathrm{s^{-1}}\)) |
|---|---|---|---|
| 0.040 | 46, 45, 44 | 45 | 0.0222 |
| 0.060 | 31, 30, 29 | 30 | 0.0333 |
| 0.080 | 23, 22, 21 | 22 | 0.0455 |
| 0.100 | 19, 18, 17 | 18 | 0.0556 |
Here, \(\bar t\) is the mean disappearance time in seconds. The quantity \(1/\bar t\), measured in \(\mathrm{s^{-1}}\), is a relative-rate indicator for this fixed-endpoint method. It is not a direct measurement of the reaction rate in \(\mathrm{mol\,L^{-1}\,s^{-1}}\).
Step 1State the observation
The solution became cloudy after hydrochloric acid was added, and the black cross eventually became invisible.
This describes what happened without assuming a cause.
Step 2Cite the numerical evidence
The mean disappearance time decreased from 45 s at \(0.040\ \mathrm{mol\,L^{-1}}\) to 18 s at \(0.100\ \mathrm{mol\,L^{-1}}\).
The relative-rate indicator increased from \(0.0222\ \mathrm{s^{-1}}\) to \(0.0556\ \mathrm{s^{-1}}\), an increase by a factor of approximately 2.5.
This establishes the trend in the recorded data. It does not, by itself, prove an exact rate law.
Step 3Explain the chemistry
The higher sodium thiosulfate concentration provides more thiosulfate ions per unit volume. At the same temperature, this increases the frequency of collisions between thiosulfate ions and hydrogen ions, leading to more successful collisions per second.
Sulfur therefore forms more quickly, causing the solution to become cloudy and obscure the cross sooner.
Step 4Evaluate the method
The endpoint depends on visually judging when the cross disappears. Differences in lighting, viewing position, or the amount of cloudiness judged sufficient to obscure the cross can shift the recorded time.
This affects the relative-rate estimates because \(1/\bar t\) is calculated directly from the measured time. For example, a 1 s timing difference represents about 5.6% of an 18 s measurement but only about 2.2% of a 45 s measurement.
The group could improve comparability by standardising the viewing conditions and endpoint criterion, repeating trials, and averaging the results. A suitable light sensor could further reduce subjectivity.
What a complete response could sound like
The solution became cloudy and the black cross eventually disappeared. As sodium thiosulfate concentration increased from \(0.040\ \mathrm{mol\,L^{-1}}\) to \(0.100\ \mathrm{mol\,L^{-1}}\), the mean disappearance time decreased from 45 s to 18 s, while the relative-rate indicator increased from \(0.0222\ \mathrm{s^{-1}}\) to \(0.0556\ \mathrm{s^{-1}}\). This is consistent with collision theory, as the higher concentration increases the frequency of effective collisions and the rate of sulfur formation. However, the visual endpoint is subjective, which can introduce variation into the measured times; standardising the viewing conditions and using repeated trials would improve comparability.
Notice the order. The response reports the evidence first, explains it second, and evaluates the method last.
- Illustrative results
04Worked example: What concentration does the titration support?
The same response structure applies to acid-base practicals. The difference is that your evidence may include a calculated concentration, and your evaluation must distinguish the measured endpoint from the chemical equivalence point.
Question: A student titrates a \(25.00\ \mathrm{mL}\) sample of hydrochloric acid with \(0.1000\ \mathrm{mol\,L^{-1}}\) sodium hydroxide. The three concordant titres are 24.65 mL, 24.70 mL, and 24.75 mL. Phenolphthalein is used, and the endpoint is the first pale pink colour that persists. Calculate the acid concentration and evaluate the claim that concordant titres prove accuracy.
Step 1Calculate the mean titre
The mean titre is
\[ \bar V =\frac{24.65+24.70+24.75}{3} =24.70\ \mathrm{mL} \]
Convert this volume to litres before using it in the concentration calculation:
\[ 24.70\ \mathrm{mL}=0.02470\ \mathrm{L} \]
Step 2Write the balanced equation
The neutralisation reaction is
\[ \ce{HCl(aq) + NaOH(aq) -> NaCl(aq) + H2O(l)} \]
The equation shows a 1:1 mole ratio between hydrochloric acid and sodium hydroxide.
Step 3Calculate the amount of sodium hydroxide
Using \(n=cV\), where \(n\) is amount in moles, \(c\) is concentration in \(\mathrm{mol\,L^{-1}}\), and \(V\) is volume in litres:
\[ \begin{aligned} n(\ce{NaOH}) &=cV\\ &=(0.1000)(0.02470)\\ &=0.002470\ \mathrm{mol} \end{aligned} \]
Step 4Calculate the acid concentration
The 1:1 mole ratio means the amount of hydrochloric acid neutralised is also \(0.002470\ \mathrm{mol}\).
The original acid sample has a volume of \(0.02500\ \mathrm{L}\), so
\[ \begin{aligned} c(\ce{HCl}) &=\frac{n}{V}\\ &=\frac{0.002470}{0.02500}\\ &=0.09880\ \mathrm{mol\,L^{-1}} \end{aligned} \]
The calculated acid concentration is therefore \(0.0988\ \mathrm{mol\,L^{-1}}\), to four significant figures.
Step 5Evaluate the claim about accuracy
The concordant titres indicate good agreement between repeated measurements, supporting the reliability or precision of the result. They do not establish accuracy.
The indicator endpoint is the observed colour change, whereas the equivalence point is the point at which the acid and base have reacted in their stoichiometric proportions. These points should be close, but they are not necessarily identical.
If the student adds excess sodium hydroxide before stopping, the recorded titre becomes too large. The calculated amount of sodium hydroxide, and therefore the calculated hydrochloric acid concentration, will also be too large.
The student should add sodium hydroxide dropwise near the endpoint, swirl consistently, and use the same endpoint criterion for every trial. The steep pH change in a strong-acid-strong-base titration makes a suitable indicator useful, but it does not make a visual endpoint exact.
A defensible conclusion would be:
The calculated hydrochloric acid concentration was \(0.0988\ \mathrm{mol\,L^{-1}}\). The close agreement between titres supports repeatability, but does not independently establish accuracy. A slight excess of sodium hydroxide at the indicator endpoint would increase the recorded titre and overestimate the acid concentration.
Equivalence point vs indicator endpoint
| Equivalence point | Stoichiometric condition: acid and base have reacted in the balanced-equation ratio. |
|---|---|
| Indicator endpoint | Observed colour change signals when to stop the titration. Expected to be close to, but not necessarily identical to, the equivalence point. |
05Wording changes that can break a memorised response
A memorised sentence is useful only if it fits the evidence. Watch for these common situations.
| Situation | Tempting mistake | Better response |
|---|---|---|
| The question asks you to describe observations. | Explain the cause immediately. | State what was seen or measured before discussing why it happened. |
| The results show a trend. | Claim the trend proves a precise relationship. | State the trend and how strongly the data support the claim. |
| One result differs from the others. | Delete it because it does not fit the expected pattern. | Investigate the anomaly and repeat the trial before deciding whether exclusion is justified. |
| Repeated measurements agree. | Claim the method was accurate. | State that agreement supports reliability, then consider possible systematic bias. |
| A method changes two variables together. | Attribute the result to just one variable. | Identify the confounding variable and explain why the effect cannot be isolated. |
| The experiment uses a visual endpoint. | Treat the endpoint as an exact chemical boundary. | Explain what determines the observed endpoint and how that affects the measurement. |
One distinction deserves particular attention: a trend can be consistent with a chemical model without proving that model is the only explanation.
For example, if \(1/t\) approximately doubles when concentration doubles, that supports an approximately proportional relationship under the tested conditions. It does not automatically establish an exact first-order rate law. You must also consider the validity of the method, the quality of the data, and whether the rate indicator is appropriate for the claim.
06Before you submit: the 20-second self-check
Read your response once and check the following:
- [ ] Observation: Have I stated what was directly seen or measured?
- [ ] Evidence: Have I cited the actual values, with units, and identified the pattern?
- [ ] Explanation: Have I connected the pattern to a relevant chemical principle?
- [ ] Evaluation: Have I identified a specific limitation, explained its effect, and suggested a targeted improvement?
- [ ] Strength of claim: Have I avoided claiming proof, accuracy, or a precise rate law when the evidence does not justify it?
If one part is missing, add that part rather than rewriting the whole response.
07Questions and solutions
Question 1
In a disappearing-cross experiment, the mean disappearance time is 40 s at a sodium thiosulfate concentration of \(0.050\ \mathrm{mol\,L^{-1}}\) and 20 s at \(0.100\ \mathrm{mol\,L^{-1}}\).
Calculate \(1/t\) for each result and state what the data support, assuming the other relevant conditions and the endpoint are controlled.
Solution 1
The relative-rate indicator doubles, increasing from \(0.0250\ \mathrm{s^{-1}}\) to \(0.0500\ \mathrm{s^{-1}}\). Under comparable conditions, the results support an approximately twofold increase in relative rate.
Using
\[ r_{\mathrm{rel}}=\frac{1}{t} \]
where \(t\) is the measured disappearance time:
At \(0.050\ \mathrm{mol\,L^{-1}}\),
\[ r_{\mathrm{rel}}=\frac{1}{40\ \mathrm{s}} =0.0250\ \mathrm{s^{-1}} \]
At \(0.100\ \mathrm{mol\,L^{-1}}\),
\[ r_{\mathrm{rel}}=\frac{1}{20\ \mathrm{s}} =0.0500\ \mathrm{s^{-1}} \]
The concentration doubled, and the relative-rate indicator doubled. This is consistent with an approximately proportional relationship over these conditions. It does not, by itself, prove an exact rate law because \(1/t\) is a proxy based on a visual endpoint rather than a direct measurement of initial rate.
Question 2
A student records a disappearance time of 45 s at \(0.040\ \mathrm{mol\,L^{-1}}\) and 23 s at \(0.080\ \mathrm{mol\,L^{-1}}\). They conclude:
Doubling the concentration exactly doubles the reaction rate, proving that the reaction is first order with respect to sodium thiosulfate.
Write a corrected conclusion using numerical evidence and collision theory. Identify what prevents the student’s claim from being fully justified.
Solution 2
The data are consistent with an approximately proportional relationship between concentration and the relative-rate indicator, but they do not establish an exact first-order rate law.
The indicators are
\[ \frac{1}{45\ \mathrm{s}}=0.0222\ \mathrm{s^{-1}} \]
and
\[ \frac{1}{23\ \mathrm{s}}=0.0435\ \mathrm{s^{-1}} \]
The ratio is approximately
\[ \frac{0.0435}{0.0222}\approx 1.96 \]
This is close to a doubling, but it is not exactly two. More importantly, only one measurement was taken at each concentration, so the student has little evidence about variation between trials.
Collision theory provides a plausible explanation: increasing sodium thiosulfate concentration increases the frequency of collisions between thiosulfate ions and hydrogen ions, increasing the number of successful collisions per second.
However, the visual endpoint method estimates relative rate rather than directly measuring initial rate. Repeated trials, controlled conditions, and a suitable method for comparing initial rates would provide stronger evidence for a rate-law claim. The student should write that the results are consistent with approximately first-order behaviour over the tested range, not that they prove it.
Question 3
At a sodium thiosulfate concentration of \(0.060\ \mathrm{mol\,L^{-1}}\), a student records three disappearance times: 29 s, 31 s, and 52 s.
They exclude the 52 s result because it does not fit the trend in the rest of their data, then report a mean of 30 s.
Is this exclusion justified? Calculate the mean using all three results and explain what the student should do next.
Solution 3
No. The 52 s result is noticeably different from the other two, but disagreement with an expected trend is not sufficient reason to discard a measurement.
The mean using all three recorded results is
\[ \begin{aligned} \bar t &=\frac{29+31+52}{3}\\ &=\frac{112}{3}\\ &=37.3\ \mathrm{s} \end{aligned} \]
The two closer measurements average 30 s, but that does not establish that the third result is invalid. The student should inspect the experimental record for a specific problem, such as a documented delay in starting the timer or an incorrect solution volume, and repeat the trial.
If a genuine procedural fault is identified, excluding the affected result may be justified, provided the reason is reported transparently. If no such fault is identified, the student should retain the measurement, investigate the variation, and avoid presenting the expected trend as more certain than the data allow.
This is an evaluation issue, not just a calculation issue. Data should test the chemical model; the model should not be used to erase inconvenient data.
Question 4
A \(25.00\ \mathrm{mL}\) sample of sulfuric acid is titrated with \(0.1000\ \mathrm{mol\,L^{-1}}\) sodium hydroxide. The concordant titres are 24.60 mL, 24.70 mL, and 24.80 mL.
Calculate the sulfuric acid concentration. Then assess the claim that the concordant titres prove the result is accurate. State the direction of the concentration error if the endpoint is overshot.
Solution 4
The calculated sulfuric acid concentration is \(0.0494\ \mathrm{mol\,L^{-1}}\). The concordant titres support repeatability, but they do not prove accuracy. Overshooting the endpoint would cause the calculated acid concentration to be too high.
The mean titre is
\[ \bar V=\frac{24.60+24.70+24.80}{3} =24.70\ \mathrm{mL} \]
Convert the volume to litres:
\[ V(\ce{NaOH})=0.02470\ \mathrm{L} \]
The balanced equation is
\[ \ce{H2SO4 + 2NaOH -> Na2SO4 + 2H2O} \]
The mole ratio is 1:2, so two moles of sodium hydroxide react with each mole of sulfuric acid.
First, calculate the amount of sodium hydroxide:
\[ \begin{aligned} n(\ce{NaOH}) &=cV\\ &=(0.1000)(0.02470)\\ &=0.002470\ \mathrm{mol} \end{aligned} \]
Then calculate the amount of sulfuric acid:
\[ n(\ce{H2SO4}) =\frac{0.002470}{2} =0.001235\ \mathrm{mol} \]
Finally, calculate the acid concentration:
\[ \begin{aligned} c(\ce{H2SO4}) &=\frac{0.001235}{0.02500}\\ &=0.04940\ \mathrm{mol\,L^{-1}} \end{aligned} \]
To four significant figures, the concentration is \(0.0494\ \mathrm{mol\,L^{-1}}\).
The agreement between the titres shows that the repeated measurements are consistent. It does not rule out a systematic endpoint bias. If excess sodium hydroxide is added, the measured titre is too large, so the calculated amount of sulfuric acid is overestimated. A more accurate endpoint judgement and comparison with an appropriate reference would provide stronger evidence of accuracy.
Question 5
A group investigates the disappearing-cross reaction under the following conditions:
| Trial condition | Final sodium thiosulfate concentration | Total reaction volume | Mean disappearance time |
|---|---|---|---|
| A | \(0.040\ \mathrm{mol\,L^{-1}}\) | 20.0 mL | 24.0 s |
| B | \(0.080\ \mathrm{mol\,L^{-1}}\) | 40.0 mL | 12.0 s |
The final hydrogen ion concentration and temperature are the same in both conditions. The same vessel and cross are used, so the liquid layer is deeper in condition B.
The student calculates \(1/t\) for each trial, observes that it doubles, and concludes that the reaction is first order with respect to sodium thiosulfate.
Evaluate the conclusion. Explain why the result has more than one plausible cause, distinguish the measured endpoint from the chemical rate, and propose a follow-up experiment that separates the competing effects.
Solution 5
The data do not establish first-order dependence on sodium thiosulfate. They show that the combined change in concentration and reaction volume was associated with a halving of the disappearance time, but the two effects cannot be separated from these results alone.
The calculated indicators are
\[ \begin{aligned} r_{\mathrm{rel,A}} &=\frac{1}{24.0\ \mathrm{s}}\\ &=0.0417\ \mathrm{s^{-1}} \end{aligned} \]
and
\[ \begin{aligned} r_{\mathrm{rel,B}} &=\frac{1}{12.0\ \mathrm{s}}\\ &=0.0833\ \mathrm{s^{-1}} \end{aligned} \]
The indicator has doubled, and the sodium thiosulfate concentration has doubled. At first glance, this looks like evidence for a first-order relationship. The problem is that the liquid depth also changed.
There are two relevant effects.
First, concentration can affect the chemical rate. Increasing the sodium thiosulfate concentration increases the frequency of collisions between thiosulfate ions and hydrogen ions. If the other relevant conditions are controlled, this can increase the rate of sulfur formation per unit volume.
Second, the visual endpoint depends on liquid depth. A deeper layer of cloudy solution gives light a longer path through the suspension. The cross can therefore become obscured at a different sulfur concentration, even if the chemical rate per unit volume has not changed. The measured disappearance time no longer represents the same endpoint under both conditions.
This is the critical problem: \(1/t\) is a relative-rate indicator only when the endpoint and relevant measurement conditions are comparable. Doubling \(1/t\) does not automatically mean that the true reaction rate doubled, and it does not establish the reaction order.
The smallest useful follow-up is to separate concentration from depth. Complete a set of comparisons at two concentrations and two total volumes:
- \(0.040\ \mathrm{mol\,L^{-1}}\) at 20.0 mL;
- \(0.080\ \mathrm{mol\,L^{-1}}\) at 20.0 mL;
- \(0.040\ \mathrm{mol\,L^{-1}}\) at 40.0 mL;
- \(0.080\ \mathrm{mol\,L^{-1}}\) at 40.0 mL.
Repeat each condition while keeping the final hydrogen ion concentration and temperature controlled. Use the same vessel and viewing conditions. Comparing the two concentrations at the same volume isolates the concentration effect more fairly; comparing the two volumes at the same concentration reveals how much the endpoint is affected by liquid depth.
For a stronger claim about reaction order, the group should use a suitable rate-measurement method, examine several concentrations, and account for variation between trials.
The lesson is broader than this one practical: before explaining a trend, check that the experiment actually isolates the variable you want to investigate. That is the next decision in any sound practical investigation-designing a valid comparison before drawing a chemical conclusion.