
Displacement-Time vs Displacement-Position Graphs in HSC Physics
Learn how to distinguish displacement-time and displacement-position wave graphs, read period and wavelength correctly, and avoid common graph interpretation errors.
A wave passes a point on a rope. You record the rope’s displacement and draw a smooth sinusoidal graph. The horizontal axis says either time or position.
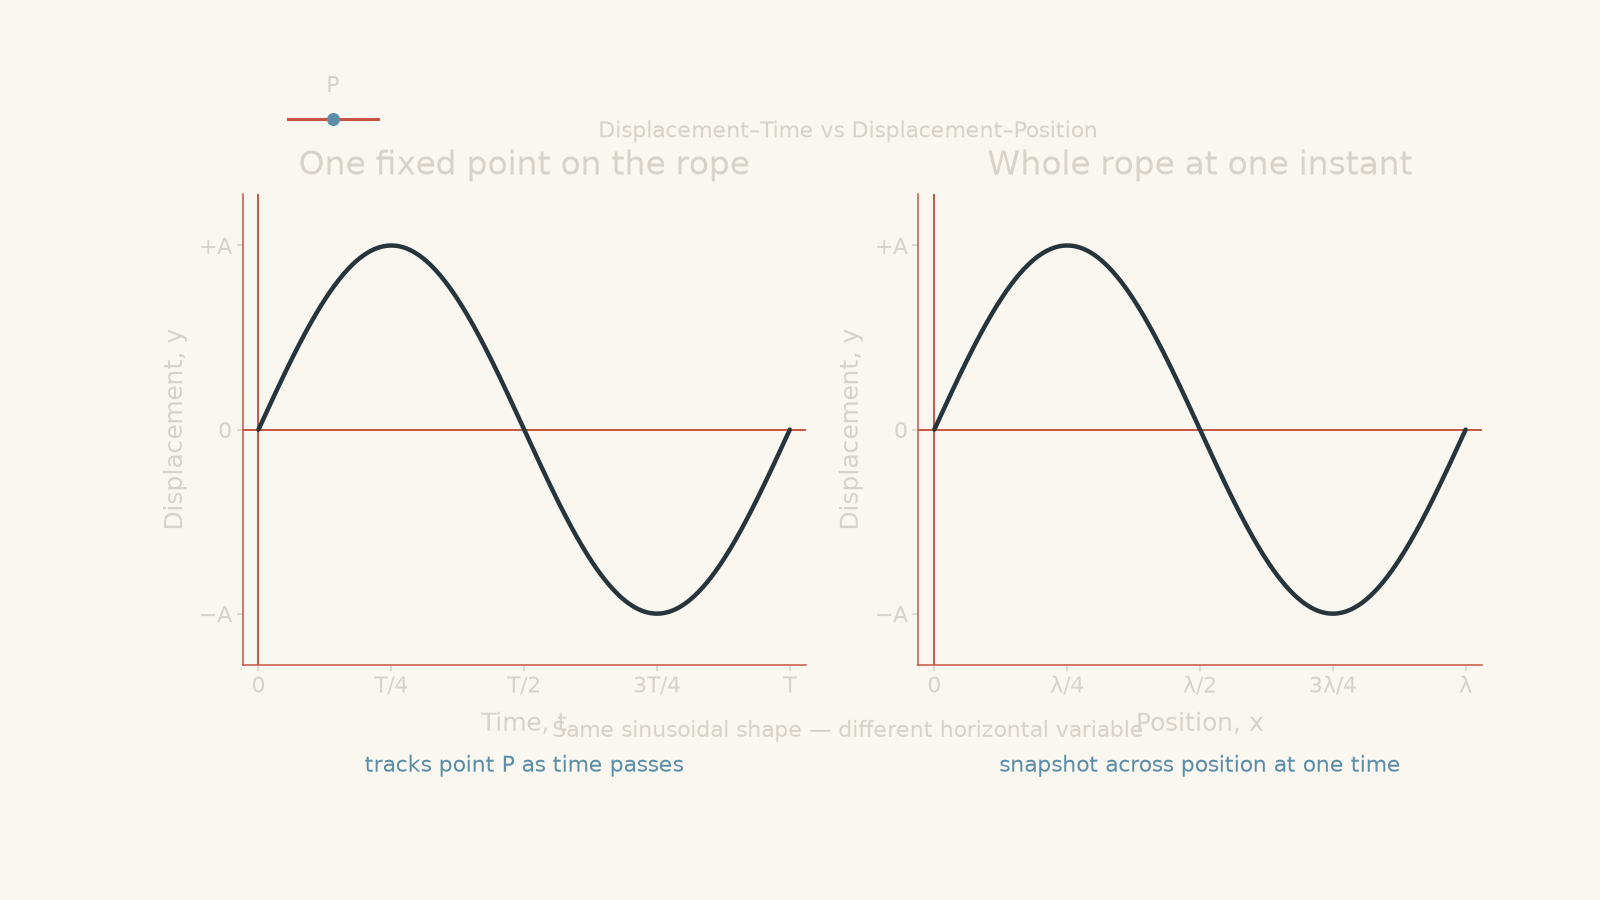
Those two graphs can look almost identical.
That is exactly why they cause trouble.
Before reading on, predict this: if two neighbouring crests are 0.80 units apart on the horizontal axis, have you measured the wavelength?
Only if that horizontal axis is position. If it is time, you have measured the period instead. The shape of the curve is not enough. You must ask what moving left to right along the graph actually means.
01The one question that separates the two graphs
When you move from left to right along a wave graph, ask:
Am I looking at one place at different times, or different places at one time?
That gives the distinction:
| Graph | Horizontal axis | What stays fixed? | Main quantity from horizontal spacing |
|---|---|---|---|
| Displacement-time | Time, \(t\), usually in seconds | Position | Period, \(T\) |
| Displacement-position | Position, \(x\), usually in metres | Time | Wavelength, \(\lambda\) |
Both graphs have displacement on the vertical axis. The displacement tells you how far a particle of the medium is from its equilibrium position.
For a transverse wave on a rope, that could mean how far the rope is above or below its resting position.
The horizontal axis is what changes the meaning of the graph.
02Displacement-time graphs follow one particle
Imagine painting a tiny white dot on a rope at \(x = 2.0\text{ m}\). A wave travels along the rope, but you keep your camera pointed at that one dot.
At \(t=0\), the dot might be at equilibrium. A little later it moves upwards, reaches a maximum displacement, returns through equilibrium, moves downwards, and comes back again.
A displacement-time graph records that motion.
You are asking:
How does the displacement of this one point change as time passes?
The horizontal coordinate is therefore \(t\), measured in seconds.
What can you measure from a displacement-time graph?
The most important measurements are:
- amplitude, \(A\), from the vertical axis
- period, \(T\), from the horizontal axis
- frequency, \(f\), calculated from the period
- the displacement of the particle at a particular time
- the particle’s velocity from the gradient of the graph
The amplitude is the maximum magnitude of displacement from equilibrium. If a graph reaches \(+0.040\text{ m}\) and \(-0.040\text{ m}\), then \(A=0.040\text{ m}\), not \(0.080\text{ m}\).
The period, \(T\), is the time for one complete cycle.
You can measure it between any two equivalent points in consecutive cycles, such as:
- crest to next crest
- trough to next trough
- an upward equilibrium crossing to the next upward equilibrium crossing
Once you know \(T\), the frequency is
\[
f=\frac{1}{T}
\]
where:
- \(f\) is frequency in hertz, \(\text{Hz}\)
- \(T\) is period in seconds, \(\text{s}\)
Frequency tells you how many complete oscillations occur each second.
Worked example: Reading period and frequency
A point on a vibrating string has amplitude \(2.5\text{ cm}\). On its displacement-time graph, successive crests occur at \(t=0.15\text{ s}\) and \(t=0.55\text{ s}\). Find the period and frequency.
Step 1
\[
T=0.55-0.15=0.40\text{ s}
\]
Step 2
\[
f=\frac{1}{0.40}=2.5\text{ Hz}
\]
Step 3
The point completes one full oscillation every \(0.40\text{ s}\), so it completes \(2.5\) oscillations each second. Its amplitude is \(2.5\text{ cm}\).
Notice what we cannot find from this graph alone: the wavelength. We have watched one position over time, so there is no horizontal information about distances along the string.
03Displacement-position graphs are snapshots
Now change the experiment.
Instead of watching one painted dot for several seconds, take a photograph of the entire rope at one instant.
The image might show some particles above equilibrium, some below it, and some exactly at equilibrium.
A displacement-position graph represents that snapshot.
You are asking:
How does displacement vary from one position to another at this particular instant?
The horizontal coordinate is therefore position \(x\), measured in metres.
This graph is sometimes easy to misread because it can literally resemble the shape of a transverse wave on a rope. For a transverse rope wave, that picture is useful.
But the graph is still a graph of displacement against position, not a record of a particle travelling along a wavy path.
What can you measure from a displacement-position graph?
You can determine:
- amplitude, \(A\), from the vertical axis
- wavelength, \(\lambda\), from the horizontal axis
- displacement at a particular position
- relative phase of particles at different positions
- the spatial gradient of the wave at a particular position
The wavelength, \(\lambda\), is the shortest distance between two points in the same phase of the wave.
For a sinusoidal wave, convenient choices include:
- crest to next crest
- trough to next trough
- one upward equilibrium crossing to the next upward equilibrium crossing
Its SI unit is the metre, \(\text{m}\).
Half a cycle is not one wavelength
Suppose a crest is at \(x=1.2\text{ m}\) and the neighbouring trough is at \(x=1.7\text{ m}\).
It is tempting to say the wavelength is \(0.5\text{ m}\).
But a crest and neighbouring trough are only half a cycle apart.
Therefore,
\[
\frac{\lambda}{2}=1.7-1.2=0.5\text{ m}
\]
so
\[
\lambda=1.0\text{ m}
\]
This is why measuring between equivalent points is usually safer.
Worked example: Finding wavelength and wave speed
A displacement-position graph of a travelling wave shows consecutive crests at \(x=0.60\text{ m}\) and \(x=2.10\text{ m}\). A displacement-time graph for a point on the same wave shows a period of \(0.30\text{ s}\). Find the wavelength, frequency, and wave speed.
Step 1
The distance from one crest to the next is one wavelength:
\[
\lambda=2.10-0.60=1.50\text{ m}
\]
Step 2
\[
f=\frac{1}{T}
=\frac{1}{0.30}
=3.33\text{ Hz}
\]
Step 3
For a periodic wave,
\[
v=f\lambda
\]
where:
- \(v\) is wave speed in \(\text{m s}^{-1}\)
- \(f\) is frequency in \(\text{Hz}\)
- \(\lambda\) is wavelength in \(\text{m}\)
Substituting,
\[
v=(3.33)(1.50)=5.0\text{ m s}^{-1}
\]
Step 4
The wave pattern travels along the medium at \(5.0\text{ m s}^{-1}\). The particles themselves do not travel along the rope at \(5.0\text{ m s}^{-1}\). They oscillate about their equilibrium positions while the disturbance propagates.
That last distinction is one of the most important ideas in wave physics.
04Period and wavelength are related, but they are not the same thing
A sinusoidal displacement-time graph and a sinusoidal displacement-position graph might have exactly the same visual shape.
On the time graph, one complete horizontal cycle represents \(T\).
On the position graph, one complete horizontal cycle represents \(\lambda\).
You can picture the difference with a slightly ridiculous analogy.
Imagine a row of people doing a stadium wave.
A displacement-position graph is like taking one photo of the whole row. You can see who is sitting, who is standing, and how far apart repeating parts of the pattern are.
A displacement-time graph is like filming just one person. You see how their height changes with time, but you cannot see the spacing between people elsewhere in the row.
The analogy breaks because particles in an ideal sinusoidal wave move continuously rather than choosing to stand up, and real waves can involve several kinds of particle motion. But the distinction between a snapshot across space and a history at one place is exactly the useful part.
05The graph’s gradient means different things too
The horizontal axis changes not only what you measure between peaks, but also what the slope means.
Slope of a displacement-time graph
If displacement is \(y\), the gradient is
\[
\frac{\Delta y}{\Delta t}
\]
and, in the limit of a very small time interval,
\[
\frac{dy}{dt}
\]
This is the velocity of the particle in the displacement direction.
For example, on a transverse rope:
- positive slope means the particle is moving upwards
- negative slope means it is moving downwards
- zero slope at a maximum or minimum displacement means the particle is instantaneously at rest
This is particle velocity, not wave speed.
That distinction matters.
A wave could travel rapidly to the right while an individual piece of rope is moving slowly upwards at that instant.
Slope of a displacement-position graph
Now the gradient is
\[
\frac{\Delta y}{\Delta x}
\]
or, more precisely,
\[
\frac{\partial y}{\partial x}
\]
It describes how rapidly displacement changes from one position to the next at that instant.
It is a spatial gradient. It is not automatically the velocity of either the wave or the particle.
So a steep displacement-position graph does not mean “the wave is moving fast”. The graph contains no time interval from which a speed could be obtained directly.
06A useful decision rule
When you see a wave graph in an HSC Physics problem, do not start by measuring the distance between peaks.
First read the axes.
Then use this rule:
| If the horizontal axis is… | One complete cycle gives… | You can then calculate… |
|---|---|---|
| time \(t\) | period \(T\) | \(f=1/T\) |
| position \(x\) | wavelength \(\lambda\) | wave speed if \(f\) or \(T\) is also known |
Amplitude can be read from either type because displacement is on the vertical axis in both.
For wave speed,
\[
v=f\lambda=\frac{\lambda}{T}
\]
You need both a spatial scale and a time scale. A single displacement-position graph gives the spatial scale. A single displacement-time graph gives the time scale.
07The most tempting misconception: “the wave travels along the curve”
Suppose a displacement-position graph has a crest at \(x=3.0\text{ m}\).
A student might imagine that a particle of the rope started somewhere to the left, travelled upwards along the curve, reached the crest, and will later continue down the other side.
That interpretation feels natural because the graph looks like a path.
But the horizontal coordinate is position in the medium, not the horizontal position of one moving particle through its journey.
At one instant:
- the point at \(x=2.9\text{ m}\) has one displacement
- the point at \(x=3.0\text{ m}\) has another
- the point at \(x=3.1\text{ m}\) has another
They are different particles.
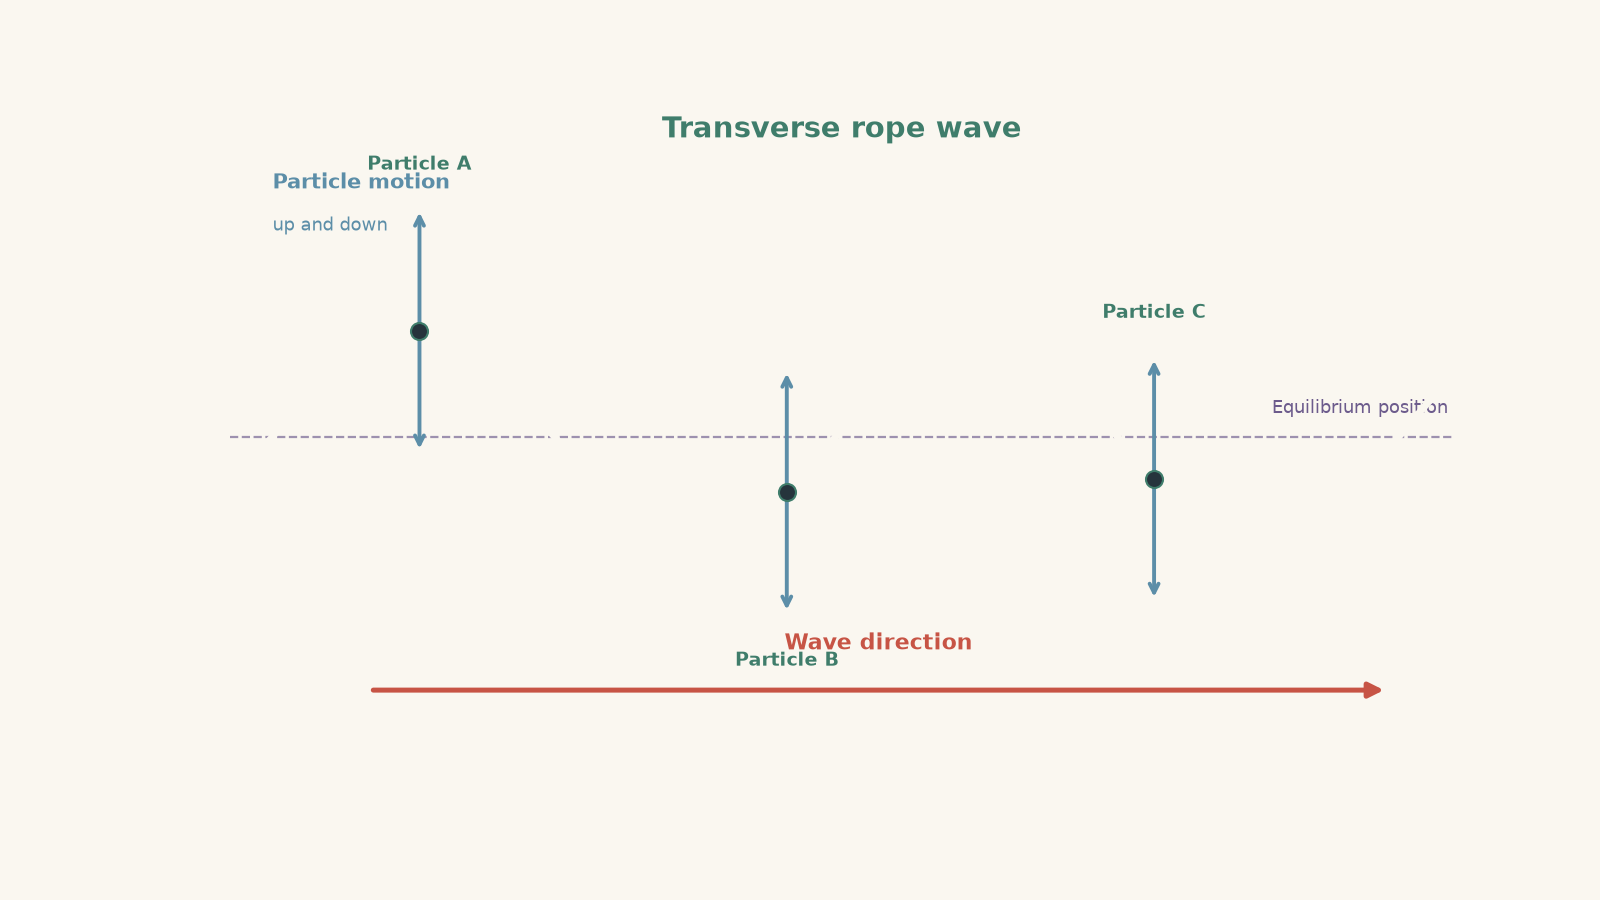
For a transverse wave, each of those particles moves mainly perpendicular to the direction in which the wave travels. The wave pattern moves through the medium, but matter does not simply follow the wave-shaped curve.
08Phase gives a more precise way to compare points
Two points are in phase when they are at the same stage of their oscillation.
For a sinusoidal travelling wave, particles separated by one wavelength are in phase. So are particles separated by any whole-number multiple of the wavelength.
Particles separated by half a wavelength are \(180^\circ\) out of phase.
That means a displacement-position graph can tell you more than just wavelength. It can help you compare the state of oscillation of particles at different positions.
For example, if two points are separated by
\[
\frac{\lambda}{4}
\]
their phase difference is
\[
\frac{1}{4}\times360^\circ=90^\circ
\]
The same logic works on a displacement-time graph. Two moments separated by one period correspond to the same phase of the oscillation.
This parallel is worth remembering:
\[
\text{one wavelength in space} \longleftrightarrow \text{one period in time}
\]
Both represent one complete cycle, but along different horizontal variables.
09Questions and solutions
Question 1
A displacement-time graph for one point on a string has successive troughs at \(t=0.20\text{ s}\) and \(t=0.70\text{ s}\). The amplitude is \(4.0\text{ cm}\).
Find the period and frequency. Can the wavelength be determined from this graph alone?
Solution 1
The period is \(0.50\text{ s}\), the frequency is \(2.0\text{ Hz}\), and the wavelength cannot be determined from this graph alone.
Successive troughs represent equivalent points one complete cycle apart, so
\[
T=0.70-0.20=0.50\text{ s}
\]
Then
\[
f=\frac{1}{T}
=\frac{1}{0.50}
=2.0\text{ Hz}
\]
The amplitude is \(4.0\text{ cm}\), but this does not help us find wavelength. The horizontal axis is time, so the graph provides no measurement of distance along the string.
The common trap is to treat the horizontal spacing of \(0.50\) as a wavelength. Its unit is seconds, not metres, so it represents a period.
Question 2
A displacement-position graph shows a crest at \(x=1.4\text{ m}\) and the neighbouring trough at \(x=2.0\text{ m}\).
Determine the wavelength.
Solution 2
The wavelength is \(1.2\text{ m}\).
A neighbouring crest and trough are half a wavelength apart, so
\[
\frac{\lambda}{2}=2.0-1.4=0.60\text{ m}
\]
Therefore,
\[
\lambda=2(0.60)=1.2\text{ m}
\]
The tempting error is to report \(0.60\text{ m}\) as the wavelength. That distance covers only half a cycle, from a maximum positive displacement to a maximum negative displacement.
Question 3
A travelling wave has wavelength \(0.80\text{ m}\). At one fixed point, successive upward crossings of equilibrium occur \(0.25\text{ s}\) apart.
Find the wave’s frequency and speed.
Solution 3
The frequency is \(4.0\text{ Hz}\), and the wave speed is \(3.2\text{ m s}^{-1}\).
Successive upward equilibrium crossings occur one full period apart, so
\[
T=0.25\text{ s}
\]
The frequency is
\[
f=\frac{1}{T}
=\frac{1}{0.25}
=4.0\text{ Hz}
\]
Using \(v=f\lambda\),
\[
v=(4.0)(0.80)
=3.2\text{ m s}^{-1}
\]
The result means the wave pattern advances \(3.2\text{ m}\) along the medium each second.
It does not mean that an individual particle of the medium travels \(3.2\text{ m}\) along the direction of propagation each second.
Question 4
Two graphs are drawn with the same sinusoidal shape and the same numerical horizontal spacing of \(0.40\) between consecutive crests.
Graph A has horizontal axis \(t\) in seconds. Graph B has horizontal axis \(x\) in metres.
A student says, “Both graphs show a wavelength of \(0.40\), because wavelength is the distance between crests.”
Explain exactly what is wrong with the student’s reasoning, and state what the value \(0.40\) represents on each graph.
Solution 4
Graph A shows a period of \(0.40\text{ s}\), while Graph B shows a wavelength of \(0.40\text{ m}\).
The student’s statement “wavelength is the distance between crests” is incomplete. Wavelength is the spatial separation between successive points in the same phase. That requires position or distance on the horizontal axis.
For Graph A,
\[
T=0.40\text{ s}
\]
because moving horizontally means moving forward in time while observing one fixed position.
For Graph B,
\[
\lambda=0.40\text{ m}
\]
because moving horizontally means moving from one position in the medium to another at the same instant.
The graphs can have identical shapes without representing the same physical measurement. Axis labels, variables, and units determine the meaning.
Question 5
At a certain instant, a displacement-position graph for a transverse travelling wave crosses equilibrium at \(x=1.0\text{ m}\) with a steep positive slope.
A student claims, “The particle at \(x=1.0\text{ m}\) must be moving upwards quickly because the graph is steep.”
Is that conclusion justified from the displacement-position graph alone? Explain.
Solution 5
No. A steep positive slope on a displacement-position graph does not, by itself, tell us that the particle is moving upwards quickly.
The graph’s gradient is
\[
\frac{\partial y}{\partial x}
\]
which describes how displacement changes with position at that instant. It is a spatial gradient.
The particle’s vertical velocity instead depends on how its displacement changes with time:
\[
\frac{\partial y}{\partial t}
\]
A displacement-position graph alone does not directly provide that time rate of change.
For a particular known travelling wave, the spatial gradient and particle velocity can be mathematically related using additional information such as the wave’s propagation direction and speed. But that information is not contained in the stated graph alone.
The trap is treating every steep graph as “fast motion”. A graph’s slope only has meaning after you identify the quantities on both axes.
Question 6
A sinusoidal wave travels along a string. A displacement-position snapshot shows a wavelength of \(1.5\text{ m}\). A separate displacement-time graph for one point on the string shows that the point moves from a maximum positive displacement to the next maximum negative displacement in \(0.20\text{ s}\).
A student calculates the wave speed as
\[
v=\frac{1.5}{0.20}=7.5\text{ m s}^{-1}
\]
Identify the hidden error and determine the correct wave speed.
Solution 6
The correct wave speed is \(3.75\text{ m s}^{-1}\). The hidden error is treating the time from a crest to the next trough as one full period.
A particle moving from maximum positive displacement to the next maximum negative displacement completes only half an oscillation. Therefore,
\[
\frac{T}{2}=0.20\text{ s}
\]
so
\[
T=0.40\text{ s}
\]
The wavelength is
\[
\lambda=1.5\text{ m}
\]
Using
\[
v=\frac{\lambda}{T}
\]
gives
\[
v=\frac{1.5}{0.40}
=3.75\text{ m s}^{-1}
\]
The student’s arithmetic was fine. The physics interpretation was not. Before substituting into a wave equation, you have to decide whether the measured interval represents a whole cycle, half a cycle, or some other fraction.
10What this distinction lets you do next
Once you can read the two graph types correctly, the wave equation becomes much more meaningful.
A displacement-time graph supplies the time scale of the oscillation through \(T\) or \(f\). A displacement-position graph supplies the spatial scale through \(\lambda\). Combining them gives the propagation speed:
\[
v=f\lambda=\frac{\lambda}{T}
\]
That same separation between what happens at one position over time and what exists across many positions at one instant is also the foundation for understanding phase differences, travelling waves, standing waves, and interference.