
Force, Motion and Graph Representations for HSC Physics
Learn how to translate between force descriptions, vector diagrams, and displacement, velocity, and acceleration graphs using Newton's laws.
A car is travelling to the right, but the net force on it points to the left. Which way is the car moving one second later?
A tempting answer is “left”, because force arrows feel like motion arrows. But that is not what a force tells you. The car can still be moving right while slowing down.
This is the central translation skill you need: force tells you about acceleration, acceleration changes velocity, and velocity changes position. Once you can move confidently between those ideas, force descriptions, vector diagrams, and motion graphs stop looking like three separate topics.
01The chain that connects force to motion
Imagine pushing a shopping trolley along a straight aisle.
If your forward push is exactly balanced by friction and other resistive forces, the forces cancel. The trolley has no acceleration. If it is already moving, it can continue at constant velocity.
Now push harder so the forward force is greater than the resistive forces. The trolley accelerates forward. Its velocity changes in the forward direction.
The useful chain is:
\[
\text{net force} \rightarrow \text{acceleration} \rightarrow \text{change in velocity} \rightarrow \text{change in position}
\]
Each arrow represents a different idea. Skipping one is where many graph mistakes begin.
Predict before going further
Suppose a ball is travelling east while experiencing a net force west.
What happens immediately?
It does not suddenly travel west. The westward force gives it a westward acceleration, so its eastward velocity decreases. If that force continues for long enough, the ball may stop and then begin moving west.
That distinction between velocity and acceleration is the key to almost everything in this guide.
02Step 1: turn the situation into a force diagram
Before thinking about a motion graph, identify the forces acting on the object.
A force is a vector, so it has both magnitude and direction. In a force diagram, each arrow represents one force acting on the chosen object.
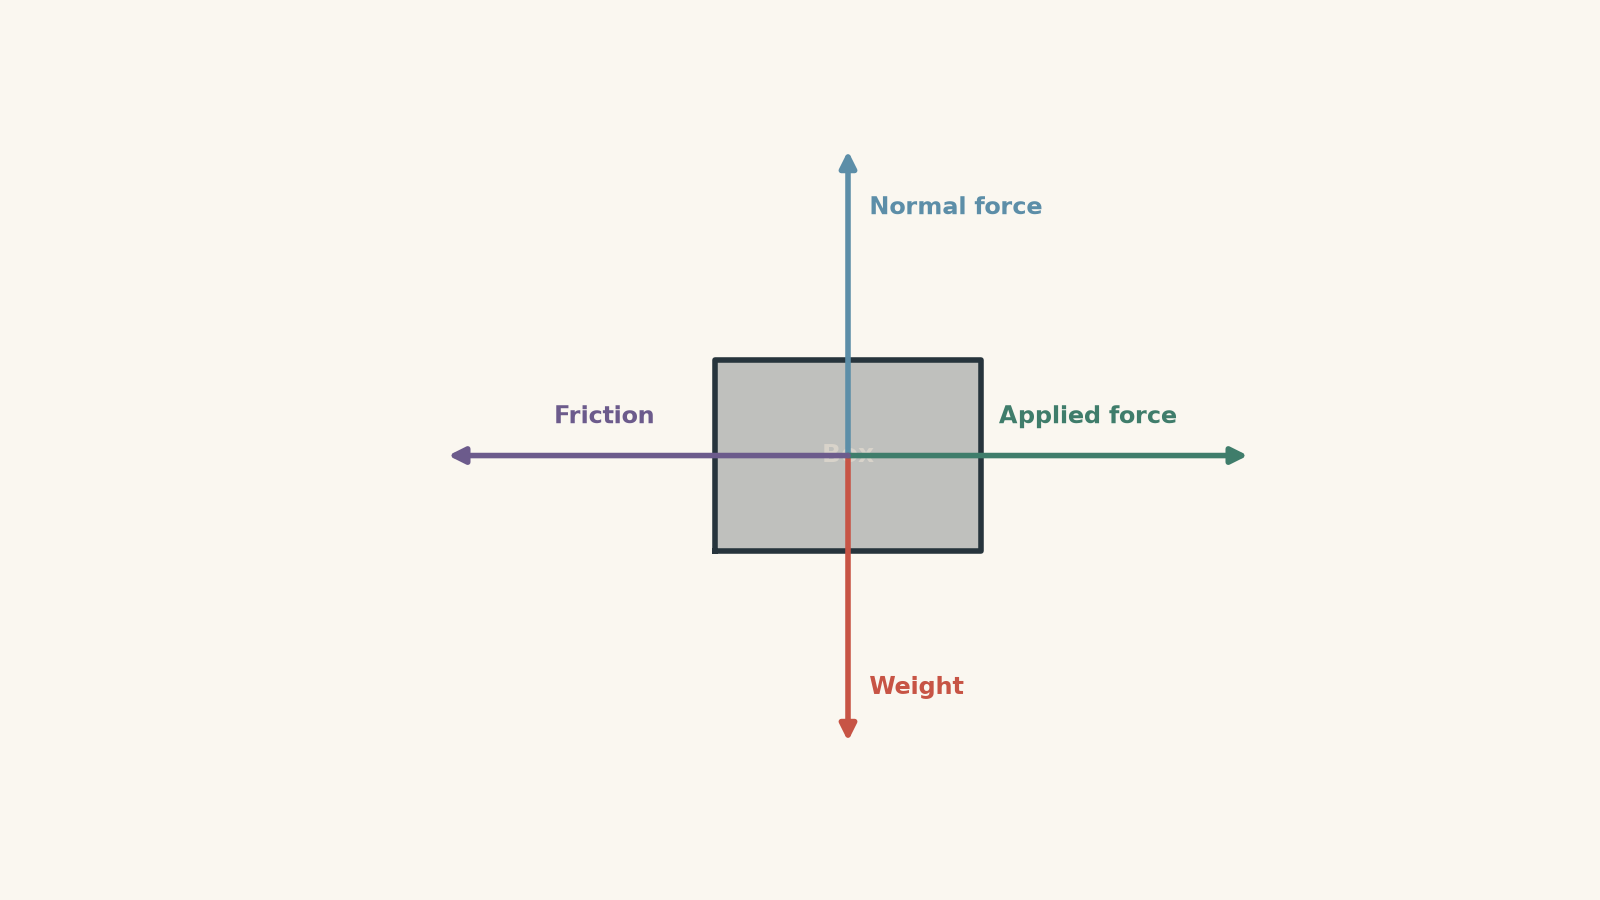
For a box being pushed horizontally across a floor, you might have:
- weight acting downward
- normal force from the floor acting upward
- an applied force acting to the right
- friction acting to the left
The first question is not “Which arrow is biggest?”
It is:
What is the vector sum of all the forces?
That vector sum is the net force, sometimes called the resultant force.
Newton’s second law connects net force to acceleration:
\[
\vec F_{\text{net}} = m\vec a
\]
where:
- \(\vec F_{\text{net}}\) is the net force in newtons (N)
- \(m\) is the mass in kilograms (kg)
- \(\vec a\) is the acceleration in metres per second squared (\(\text{m s}^{-2}\))
Because mass is a positive scalar quantity, the acceleration points in the same direction as the net force.
That gives us our first reliable translation rule:
The direction of the net force is the direction of the acceleration, not necessarily the direction of the velocity.
03Choosing a positive direction
For one-dimensional problems, choose one direction as positive.
For example, take right as positive. Then:
- rightward forces are positive
- leftward forces are negative
- rightward velocity is positive
- leftward velocity is negative
- rightward acceleration is positive
- leftward acceleration is negative
The physics does not care which direction you choose as positive. Your signs simply need to stay consistent.
If a \(12\text{ N}\) force acts right and an \(8\text{ N}\) force acts left, then:
\[
F_{\text{net}} = 12 – 8 = 4\text{ N}
\]
The net force is \(4\text{ N}\) to the right.
If the object’s mass is \(2.0\text{ kg}\),
\[
a = \frac{F_{\text{net}}}{m}
= \frac{4}{2.0}
= 2.0\text{ m s}^{-2}
\]
So its acceleration is \(2.0\text{ m s}^{-2}\) to the right.
We still have not said which way it is moving. We do not yet know.
04Step 2: turn acceleration into a velocity graph
Acceleration tells you how velocity changes with time.
For constant acceleration,
\[
a = \frac{\Delta v}{\Delta t}
\]
where:
- \(a\) is acceleration in \(\text{m s}^{-2}\)
- \(\Delta v\) is the change in velocity in \(\text{m s}^{-1}\)
- \(\Delta t\) is the change in time in seconds (s)
On a velocity-time graph, acceleration is the gradient.
\[
a = \frac{\Delta v}{\Delta t}
\]
So:
| Net force | Acceleration | Shape of velocity-time graph |
|---|---|---|
| constant positive | constant positive | straight line sloping upward |
| zero | zero | horizontal line |
| constant negative | constant negative | straight line sloping downward |
| changing | changing | gradient changes |
Notice what is missing from that table: the sign of the velocity itself.
A negatively sloped velocity-time graph can lie completely above the time axis. That means the object is travelling in the positive direction while slowing down.
This is one of the most common HSC traps.
Force direction and motion direction are not the same thing
Think of velocity and acceleration like your current relationship status and the direction the relationship is heading.
Velocity tells you where things are right now. Acceleration tells you how that situation is changing.
A negative acceleration does not automatically mean a negative velocity, just as “this date is going badly” does not mean you have somehow travelled backwards in time.
The analogy breaks because acceleration is a precisely defined vector quantity, while dating is, scientifically speaking, an appalling measurement system.
05Worked example: a trolley speeds up
A \(5.0\text{ kg}\) trolley moves to the right at \(2.0\text{ m s}^{-1}\). A \(15\text{ N}\) force acts to the right while a \(5.0\text{ N}\) resistive force acts to the left. Both forces remain constant for \(3.0\text{ s}\). Find the trolley’s acceleration and final velocity.
Step 1
\[
F_{\text{net}} = 15 – 5.0 = 10\text{ N}
\]
The net force is \(10\text{ N}\) to the right.
Step 2
\[
a = \frac{F_{\text{net}}}{m}
= \frac{10}{5.0}
= 2.0\text{ m s}^{-2}
\]
The acceleration is \(2.0\text{ m s}^{-2}\) to the right.
Step 3
For constant acceleration,
\[
v = u + at
\]
where \(u\) is initial velocity, \(v\) is final velocity, \(a\) is acceleration, and \(t\) is time.
Substituting,
\[
v = 2.0 + (2.0)(3.0)
= 8.0\text{ m s}^{-1}
\]
The trolley finishes with a velocity of \(8.0\text{ m s}^{-1}\) to the right.
Its velocity-time graph would begin at \(+2.0\text{ m s}^{-1}\) and rise as a straight line to \(+8.0\text{ m s}^{-1}\). The positive gradient represents the constant positive acceleration.
06Step 3: turn velocity into a position graph
Velocity tells you how quickly position is changing.
For motion along one dimension,
\[
v = \frac{\Delta x}{\Delta t}
\]
where \(v\) is velocity and \(\Delta x\) is displacement.
That means the gradient of a displacement-time graph represents velocity.
This creates another translation:
\[
\text{gradient of displacement-time graph} = \text{velocity}
\]
So:
- positive gradient means positive velocity
- zero gradient means the object is instantaneously stationary
- negative gradient means negative velocity
- increasing gradient means velocity is becoming more positive
- decreasing gradient means velocity is becoming more negative
What does acceleration look like on a displacement-time graph?
Acceleration does not equal the gradient of a displacement-time graph. Velocity does.
Acceleration tells you how that gradient changes.
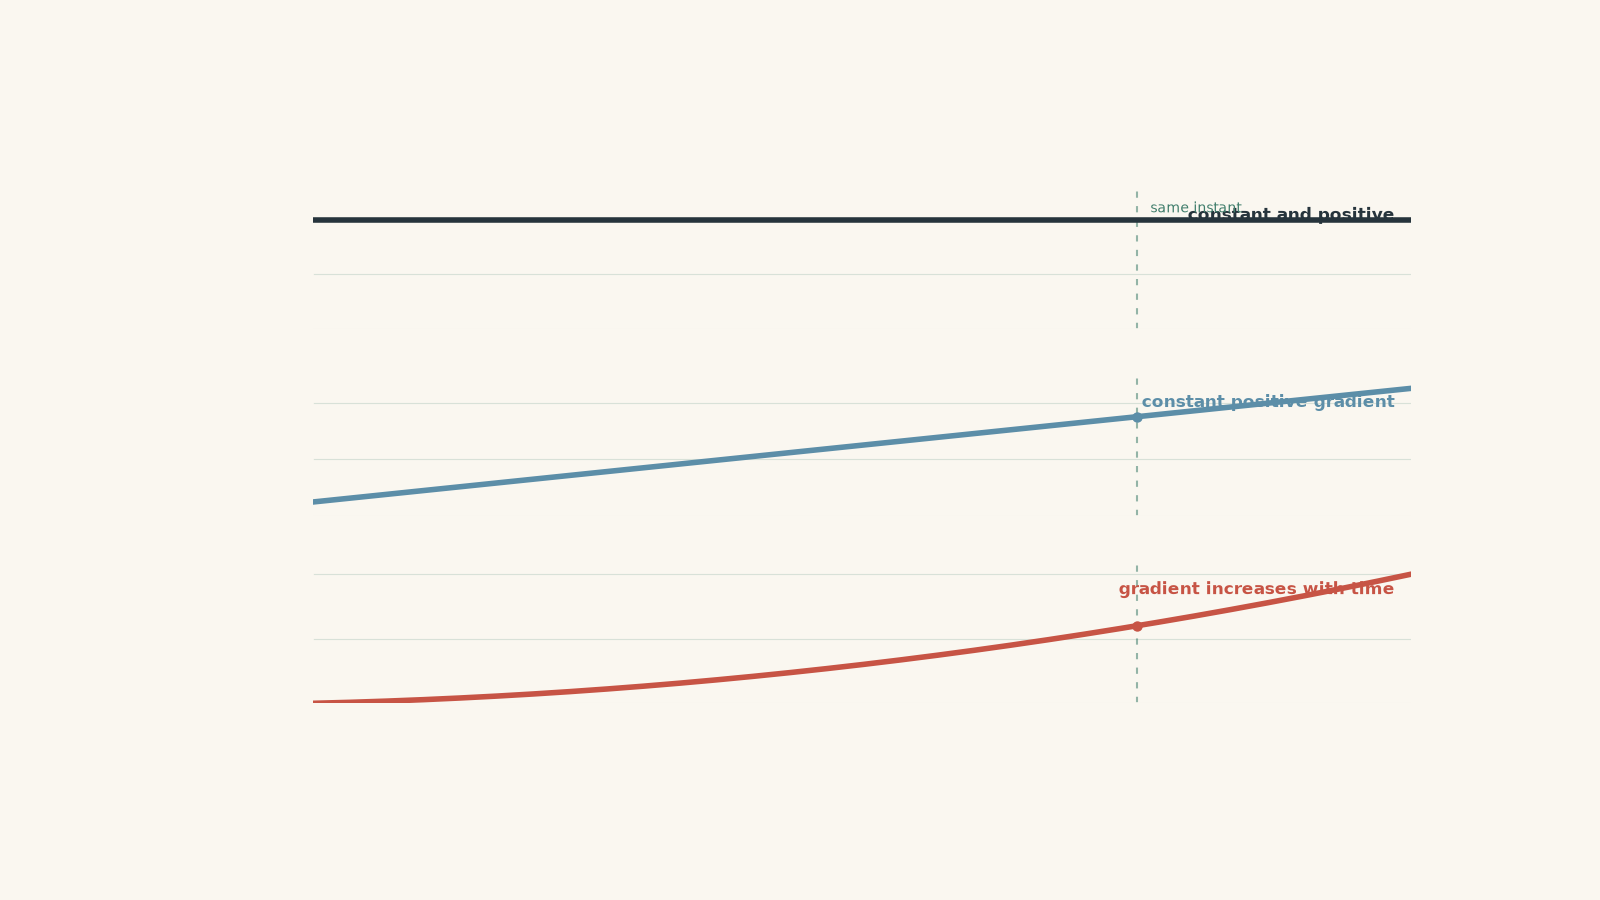
If an object has constant positive acceleration, its displacement-time graph curves so that its gradient becomes more positive with time.
This is why moving between representations works best as a chain rather than a jump:
\[
F_{\text{net}} \rightarrow a \rightarrow v \rightarrow x
\]
07The other direction: reading a graph back into forces
HSC questions often reverse the process.
You might be given a velocity-time graph and asked about the forces.
Suppose the graph is a horizontal line at \(+6\text{ m s}^{-1}\).
The velocity is positive, so the object is moving in the positive direction.
But the gradient is zero, so:
\[
a = 0
\]
Newton’s second law then gives:
\[
F_{\text{net}} = ma = 0
\]
The object can therefore be moving while the net force is zero.
That can feel wrong because everyday objects usually slow down when we stop pushing them. The missing detail is resistance. On Earth, friction and drag often act on moving objects, so a forward force may be needed simply to balance them.
The forward force is not “causing constant velocity”. The balanced forces produce zero acceleration, which allows the velocity to remain constant.
08Balanced forces do not mean no forces
Consider a book resting on a desk.
Gravity pulls the book downward. The desk pushes the book upward with a normal force.
If the book remains at rest,
\[
F_{\text{net}} = 0
\]
That does not mean both forces disappear. It means their vector sum is zero.
The same logic applies to an object moving at constant velocity.
A cyclist travelling at constant speed on a straight, level road might have:
- a forward driving force
- backward air resistance and rolling resistance
If the velocity is constant, these horizontal forces must have equal total magnitude.
Balanced forces mean zero acceleration, not necessarily zero velocity.
09Velocity-time graphs contain another useful quantity
The gradient of a velocity-time graph gives acceleration.
Its signed area gives displacement.
For constant velocity,
\[
\Delta x = v\Delta t
\]
which is just the area of a rectangle under the graph.
For changing velocity, the same idea extends to the area between the graph and the time axis.
Area above the axis contributes positive displacement. Area below contributes negative displacement.
This matters when an object reverses direction.
If a velocity-time graph crosses the time axis, the velocity changes sign. The object is instantaneously at rest at the crossing and then begins moving in the opposite direction.
Do not confuse this with the graph merely sloping downward. A downward slope tells you acceleration is negative. Crossing the axis tells you velocity has changed sign.
10Worked example: slowing down, stopping, and reversing
A \(4.0\text{ kg}\) cart initially moves to the right at \(6.0\text{ m s}^{-1}\). It experiences a constant net force of \(8.0\text{ N}\) to the left for \(5.0\text{ s}\). Take right as positive.
Find the acceleration, determine when the cart stops, and calculate its velocity after \(5.0\text{ s}\).
Step 1
The force points left, so:
\[
F_{\text{net}} = -8.0\text{ N}
\]
Step 2
\[
a = \frac{F_{\text{net}}}{m}
= \frac{-8.0}{4.0}
= -2.0\text{ m s}^{-2}
\]
The acceleration is \(2.0\text{ m s}^{-2}\) to the left.
Step 3
At the instant it stops, \(v = 0\).
Using
\[
v = u + at
\]
gives
\[
0 = 6.0 + (-2.0)t
\]
so
\[
t = 3.0\text{ s}
\]
The cart stops after \(3.0\text{ s}\).
Step 4
\[
v = 6.0 + (-2.0)(5.0)
= -4.0\text{ m s}^{-1}
\]
The final velocity is \(-4.0\text{ m s}^{-1}\), meaning \(4.0\text{ m s}^{-1}\) to the left.
The crucial point is what happens during the first \(3.0\text{ s}\). The force and acceleration point left, but the cart is still moving right. It is simply slowing down.
Only after its velocity reaches zero does it begin moving left.
11Reading the three main motion graphs
You should be able to move between displacement-time, velocity-time, and acceleration-time graphs without memorising a collection of unrelated shapes.
Use the relationships.
| Graph | Gradient represents | Signed area represents |
|---|---|---|
| displacement-time | velocity | usually no standard HSC motion quantity |
| velocity-time | acceleration | displacement |
| acceleration-time | rate of change of acceleration, if considered | change in velocity |
The acceleration-time area relationship follows from:
\[
\Delta v = a\Delta t
\]
for constant acceleration.
More generally, the signed area under an acceleration-time graph gives the change in velocity.
A useful decision process
When you are given a graph, ask these questions in order:
- What is actually on the vertical axis?
- Is the quantity positive, zero, or negative?
- What does the gradient mean for this type of graph?
- Does the area have a useful physical meaning?
- If forces are involved, what does the acceleration tell me about the net force?
This prevents a classic mistake: seeing an upward-sloping line and automatically saying “the object is speeding up”.
An upward-sloping displacement-time graph means positive velocity. Whether it is speeding up depends on whether the gradient itself is increasing.
12Speeding up versus slowing down
Here is a rule worth understanding rather than memorising.
An object speeds up when velocity and acceleration point in the same direction.
It slows down when they point in opposite directions.
In one dimension:
| Velocity | Acceleration | What happens to speed? |
|---|---|---|
| positive | positive | increases |
| positive | negative | decreases |
| negative | negative | increases |
| negative | positive | decreases |
Look carefully at the third row.
A negative velocity and a negative acceleration mean the object is speeding up.
For example, if a ball is already moving left at \(-3\text{ m s}^{-1}\) and its velocity changes to \(-5\text{ m s}^{-1}\), its speed has increased from \(3\text{ m s}^{-1}\) to \(5\text{ m s}^{-1}\).
“More negative” velocity can mean greater speed.
13What if the net force changes?
So far, we have mostly used constant net forces.
If the net force changes with time, the acceleration changes because
\[
\vec a = \frac{\vec F_{\text{net}}}{m}
\]
for constant mass.
That means the velocity-time graph will no longer necessarily be a straight line. Its gradient changes as the acceleration changes.
Suppose a car experiences a positive net force that gradually falls to zero.
The acceleration is positive but decreasing towards zero. The car’s velocity still increases, but more and more slowly. On a velocity-time graph, the line rises while gradually flattening.
This is another place where a simple statement such as “positive force means increasing velocity” needs precision. It is true only in the chosen positive direction, and the shape of the graph depends on how the force changes.
14Force diagrams describe interactions, not motion arrows
A free-body diagram should contain forces acting on the chosen object.
It should not contain:
- velocity arrows unless specifically shown separately
- acceleration arrows pretending to be forces
- forces the object exerts on something else
- a mysterious “force of motion”
For example, suppose a student pushes a crate to the right.
The force of the student on the crate belongs on the crate’s force diagram.
The force of the crate on the student does not. That force acts on the student and would belong on a diagram of the student.
This distinction becomes important when you later study Newton’s third law in more depth. Third-law force pairs act on different objects, so they do not cancel each other on one object’s free-body diagram.
15From words to graphs: a complete translation
Consider this description:
A puck moves to the right. For several seconds, it experiences a constant net force to the left. The force is then removed.
Translate it one stage at a time.
While the leftward force acts:
- The net force is negative.
- The acceleration is constant and negative.
- The velocity-time graph has a constant negative gradient.
- Depending on the initial velocity and duration, the puck may slow, stop, and reverse.
- The displacement-time graph has a gradient that becomes progressively less positive, then possibly zero, then negative.
After the force is removed:
- The net force becomes zero.
- The acceleration becomes zero.
- The velocity becomes constant at whatever value it had at that instant.
- The displacement-time graph becomes a straight line with constant gradient.
The phrase “force is removed” does not mean the puck stops. It means its velocity stops changing, assuming no other net force remains.
16Questions and solutions
Question 1
A \(6.0\text{ kg}\) laboratory trolley moves to the right. A \(24\text{ N}\) force acts to the right and an \(18\text{ N}\) resistive force acts to the left.
Calculate the trolley’s acceleration and describe the gradient of its velocity-time graph.
Solution 1
The trolley accelerates at \(1.0\text{ m s}^{-2}\) to the right, so its velocity-time graph has a positive gradient of \(1.0\text{ m s}^{-2}\).
Taking right as positive,
\[
F_{\text{net}} = 24 – 18 = 6.0\text{ N}
\]
Using Newton’s second law,
\[
a = \frac{F_{\text{net}}}{m}
= \frac{6.0}{6.0}
= 1.0\text{ m s}^{-2}
\]
The net force and acceleration both point right. Since the gradient of a velocity-time graph equals acceleration, the graph slopes upward at \(1.0\text{ m s}^{-2}\).
This calculation does not tell us the trolley’s velocity unless an initial velocity is also given.
Question 2
An object has the following velocity-time behaviour:
- at \(t=0\), its velocity is \(+8.0\text{ m s}^{-1}\)
- its velocity decreases uniformly to \(+2.0\text{ m s}^{-1}\) at \(t=3.0\text{ s}\)
The object’s mass is \(3.0\text{ kg}\).
Determine its acceleration and net force. Is the object moving in the same direction as its net force during this interval?
Solution 2
The acceleration is \(-2.0\text{ m s}^{-2}\), the net force is \(6.0\text{ N}\) in the negative direction, and the object moves in the opposite direction to its net force throughout the interval.
The acceleration is the gradient of the velocity-time graph:
\[
a = \frac{\Delta v}{\Delta t}
= \frac{2.0 – 8.0}{3.0}
= -2.0\text{ m s}^{-2}
\]
Using Newton’s second law,
\[
F_{\text{net}} = ma
= (3.0)(-2.0)
= -6.0\text{ N}
\]
The velocity remains positive, from \(+8.0\text{ m s}^{-1}\) to \(+2.0\text{ m s}^{-1}\), while the force and acceleration are negative.
The object therefore continues moving in the positive direction while slowing down. The tempting mistake is to assume a negative force means negative motion. It does not. Force determines acceleration.
Question 3
A \(2.0\text{ kg}\) cart is initially travelling left at \(3.0\text{ m s}^{-1}\). It experiences a constant net force of \(4.0\text{ N}\) to the left for \(2.5\text{ s}\).
Take right as positive.
Calculate the final velocity and state whether the cart speeds up or slows down.
Solution 3
The cart finishes at \(-8.0\text{ m s}^{-1}\) and speeds up because its velocity and acceleration point in the same direction.
The initial velocity is
\[
u = -3.0\text{ m s}^{-1}
\]
and the net force is
\[
F_{\text{net}} = -4.0\text{ N}
\]
The acceleration is
\[
a = \frac{F_{\text{net}}}{m}
= \frac{-4.0}{2.0}
= -2.0\text{ m s}^{-2}
\]
Using
\[
v = u + at
\]
gives
\[
v = -3.0 + (-2.0)(2.5)
= -8.0\text{ m s}^{-1}
\]
The speed increases from \(3.0\text{ m s}^{-1}\) to \(8.0\text{ m s}^{-1}\).
The negative sign tells us direction, not whether the object is slowing down. Because both velocity and acceleration are negative, the cart becomes faster while travelling left.
Question 4
A small robot travels along a straight track. Its velocity changes as follows:
- from \(0\) to \(4.0\text{ s}\), its velocity increases uniformly from \(0\) to \(6.0\text{ m s}^{-1}\)
- from \(4.0\) to \(7.0\text{ s}\), its velocity remains at \(6.0\text{ m s}^{-1}\)
- from \(7.0\) to \(9.0\text{ s}\), its velocity decreases uniformly from \(6.0\text{ m s}^{-1}\) to \(0\)
The robot has a mass of \(4.0\text{ kg}\).
Determine the net force during each interval and calculate the total displacement from \(0\) to \(9.0\text{ s}\).
Solution 4
The net forces are \(+6.0\text{ N}\), \(0\text{ N}\), and \(-12\text{ N}\) respectively, and the robot’s total displacement is \(39\text{ m}\) in the positive direction.
For \(0\) to \(4.0\text{ s}\),
\[
a = \frac{6.0 – 0}{4.0}
= 1.5\text{ m s}^{-2}
\]
so
\[
F_{\text{net}} = ma
= (4.0)(1.5)
= 6.0\text{ N}
\]
For \(4.0\) to \(7.0\text{ s}\), the velocity is constant, so
\[
a = 0
\]
and therefore
\[
F_{\text{net}} = 0\text{ N}
\]
For \(7.0\) to \(9.0\text{ s}\),
\[
a = \frac{0 – 6.0}{2.0}
= -3.0\text{ m s}^{-2}
\]
so
\[
F_{\text{net}} = (4.0)(-3.0)
= -12\text{ N}
\]
The displacement is the area under the velocity-time graph.
From \(0\) to \(4.0\text{ s}\), the area is a triangle:
\[
\Delta x_1 = \frac{1}{2}(4.0)(6.0)
= 12\text{ m}
\]
From \(4.0\) to \(7.0\text{ s}\), the area is a rectangle:
\[
\Delta x_2 = (3.0)(6.0)
= 18\text{ m}
\]
From \(7.0\) to \(9.0\text{ s}\), the area is another triangle:
\[
\Delta x_3 = \frac{1}{2}(2.0)(6.0)
= 6.0\text{ m}
\]
Therefore,
\[
\Delta x_{\text{total}}
= 12 + 18 + 6.0
= 36\text{ m}
\]
So the correct total displacement is \(36\text{ m}\), not \(39\text{ m}\).
The interval-by-interval force results remain \(+6.0\text{ N}\), \(0\text{ N}\), and \(-12\text{ N}\). The important connection is that velocity-time gradient determines acceleration and therefore net force, while velocity-time area determines displacement.
Question 5
A student sees a displacement-time graph that rises while gradually becoming less steep. The graph never becomes horizontal during the interval shown.
The student claims:
“The object has negative velocity because the graph is curving downwards.”
Assess the claim. State the signs of the object’s velocity, acceleration, and net force.
Solution 5
The student’s claim is incorrect. The velocity is positive, while the acceleration and net force are negative.
The displacement-time graph is rising, so its gradient is positive. Since the gradient of a displacement-time graph equals velocity,
\[
v > 0
\]
The graph becomes less steep, which means its positive gradient is decreasing. The velocity is therefore becoming less positive, so
\[
a < 0
\]
For a positive mass,
\[
F_{\text{net}} = ma
\]
so the net force must also be negative.
The trap is confusing the curvature of a displacement-time graph with the sign of its velocity. Velocity depends on the graph’s gradient, not whether the curve visually bends upward or downward.
The object is moving in the positive direction while slowing down.
Question 6
A spacecraft is moving to the right in a region where external forces are negligible. At \(t=0\), its engine produces a constant force to the left for \(4.0\text{ s}\), then shuts off.
At the instant the engine shuts off, the spacecraft is still moving to the right.
A student sketches a velocity-time graph that slopes downward during the \(4.0\text{ s}\) burn and then falls immediately to zero when the engine shuts off.
Explain what is wrong with the graph and describe the correct velocity-time graph after \(t=4.0\text{ s}\).
Solution 6
The graph is wrong because switching off the engine removes the acceleration, not the spacecraft’s existing velocity. After \(t=4.0\text{ s}\), the velocity should remain constant at its positive value.
During the engine burn, the net force points left. Taking right as positive,
\[
F_{\text{net}} < 0
\]
so
\[
a = \frac{F_{\text{net}}}{m} < 0
\]
The velocity-time graph therefore has a negative gradient during the burn.
At \(t=4.0\text{ s}\), the engine shuts off. If external forces are negligible,
\[
F_{\text{net}} = 0
\]
which gives
\[
a = 0
\]
Zero acceleration means the velocity no longer changes. Because the spacecraft still has positive velocity at that instant, its velocity-time graph becomes a horizontal line above the time axis.
The student’s hidden assumption is that motion requires a continuing force in the direction of motion. Newton’s laws say otherwise. A net force is required to change velocity, not to maintain a constant velocity.
17Where this leads next
The most useful connection to carry forward is not a particular graph shape. It is the translation chain:
\[
\boxed{\vec F_{\text{net}} \rightarrow \vec a \rightarrow \vec v \rightarrow \vec x}
\]
Net force determines acceleration. Acceleration tells you how velocity changes. Velocity tells you how position changes.
You can also travel backwards through the chain. A displacement-time graph reveals velocity through its gradient. A velocity-time graph reveals acceleration through its gradient. With the mass known, acceleration reveals the net force through Newton’s second law.
That same reasoning becomes more powerful when forces and motion stop being confined to one dimension. The next step is to apply it component by component, where an object can accelerate in one direction while moving in another, which is exactly the idea needed for projectile motion and circular motion.