
Mass Spectrometry, IR and NMR: How to Identify a Structure
Learn how mass spectrometry, infrared spectroscopy, and NMR reveal different aspects of an organic molecule. Use decision rules, worked examples, and practice questions to combine spectral evidence and identify structures accurately.
Two compounds can have the same molecular formula, the same molecular mass, and completely different structures. Take ethanol, \(CH_3CH_2OH\), and dimethyl ether, \(CH_3OCH_3\). Both have the formula \(C_2H_6O\) and a relative molecular mass of 46. How would you tell them apart?
A mass spectrum showing a molecular ion at \(m/z = 46\) doesn’t settle the question. Both compounds fit. You need to look for different evidence: does the molecule contain an O-H bond, and how many different hydrogen environments does it have?
That’s where infrared spectroscopy (IR) and nuclear magnetic resonance spectroscopy (NMR) become useful.
Same molecular mass, different structural evidence
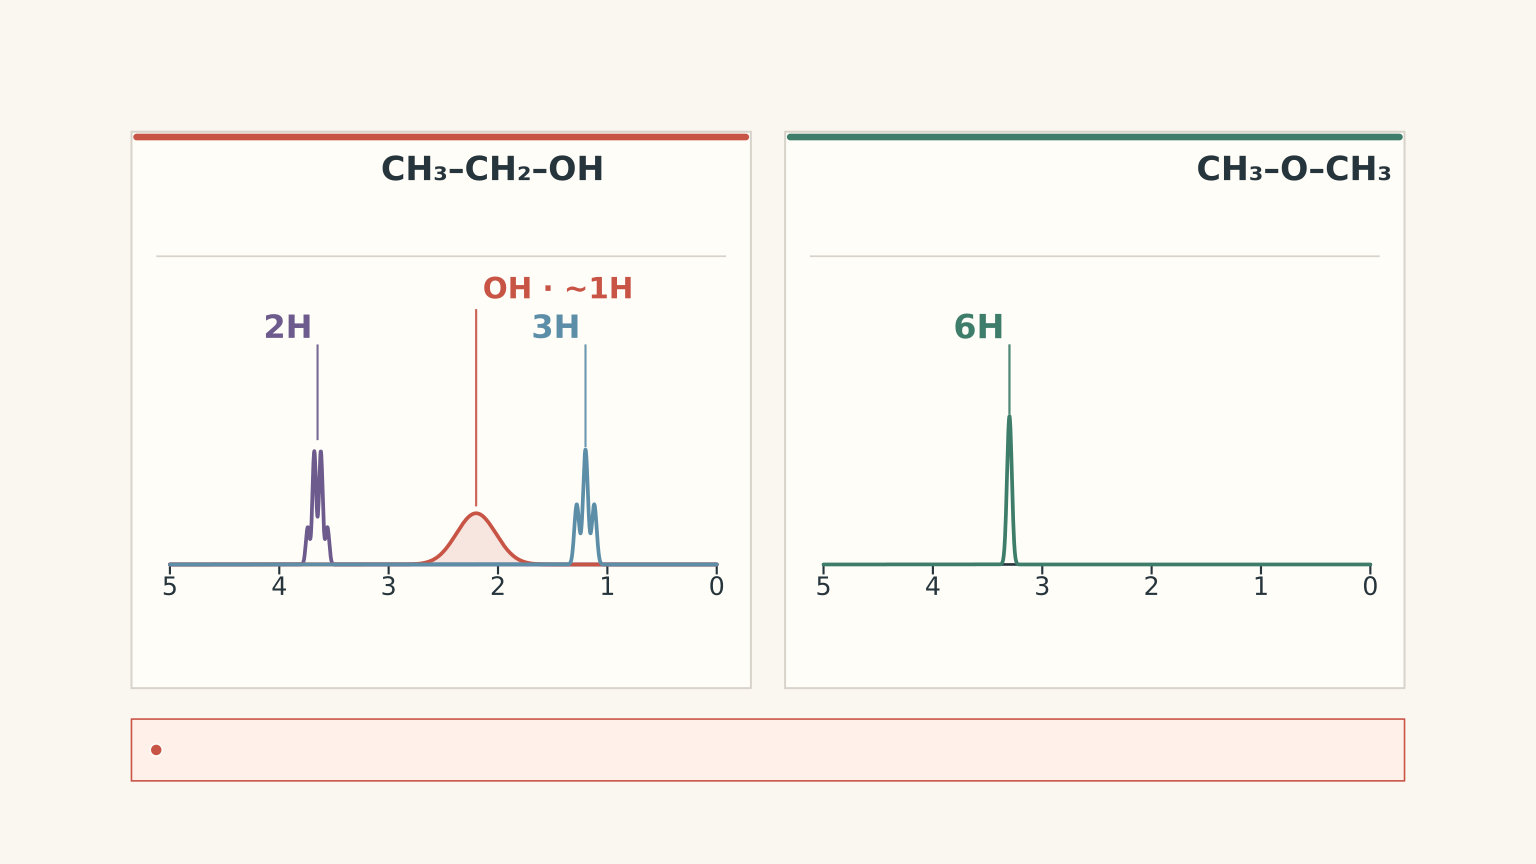
| Ethanol | CH₃CH₂OH Formula: C₂H₆O; Mᵣ = 46 MS: molecular ion at m/z 46 IR: broad O–H band, approximately 3200–3600 cm⁻¹ ¹H NMR: three typical environments; CH₃ (3H, triplet), CH₂ (2H, quartet), O–H (1H, variable) |
|---|---|
| Dimethyl ether | CH₃OCH₃ Formula: C₂H₆O; Mᵣ = 46 MS: molecular ion at m/z 46 IR: no O–H band; contains C–O–C ¹H NMR: one typical signal integrating to 6H; equivalent methyl groups, usually a singlet |
The key is to stop treating these techniques as three different ways of measuring the same thing. Each reveals a different part of the structure.
01The decision rule: which technique should you use?
Use this table when you’re given an unknown organic compound and need to decide what the evidence actually tells you.
| Technique | The question it answers | What to look for | What it cannot establish alone |
|---|---|---|---|
| Mass spectrometry (MS) | What is the molecular mass, and which fragments form? | Molecular ion, \(m/z\) values, fragment peaks | Usually not the complete structure from one or two peaks |
| Infrared spectroscopy (IR) | Which types of bonds or functional groups are present? | Absorption bands, especially O-H, C=O, and C-O | Usually not the exact arrangement of atoms |
| Proton NMR (\(^1H\) NMR) | How are the hydrogen atoms arranged into different environments? | Number of signals, chemical shifts, integration, and splitting | Not always a unique structure without other evidence |
| Carbon-13 NMR (\(^{13}C\) NMR) | How many distinct carbon environments are present? | Number of signals and their chemical shifts | Usually not the complete structure by itself |
A useful way to picture the three main techniques is as witnesses investigating the same mystery. MS reports mass and fragments, IR reports bond vibrations, and NMR helps reconstruct the local atomic environments.
The analogy has a limit: a weak or missing peak doesn’t automatically prove that a feature is absent. You need to understand how each technique produces its evidence.
A reliable order of attack
When a question gives you multiple spectra, work through them in this order.
- Check the molecular formula and mass. Calculate the relative molecular mass, \(M_r\), if a formula is provided. Compare it with the molecular-ion peak in the mass spectrum.
- Identify likely functional groups. Use the IR spectrum to look for diagnostic bonds, especially O-H and C=O.
- Build the structure using NMR. Count the signals, interpret their chemical shifts, compare their integrations, and examine their splitting.
- Test the proposed structure against every piece of evidence. If one spectrum contradicts your structure, don’t ignore it just because the other two seem to fit.
The final step is essential. A structure that explains two spectra but contradicts the third is not a complete identification.
01Mass spectrometry: molecular mass and fragments
Mass spectrometry is usually your first tool for checking the size of an organic molecule.
The sample is ionised, producing charged particles. These ions are separated according to their mass-to-charge ratio, written \(m/z\), and detected.
For the singly charged ions commonly encountered in introductory organic mass spectra, the numerical value of \(m/z\) is approximately the ion’s mass in atomic mass units.
Read the axes before interpreting the peaks
- The horizontal axis shows \(m/z\), the mass-to-charge ratio.
- The vertical axis shows relative abundance, which indicates how abundant each detected ion is relative to the others.
Three terms matter most.
Molecular ion: An ion containing the intact molecule, formed when the molecule is ionised without fragmenting. It is often written \(M^{+\bullet}\) in electron-impact mass spectrometry.
If a singly charged molecular ion appears at \(m/z = 88\), the molecular mass is approximately 88 atomic mass units, corresponding to \(M_r \approx 88\).
Base peak: The tallest peak in the spectrum. Its relative abundance is defined as 100%.
The base peak is not necessarily the molecular ion. A molecule may fragment readily, producing a particularly stable fragment ion that is more abundant than the intact molecular ion.
Fragment ion: A charged piece of a molecule produced when bonds break during ionisation or subsequent fragmentation.
Fragment peaks provide clues about the molecule’s structure, but a peak at a particular \(m/z\) does not always correspond to only one possible fragment.
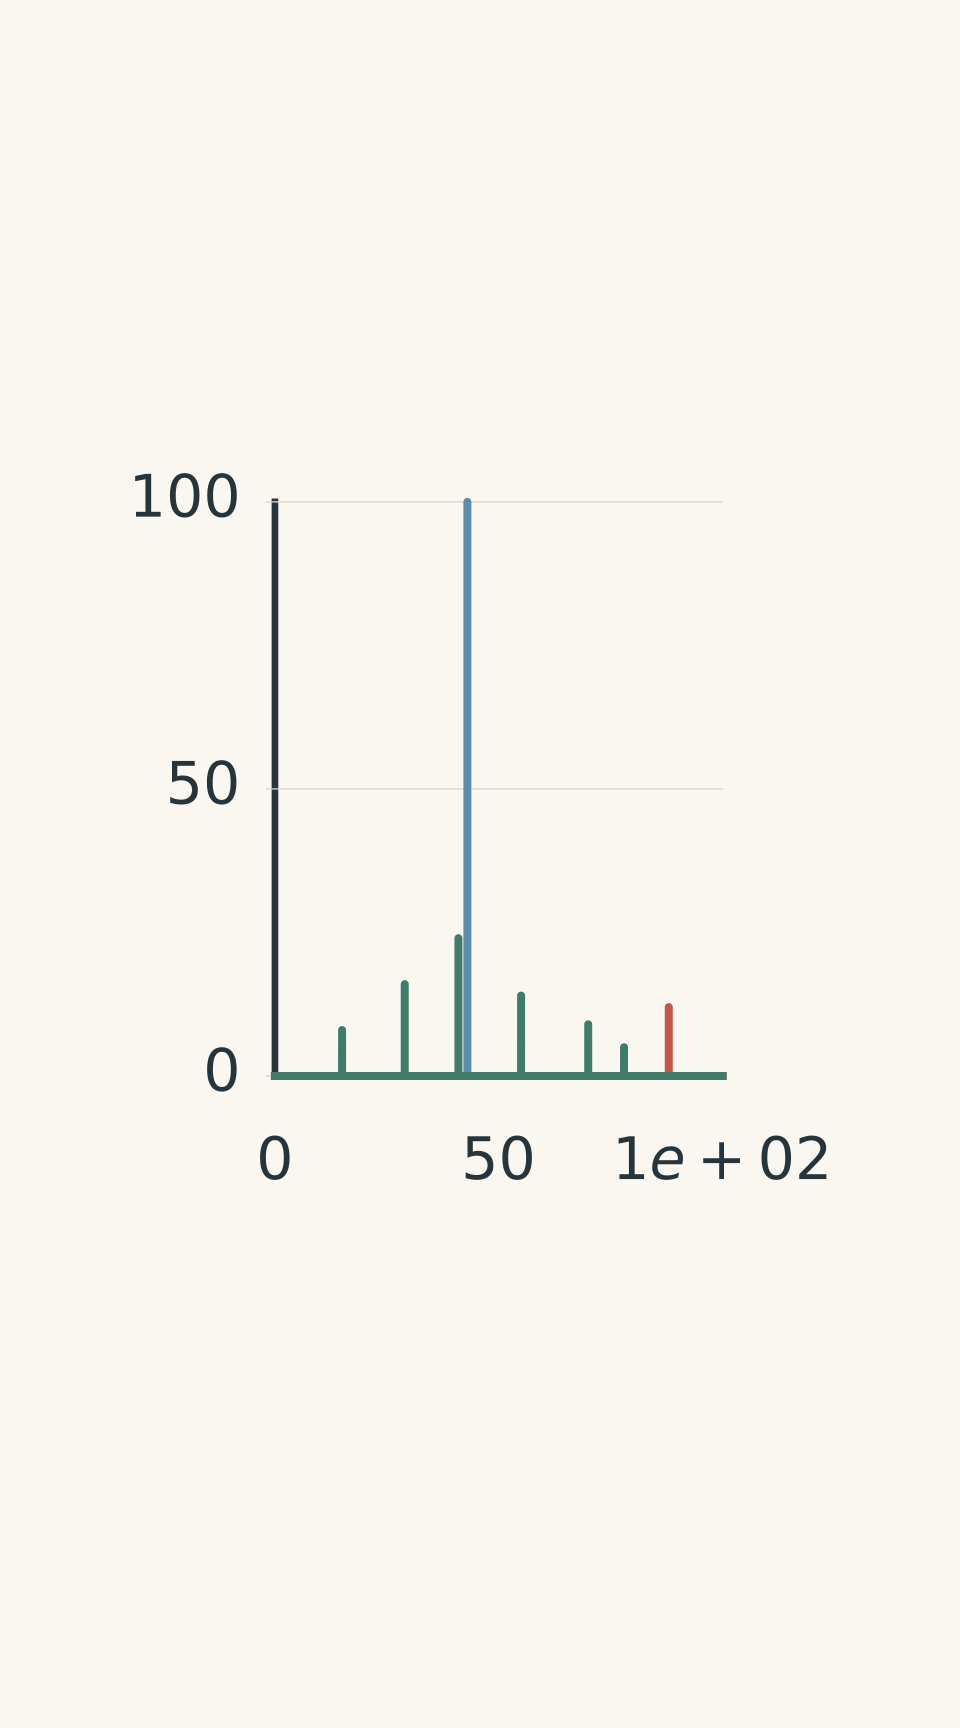
- Base peak: m/z 43 (100%)
- Molecular ion M⁺·: m/z 88 (12%)
- Smaller fragment ions (schematic)
How to use a mass spectrum
Start with the molecular-ion peak if it is present. Then use the remaining peaks to investigate fragmentation.
Suppose an unknown compound has the formula \(C_4H_8O_2\). Calculate its relative molecular mass using the approximate relative atomic masses \(C = 12.0\), \(H = 1.0\), and \(O = 16.0\):
\[ \begin{aligned} M_r &= 4(12.0)+8(1.0)+2(16.0)\\\ &=48.0+8.0+32.0\\\ &=88.0 \end{aligned} \]
A molecular-ion peak at \(m/z = 88\) is consistent with this formula.
If the base peak is at \(m/z = 43\), that tells you that the ion at 43 is the most abundant detected ion. It does not mean the entire molecule has a relative molecular mass of 43.
The fragmentation pattern may help distinguish structural isomers, but the molecular-ion peak alone cannot do that when the isomers have the same molecular formula.
One more caution: the molecular ion can be weak or absent because the molecule fragments readily. Don’t automatically reject a proposed formula because the molecular-ion peak is small.
Worked example: What does the tallest peak tell you?
A compound has the formula \(C_4H_8O_2\). Its mass spectrum contains a weak peak at \(m/z = 88\) and a base peak at \(m/z = 43\). What can you conclude from these peaks, and what remains unknown?
Step 1: Calculate the expected relative molecular mass.
\[ M_r=4(12.0)+8(1.0)+2(16.0)=88.0 \]
The molecular-ion peak at \(m/z = 88\) is consistent with the formula.
Step 2: Interpret the base peak.
The ion at \(m/z = 43\) is the most abundant detected ion. It is a fragment, not the molecular ion, because its mass-to-charge ratio is lower than that of the intact molecular ion.
Step 3: Decide what the evidence establishes.
The peaks support a molecular mass of approximately 88 and indicate that a fragment at \(m/z = 43\) forms readily.
They do not uniquely establish the structure. Different compounds with the same formula can have the same molecular mass and may produce overlapping fragment peaks. IR and NMR are needed to narrow the possibilities.
02Infrared spectroscopy: identifying functional groups
A molecule’s bonds vibrate. When infrared radiation of a suitable frequency interacts with a molecule, energy can be absorbed and particular vibrational motions become more energetic.
Different types of bonds absorb infrared radiation in characteristic regions. That makes IR useful for identifying functional groups.
The horizontal axis is usually the wavenumber, measured in \(\text{cm}^{-1}\). Wavenumber describes the number of wave cycles per unit distance and is related to the radiation’s frequency and energy.
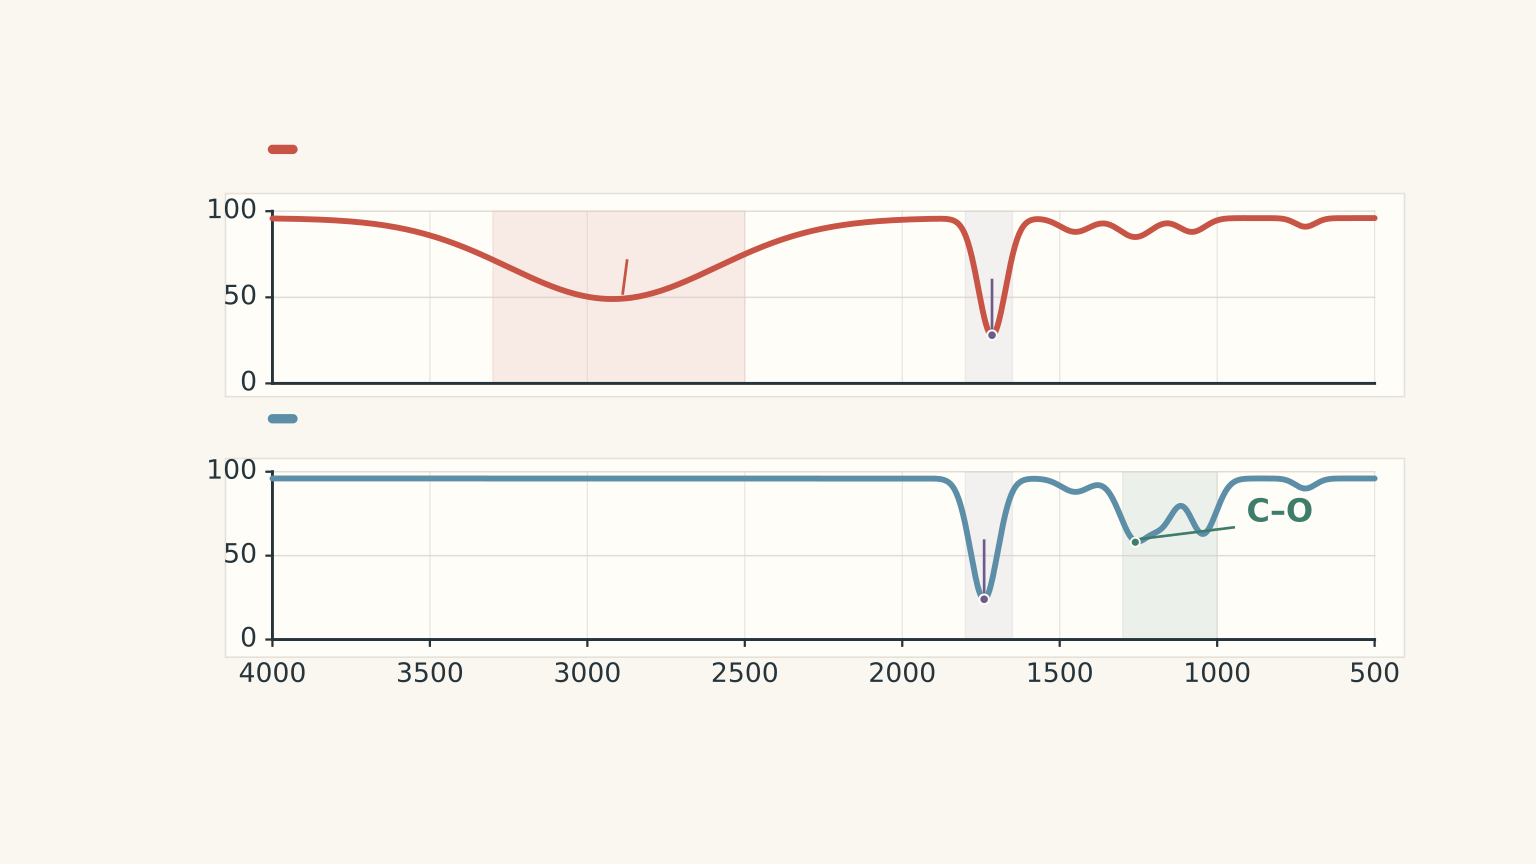
Many teaching spectra plot percentage transmittance on the vertical axis. In this format, strong absorption appears as a downward dip. Other spectra plot absorbance, in which absorption appears as an upward peak.
Check the vertical axis before interpreting the shape of a band.
The IR bands worth recognising
These are approximate ranges. The precise position and shape of a band depend on the molecular environment and the spectrum’s conditions.
| Bond or group | Approximate wavenumber | Useful clue |
|---|---|---|
| Alcohol O-H | 3200-3600 cm\(^{-1}\) | Usually broad |
| Carboxylic acid O-H | 2500-3300 cm\(^{-1}\) | Very broad; may overlap the C-H region |
| Alkane C-H | 2850-3000 cm\(^{-1}\) | Common in saturated organic compounds |
| Alkene or aromatic C-H | Often just above 3000 cm\(^{-1}\) | May support unsaturation or an aromatic structure |
| C=O | Approximately 1650-1750 cm\(^{-1}\) | Usually a strong absorption |
| C=C | Approximately 1620-1680 cm\(^{-1}\) | Often weaker and less decisive |
| C-O | Approximately 1000-1300 cm\(^{-1}\) | Useful supporting evidence for alcohols, ethers, esters, and acids |
The ranges overlap, so don’t identify a functional group from a single number without considering the rest of the spectrum.
The most useful IR decisions
Is there a carbonyl group?
A strong absorption in the C=O region suggests a carbonyl-containing compound. Aldehydes, ketones, esters, and carboxylic acids all contain this bond, so the carbonyl absorption alone does not distinguish between them.
Is there a broad O-H absorption?
A broad band around 3200-3600 cm\(^{-1}\) supports an alcohol. A very broad band extending roughly from 2500-3300 cm\(^{-1}\), together with a carbonyl absorption, strongly supports a carboxylic acid.
Is there a carbonyl group but no O-H absorption?
If a clear spectrum also shows a strong C-O absorption, an ester is a reasonable candidate. This is especially useful when you’re choosing between an ester and a carboxylic acid.
However, a missing band is not absolute proof of absence. Sample quality, concentration, and overlapping absorptions can affect what you see.
Why the whole pattern matters
Consider propanoic acid and methyl ethanoate. Both have the formula \(C_3H_6O_2\), and both have \(M_r = 74\).
A mass spectrum showing a molecular ion at \(m/z = 74\) is consistent with either compound. The molecular mass does not distinguish them.
Their IR spectra can.
- Propanoic acid contains both C=O and O-H bonds. Its spectrum should show a strong carbonyl absorption and a very broad carboxylic acid O-H absorption.
- Methyl ethanoate contains C=O and C-O bonds but no O-H bond. Its spectrum should show the carbonyl and C-O absorptions without the broad carboxylic acid O-H band.
The important move is to interpret a combination of bands, rather than searching for one magic peak.
03NMR spectroscopy: reconstructing the atomic environments
Mass spectrometry helps establish molecular mass. IR helps identify functional groups. Proton NMR helps determine how the hydrogen atoms are arranged within the structure.
In \(^1H\) NMR, hydrogen nuclei are observed in a magnetic field. Different chemical environments cause hydrogen nuclei to resonate at slightly different frequencies under the same experimental conditions.
Hydrogens in the same chemical environment are called chemically equivalent. Equivalent hydrogens generally contribute to the same signal.
This means that the number of signals is not the same as the number of hydrogen atoms.
For example, the two methyl groups in propan-2-ol are equivalent because the molecule’s symmetry gives them the same chemical environment. Their six hydrogen atoms contribute to one signal.
Read a proton NMR spectrum in four steps
Step 1: Count the signals.
Each signal represents a distinct proton environment, not necessarily a distinct carbon atom.
- One signal can represent six equivalent hydrogens.
- Three signals can represent three different groups of hydrogens.
- Symmetry can make separate groups of atoms chemically equivalent.
Step 2: Read the chemical shifts.
Chemical shift is represented by \(\delta\) and measured in parts per million (ppm). It describes where a signal appears relative to a reference.
Electronegative atoms such as oxygen can withdraw electron density from nearby bonds. This often leaves nearby hydrogen nuclei less shielded, shifting their signals to higher ppm values.
The following ranges are approximate guides for common organic structures.
| Proton environment | Approximate chemical shift |
|---|---|
| Saturated alkyl C-H | 0.8-2.0 ppm |
| C-H near a carbonyl group | 2.0-3.0 ppm |
| C-H on a carbon bonded to O, N, or a halogen | 3.0-4.5 ppm |
| Alkene C-H | 4.5-6.5 ppm |
| Aromatic C-H | 6.0-8.5 ppm |
| Aldehyde C-H | 9-10 ppm |
| Carboxylic acid O-H | Often around 10-13 ppm, broad and variable |
Alcohol O-H signals are particularly variable. Their positions and shapes depend on factors such as hydrogen bonding and exchange, so you should not identify an alcohol using the O-H chemical shift alone.
Step 3: Compare the integrations.
Integration indicates the relative number of hydrogens contributing to each signal.
Suppose three signals have an integration ratio of \(3:2:3\). This suggests three proton environments containing three, two, and three hydrogens, respectively.
The integration usually gives a ratio rather than an automatic absolute count. Use the molecular formula to scale the ratio and check that the total number of hydrogens makes sense.
Exchangeable O-H and N-H hydrogens may not integrate reliably. A missing or poorly defined exchangeable-proton signal does not automatically mean the bond is absent.
Step 4: Examine the splitting.
A signal may split into multiple closely spaced peaks because of interactions with neighbouring, chemically equivalent hydrogen nuclei. This is called spin-spin splitting.
For simple spectra, the common \(n+1\) rule states that a set of hydrogens with \(n\) equivalent neighbouring hydrogens often produces \(n+1\) peaks.
| Pattern | Number of peaks | Typical interpretation |
|---|---|---|
| Singlet | 1 | No relevant neighbouring hydrogens producing splitting |
| Doublet | 2 | One equivalent neighbouring hydrogen |
| Triplet | 3 | Two equivalent neighbouring hydrogens |
| Quartet | 4 | Three equivalent neighbouring hydrogens |
| Septet | 7 | Six equivalent neighbouring hydrogens |
The rule is a model for simple splitting patterns, not a universal shortcut. It works when the relevant neighbouring hydrogens are equivalent and the spectrum has a simple coupling pattern. Exchangeable O-H hydrogens often do not split neighbouring signals in the expected way.
Use the pattern, not just the signal count
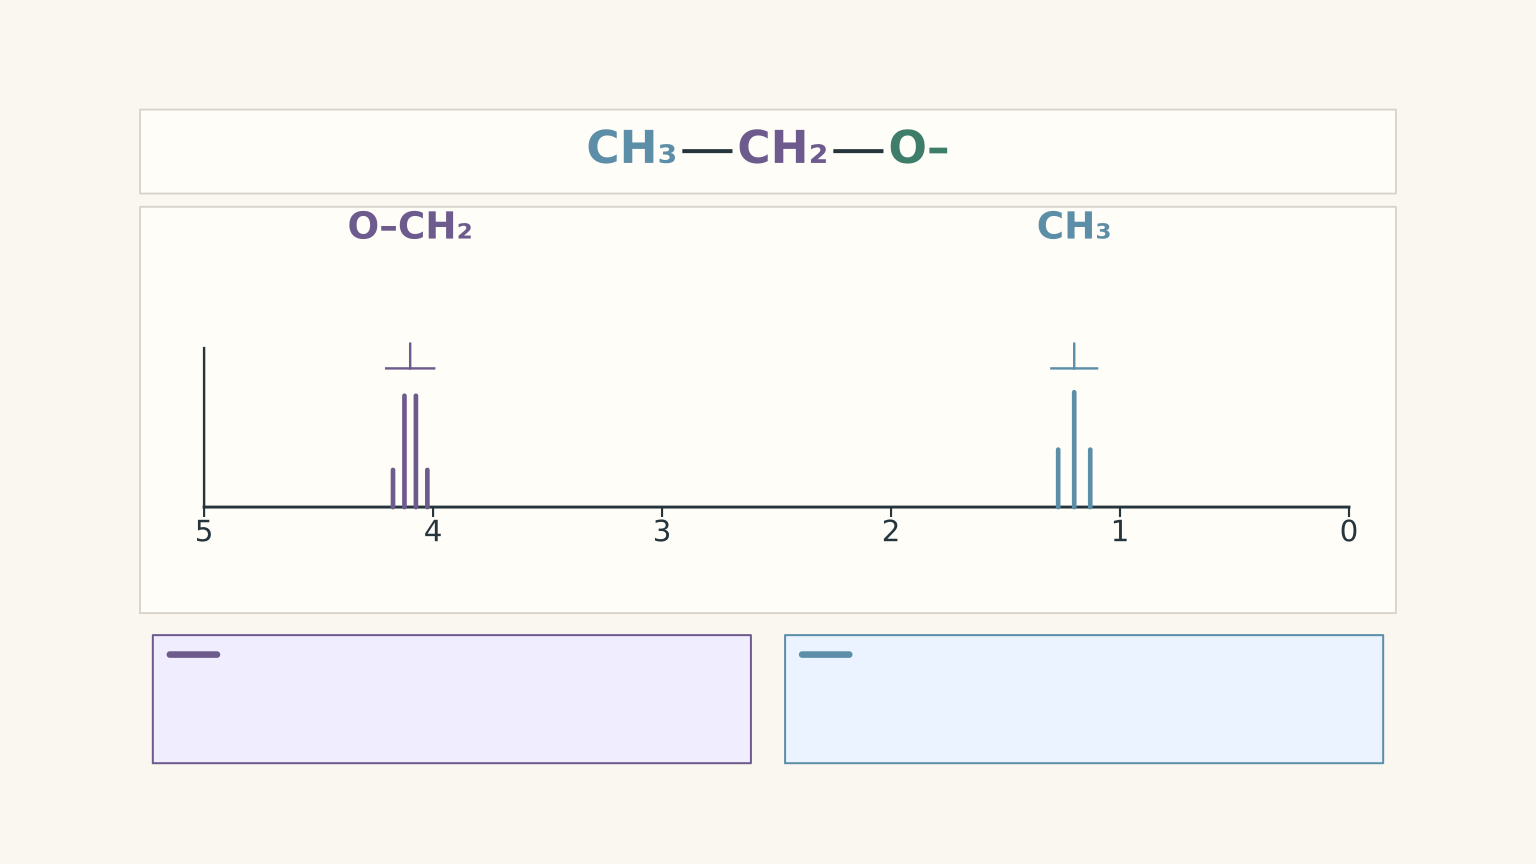
The fragment \(CH_3CH_2-\) is a useful example.
The three hydrogens in the \(CH_3\) group have two equivalent neighbouring hydrogens on the adjacent \(CH_2\) group. In a simple spectrum, they produce a triplet.
The two hydrogens in the \(CH_2\) group have three equivalent neighbouring hydrogens on the \(CH_3\) group. They produce a quartet.
The integration ratio is \(3:2\), and the two groups usually have different chemical shifts.
This combination of signal count, integration, chemical shift, and splitting gives much stronger evidence for an ethyl group than any one feature alone.
What if the spectrum is \(^{13}C\) NMR?
Carbon-13 NMR uses the same broad idea of chemical environments, but it observes carbon nuclei rather than hydrogen nuclei.
- Each signal generally represents a distinct carbon environment.
- Equivalent carbons may contribute to the same signal.
- Carbonyl carbons usually appear at much higher chemical shifts than ordinary saturated alkyl carbons.
- In routine proton-decoupled \(^{13}C\) spectra, signal intensities are not generally used as a reliable count of the number of equivalent carbons.
Typical carbon-13 shifts range from roughly 0-50 ppm for many saturated alkyl carbons, around 50-90 ppm for many carbons bonded to oxygen, and approximately 160-220 ppm for carbonyl carbons, depending on the functional group.
If you’re given both proton and carbon-13 NMR, use the proton spectrum to investigate hydrogen environments and the carbon spectrum to check the number and types of carbon environments.
04Combine the evidence to identify a structure
Once you understand the individual techniques, the next task is to make them work together.
Consider an unknown compound with the formula \(C_3H_6O_2\). The mass spectrum shows a molecular ion at \(m/z = 74\). The IR spectrum shows a strong C=O absorption, a strong C-O absorption, and no broad O-H band. The proton NMR spectrum contains two singlets, one at \(\delta = 3.7\) ppm integrating to 3H and one at \(\delta = 2.0\) ppm integrating to 3H.
The most likely structure is methyl ethanoate, \(CH_3COOCH_3\).
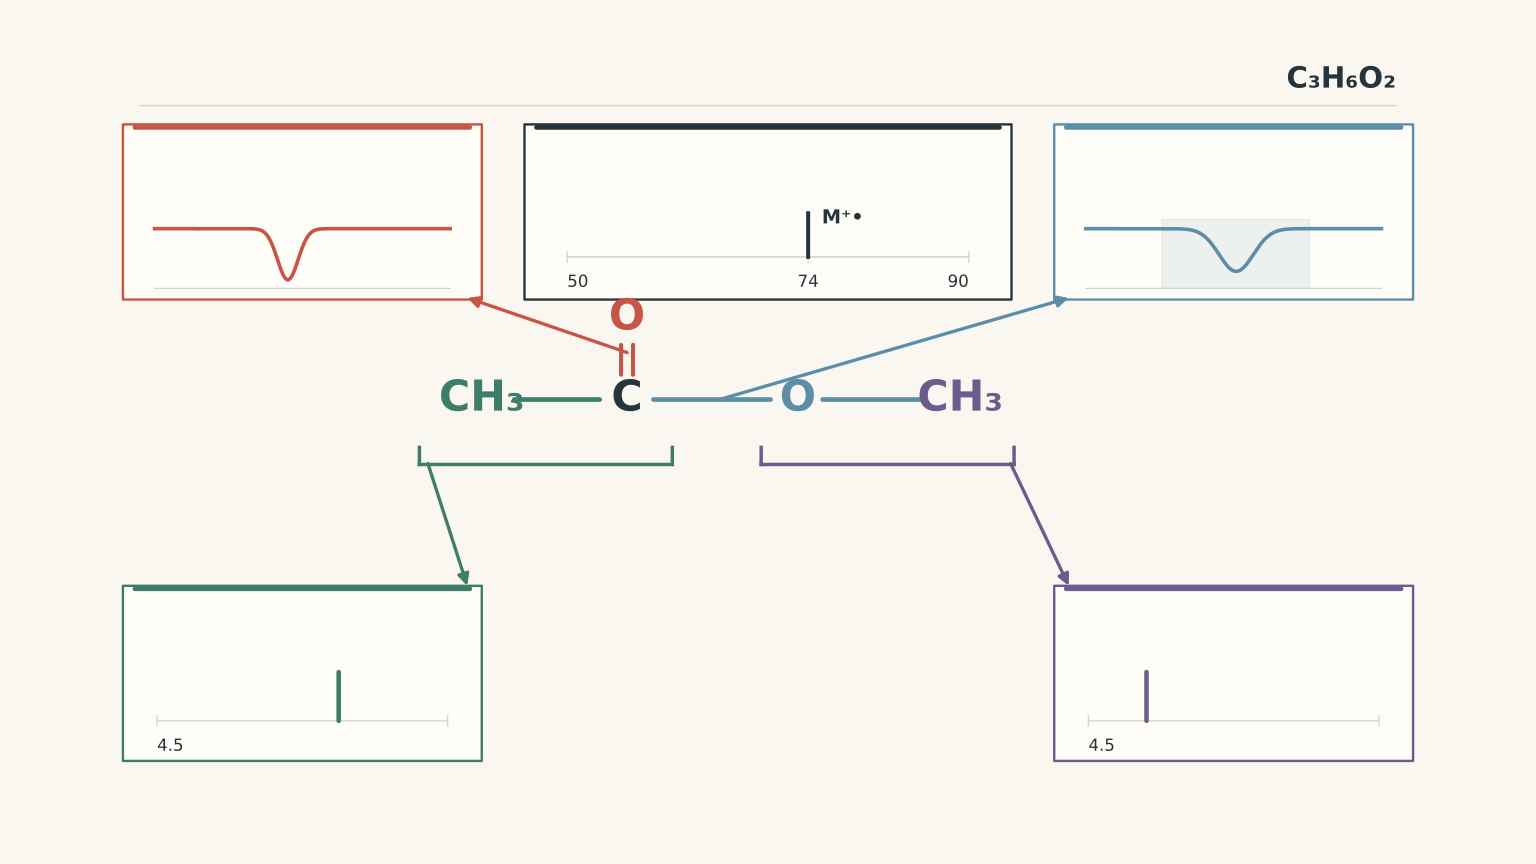
Worked example: Identify an ester using all three techniques
An unknown compound has the formula \(C_3H_6O_2\). Its molecular-ion peak is at \(m/z = 74\). Its IR spectrum shows a strong C=O band near \(1740\ \text{cm}^{-1}\), a strong C-O absorption, and no broad O-H band. Its proton NMR spectrum shows:
- A singlet at \(\delta = 3.7\) ppm, integrating to 3H.
- A singlet at \(\delta = 2.0\) ppm, integrating to 3H.
Identify the most likely structure and explain how each technique supports your answer.
Step 1: Check the molecular mass.
Using the formula:
\[ \begin{aligned} M_r &= 3(12.0)+6(1.0)+2(16.0)\\\ &=36.0+6.0+32.0\\\ &=74.0 \end{aligned} \]
The molecular-ion peak at \(m/z = 74\) agrees with the expected relative molecular mass.
Step 2: Use IR to identify the functional group.
The strong C=O absorption indicates a carbonyl group. The C-O absorption and the absence of a broad O-H band support an ester rather than a carboxylic acid, assuming the spectrum is sufficiently clear.
Step 3: Interpret the proton NMR signals.
The signal at 3.7 ppm integrates to 3H. This is consistent with the three equivalent hydrogens in an \(OCH_3\) group.
The signal at 2.0 ppm also integrates to 3H. This is consistent with the three hydrogens in a methyl group adjacent to a carbonyl, \(CH_3CO-\).
Both signals are singlets in the simple expected pattern because neither methyl group has the usual neighbouring carbon-bound hydrogens needed to produce the familiar triplet or quartet pattern.
Step 4: Assemble the structure and check the formula.
The two groups fit together as \(CH_3COOCH_3\), methyl ethanoate.
The structure contains three carbon atoms, six hydrogen atoms, and two oxygen atoms. It has a carbonyl group and C-O bonds but no O-H bond.
The mass spectrum, IR spectrum, and proton NMR spectrum therefore support the same structure.
05Common mistakes and how to avoid them
Mistake 1: Using the base peak as the molecular mass
The base peak is the most abundant ion, not necessarily the intact molecule. Find the molecular-ion peak if it is present, then use the remaining fragments as structural evidence.
Mistake 2: Treating the number of NMR signals as the number of hydrogens
One signal may represent one hydrogen or several equivalent hydrogens. Use integration to determine the relative number of hydrogens in each environment.
Mistake 3: Assuming that no O-H signal means no O-H bond
Exchangeable hydrogens can produce broad, weak, or variable NMR signals. Check the IR spectrum and the molecular formula before rejecting an alcohol or carboxylic acid.
Mistake 4: Reading an IR spectrum without checking its vertical axis
On a percentage-transmittance spectrum, strong absorptions appear as downward dips. On an absorbance spectrum, they appear as upward peaks.
Mistake 5: Identifying a whole molecule from one absorption or one fragment
A carbonyl band indicates a C=O bond, not automatically an ester. A fragment at \(m/z = 43\) does not uniquely identify a compound. Combine the evidence before choosing a structure.
Mistake 6: Applying the \(n+1\) rule to every hydrogen in the molecule
The relevant number is the number of equivalent neighbouring hydrogens that produce the observed splitting, not the total number of hydrogens in the molecule. Check which groups are adjacent and whether exchangeable hydrogens are likely to affect the pattern.
07Questions and solutions
Question 1
An unknown compound has the formula \(C_3H_6O\). Its mass spectrum contains a molecular-ion peak at \(m/z = 58\) and a taller peak at \(m/z = 43\).
Calculate its relative molecular mass. Explain what each peak tells you, and state whether these two peaks alone establish the compound’s structure.
Solution 1
The relative molecular mass is 58, but the two peaks alone do not establish a unique structure.
Using the formula:
\[ \begin{aligned} M_r &= 3(12.0)+6(1.0)+16.0\\\ &=36.0+6.0+16.0\\\ &=58.0 \end{aligned} \]
The molecular-ion peak at \(m/z = 58\) is consistent with the formula.
The peak at \(m/z = 43\) is the base peak, meaning that it is the most abundant detected ion. It represents a fragment rather than the intact molecule.
A fragment at \(m/z = 43\) may support a particular structural possibility, but it is not enough to prove that structure. For example, propanone and propanal both have the formula \(C_3H_6O\) and the same relative molecular mass. Their full fragmentation patterns can help distinguish them, but these two peaks alone are insufficient for a definitive identification.
Question 2
An unknown compound is either propanoic acid or methyl ethanoate. Both have the formula \(C_3H_6O_2\) and a relative molecular mass of 74.
Its IR spectrum contains a strong absorption near \(1740\ \text{cm}^{-1}\), a strong absorption in the \(1000\)-\(1300\ \text{cm}^{-1}\) region, and no broad absorption from approximately \(2500\)-\(3300\ \text{cm}^{-1}\).
Which compound is better supported by the evidence? Explain why the molecular-ion peak at \(m/z = 74\) cannot make this decision by itself.
Solution 2
Methyl ethanoate is better supported because the IR spectrum is consistent with an ester and lacks the broad O-H absorption expected for a carboxylic acid.
The strong absorption near \(1740\ \text{cm}^{-1}\) supports the presence of a carbonyl group. The absorption in the \(1000\)-\(1300\ \text{cm}^{-1}\) region supports C-O bonds.
Together, these features are consistent with an ester. Propanoic acid would also contain a carbonyl group, but it should show a very broad carboxylic acid O-H absorption extending approximately from \(2500\) to \(3300\ \text{cm}^{-1}\).
The molecular-ion peak at \(m/z = 74\) confirms a mass consistent with both candidates. Because the compounds are structural isomers, their molecular masses are identical. The IR evidence is what favours methyl ethanoate, assuming the spectrum is clear enough for the missing O-H band to be meaningful.
Question 3
An unknown compound has the formula \(C_3H_8O\). Its IR spectrum contains a broad O-H absorption. Its proton NMR spectrum shows:
- A doublet at \(\delta = 1.2\) ppm, integrating to 6H.
- A septet at \(\delta = 3.9\) ppm, integrating to 1H.
- A broad, variable O-H signal.
The possible structures are propan-1-ol, propan-2-ol, and methoxyethane.
Identify the most likely structure. Explain the significance of the 6H integration, the doublet, and the septet.
Solution 3
The compound is propan-2-ol, \(CH_3CH(OH)CH_3\).
The broad O-H absorption in the IR spectrum supports an alcohol. This makes methoxyethane, which has no O-H bond, inconsistent with the evidence.
In propan-2-ol, the two methyl groups have equivalent chemical environments. Their six hydrogen atoms therefore produce one NMR signal integrating to 6H.
Each methyl group is next to the central carbon, which carries one hydrogen. That neighbouring hydrogen splits the methyl signal into a doublet.
The central hydrogen is adjacent to six equivalent methyl hydrogens. In the simple \(n+1\) model, \(n = 6\), so the signal is split into seven peaks, a septet.
The integrations account for seven carbon-bound hydrogens. The eighth hydrogen is the O-H hydrogen, whose NMR signal may be broad and variable. All eight hydrogens are consistent with \(C_3H_8O\).
Propan-1-ol would have three different carbon-bound proton environments rather than the distinctive 6H doublet and 1H septet pattern.
Question 4
Two possible compounds are ethyl ethanoate and methyl propanoate. Both have the formula \(C_4H_8O_2\), a relative molecular mass of 88, and IR spectra consistent with esters.
The unknown’s proton NMR spectrum shows:
- A quartet at \(\delta = 4.1\) ppm, integrating to 2H.
- A singlet at \(\delta = 2.0\) ppm, integrating to 3H.
- A triplet at \(\delta = 1.2\) ppm, integrating to 3H.
Identify the compound. Explain why the alternative structure is less consistent with the NMR evidence.
Solution 4
The compound is ethyl ethanoate, \(CH_3COOCH_2CH_3\).
The quartet at 4.1 ppm integrates to 2H and is consistent with an \(OCH_2\) group. The relatively high chemical shift supports the presence of oxygen bonded to the adjacent carbon.
The triplet at 1.2 ppm integrates to 3H and is consistent with the terminal \(CH_3\) group of an ethyl fragment. Its three hydrogens are next to the two hydrogens in the \(CH_2\) group, giving a triplet.
The singlet at 2.0 ppm integrates to 3H and is consistent with \(CH_3CO-\), the methyl group adjacent to the carbonyl.
These three environments fit ethyl ethanoate, and their integrations total eight hydrogens, as required by \(C_4H_8O_2\).
Methyl propanoate would instead contain an \(OCH_3\) group, usually producing a 3H singlet near 3.7 ppm, and a \(CH_2\) group next to the carbonyl, typically producing a quartet nearer 2.3 ppm. That is not the observed pattern.
The molecular mass and IR spectrum establish useful constraints, but the chemical shifts and splitting distinguish the two ester structures.
Question 5
An unknown compound has the formula \(C_3H_6O_2\). Its mass spectrum shows a weak molecular-ion peak at \(m/z = 74\) and a prominent fragment at \(m/z = 29\).
Its IR spectrum shows a strong C=O absorption near \(1715\ \text{cm}^{-1}\) and a very broad absorption extending approximately from \(2500\) to \(3300\ \text{cm}^{-1}\).
Its proton NMR spectrum shows:
- A triplet at \(\delta = 1.1\) ppm, integrating to 3H.
- A quartet at \(\delta = 2.4\) ppm, integrating to 2H.
No reliable third NMR signal is reported.
A student concludes that the compound must be methyl ethanoate because no O-H signal appears in the NMR spectrum. The student also argues that the weak molecular-ion peak means the relative molecular mass is not 74.
Decide between propanoic acid and methyl ethanoate. Explain how the mass spectrum, IR spectrum, NMR integrations, and splitting pattern fit together, and identify the errors in the student’s reasoning.
Solution 5
The evidence supports propanoic acid, \(CH_3CH_2COOH\), rather than methyl ethanoate.
The key is that the missing NMR signal and the weak molecular-ion peak do not override the positive evidence from the other measurements. The proposed structure must explain all the observations, including the signals that are present and the one that is not reliably observed.
Step 1: Check the molecular mass.
For \(C_3H_6O_2\),
\[ \begin{aligned} M_r &= 3(12.0)+6(1.0)+2(16.0)\\\ &=36.0+6.0+32.0\\\ &=74.0 \end{aligned} \]
The weak molecular-ion peak at \(m/z = 74\) is consistent with this mass. Its low intensity does not change the mass it represents. Some molecules fragment readily, so their intact molecular ions can be weak.
The fragment at \(m/z = 29\) is a smaller ion. It does not replace the molecular-ion peak as the measure of the intact molecule’s mass.
Step 2: Use IR to distinguish the functional groups.
The strong absorption near \(1715\ \text{cm}^{-1}\) supports a carbonyl group. The very broad absorption from approximately \(2500\) to \(3300\ \text{cm}^{-1}\) is characteristic of a carboxylic acid O-H bond.
Propanoic acid contains both groups. Methyl ethanoate contains a carbonyl group but no O-H bond, so it cannot explain the broad acid O-H absorption as well.
This is strong positive evidence for propanoic acid.
Step 3: Interpret the two NMR signals.
The triplet at 1.1 ppm integrates to 3H. This is consistent with a terminal \(CH_3\) group next to a \(CH_2\) group.
The quartet at 2.4 ppm integrates to 2H. This is consistent with a \(CH_2\) group adjacent to a carbonyl, which shifts its hydrogens downfield compared with an ordinary saturated alkyl group.
Together, the triplet and quartet support the fragment \(CH_3CH_2-\). In propanoic acid, this fragment is attached to the carboxyl group:
\[ CH_3CH_2COOH \]
The integrations account for five carbon-bound hydrogens. The formula contains six hydrogens, leaving one hydrogen for the carboxylic acid O-H group.
Step 4: Explain the missing NMR signal.
The absence of a reliably observed O-H signal does not rule out propanoic acid. Exchangeable hydrogens can produce broad, variable, or poorly integrated NMR signals.
The important distinction is between not reliably observing a signal and proving that the corresponding bond is absent. The IR spectrum provides independent, strong evidence for the acid O-H bond.
Step 5: Test the alternative structure.
Methyl ethanoate, \(CH_3COOCH_3\), would be expected to show two main proton environments, each integrating to 3H: an \(OCH_3\) singlet near 3.7 ppm and a \(CH_3CO-\) singlet near 2.0 ppm.
That does not match the observed 3H triplet and 2H quartet. Methyl ethanoate also cannot explain the broad carboxylic acid O-H absorption.
The student’s conclusion fails for two reasons: a weak molecular-ion peak can still indicate \(M_r = 74\), and a missing O-H NMR signal does not prove that the molecule lacks an O-H bond.
Propanoic acid is the structure that best fits the molecular mass, the IR bands, the ethyl-group NMR pattern, and the hydrogen count. The next useful step, when more than one structure still fits, is to compare the full spectra with reliable reference spectra or use an additional selective chemical test rather than forcing a conclusion from a single peak.