
How to Identify an Organic Structure Using MS, IR and NMR
Learn how to identify an unknown organic compound by combining mass spectrometry, IR, proton NMR, and carbon-13 NMR. Follow a fully worked HSC Chemistry example, compare ester isomers, and practise checking whether a proposed structure fits all the evidence.
A mass spectrum shows a molecular-ion peak at \(m/z=88\). The infrared (IR) spectrum has a strong absorption near \(1740\ \mathrm{cm^{-1}}\), and the proton NMR spectrum has three signals with integrations in the ratio \(3:3:2\). Can you identify the molecule, or could several structures still fit?
Before reading on, predict whether the carbonyl absorption proves that the compound is an ester. It doesn’t. Carboxylic acids also contain a carbonyl group, and different esters can share the same molecular formula and molecular mass.
The reliable approach is to make each spectrum constrain the next. Mass spectrometry narrows the possibilities, IR identifies likely functional groups, and nuclear magnetic resonance (NMR) reveals the environments of the atoms. Your final structure must explain all the evidence, not just one impressive peak.
Spectroscopic evidence and the required feedback loop
| Mass spectrometry and IR | MS: the molecular ion at m/z 88 and fragment at m/z 43 constrain molecular mass and fragmentation. IR: absorption near 1740 cm⁻¹ supports a carbonyl group but does not prove the compound is an ester. |
|---|---|
| NMR evidence | ¹H NMR: integration ratio 3:3:2 constrains the relative numbers of hydrogen nuclei in distinct environments. ¹³C NMR: carbon signals constrain the number and types of distinct carbon environments. |
| Required relationships not supported | All four spectroscopic methods must converge on one proposed molecular structure. If the proposed structure contradicts any spectrum, a return arrow must indicate reconsideration of the structure. The available schema cannot draw this converging flow with a feedback loop; a custom SVG construction is required. |
01Step 1: Use mass spectrometry to establish the boundaries
Start with the molecular ion, then look at the fragments.
For this worked investigation, the supplied molecular formula is \(\ce{C4H8O2}\). The mass spectrum contains a molecular-ion peak at \(m/z=88\) and a particularly strong fragment peak at \(m/z=43\).
The formula is supplied for this example because a peak at \(m/z=88\) alone does not establish a unique molecular formula.
Check the molecular mass
The molecular ion is formed when the molecule becomes a positive ion. In a conventional electron-impact mass spectrum, it is commonly represented as \(M^{+\bullet}\).
The quantity \(m/z\) is the mass-to-charge ratio. For a singly charged ion, its numerical value is approximately the ion’s mass in atomic mass units.
Using the rounded atomic masses commonly used in HSC calculations, the molar mass of \(\ce{C4H8O2}\) is
\[ \begin{aligned} M &= 4(12.0)+8(1.0)+2(16.0)\\ &= 48.0+8.0+32.0\\ &= 88.0\ \mathrm{g\,mol^{-1}} \end{aligned} \]
The molecular-ion peak at \(m/z=88\) is consistent with this formula.
That is a useful first check, but it doesn’t distinguish structural isomers. Ethyl ethanoate, methyl propanoate, and butanoic acid all have the formula \(\ce{C4H8O2}\) and a molar mass of approximately \(88\ \mathrm{g\,mol^{-1}}\).
Calculate the degree of unsaturation
A molecular formula also tells you how many rings and multiple bonds a structure can contain.
The degree of unsaturation (DBE) is calculated using
\[ \mathrm{DBE}=\frac{2C+2+N-H-X}{2} \]
Here, \(C\), \(H\), and \(N\) are the numbers of carbon, hydrogen, and nitrogen atoms, respectively. \(X\) is the total number of halogen atoms. Oxygen is omitted from the equation.
For \(\ce{C4H8O2}\),
\[ \begin{aligned} \mathrm{DBE} &=\frac{2(4)+2-8}{2}\\ &=\frac{2}{2}\\ &=1 \end{aligned} \]
A DBE of 1 means the structure has one ring or one double bond, assuming a conventional neutral organic structure.
A carbonyl group, \(\ce{C=O}\), contains one double bond and accounts for one degree of unsaturation. If the IR spectrum confirms a carbonyl group, the formula leaves no additional unsaturation for another double bond or ring.
This is our first constraint.
Interpret the fragment at \(m/z=43\)
The base peak is the tallest peak in a mass spectrum. It represents the most abundant detected ion, not necessarily the molecular ion.
For our compound, a plausible assignment for the strong \(m/z=43\) peak is the acetyl ion, \(\ce{CH3CO+}\). This fragment would be consistent with a structure containing a \(\ce{CH3CO-}\) group.
However, don’t treat that assignment as certain from the nominal mass alone. For example, \(\ce{C3H7+}\) also has a nominal mass of 43. Fragmentation patterns must be interpreted alongside the other spectra.
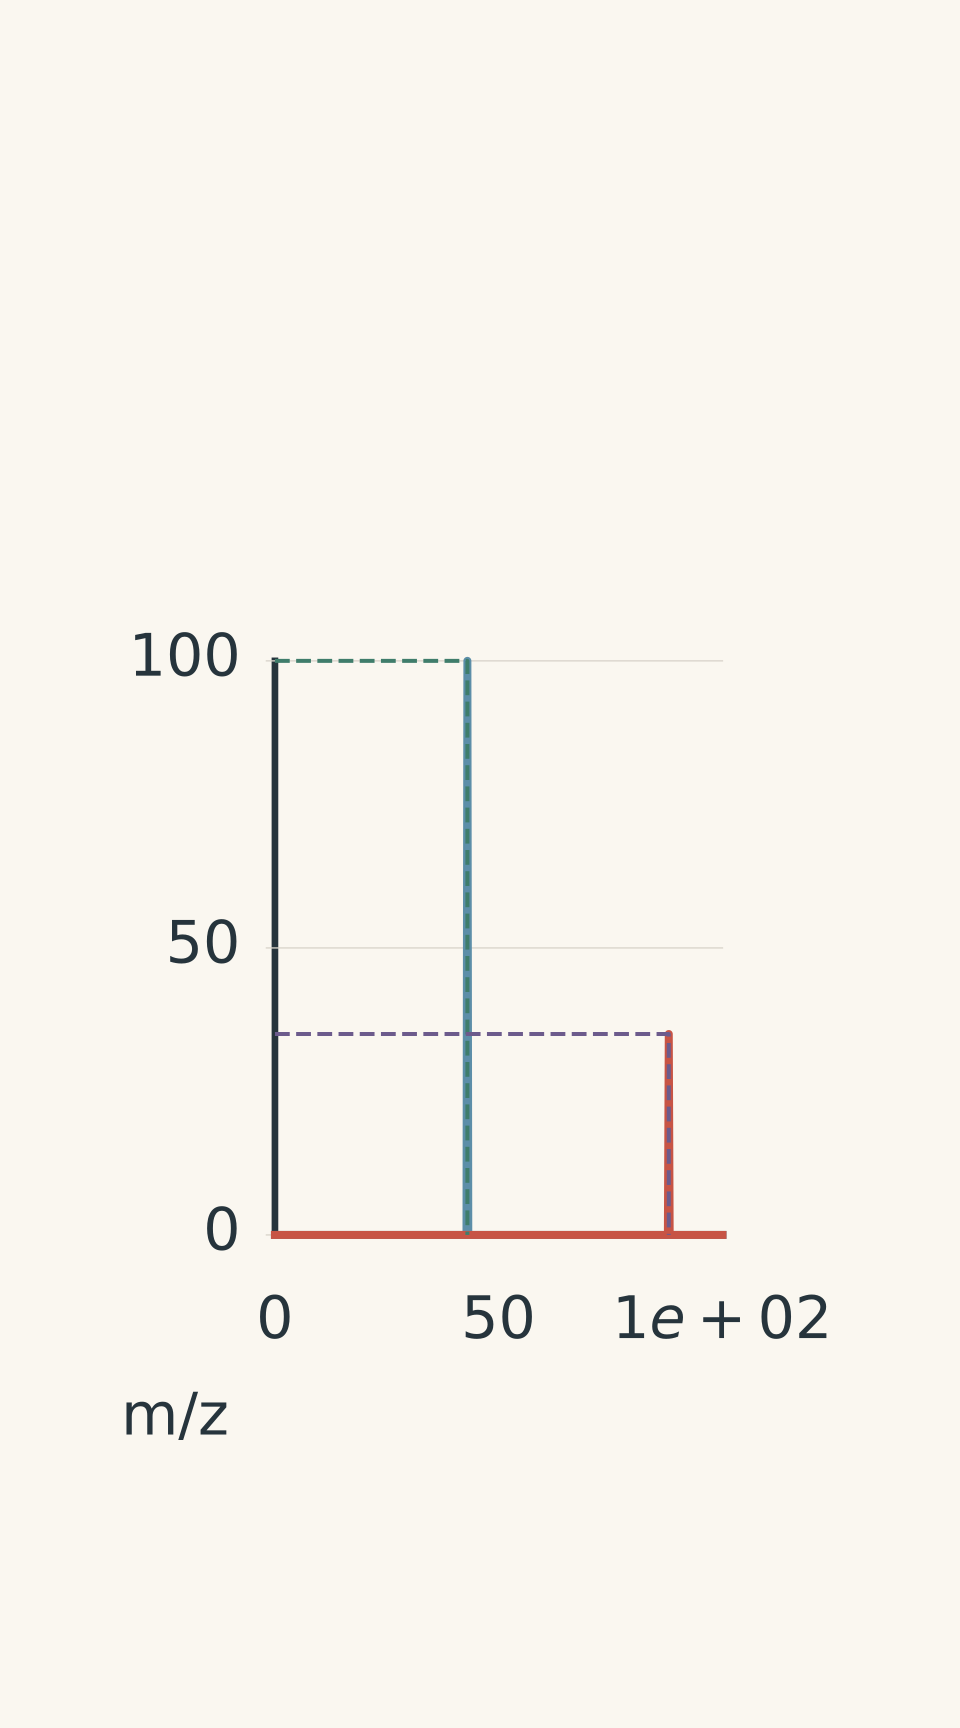
- Fragment ion
- Molecular ion
- possible CH3CO+
- M+
Worked example: Calculate the degree of unsaturation
An unknown organic compound has the formula \(\ce{C4H8O2}\), a molecular-ion peak at \(m/z=88\), and a base peak at \(m/z=43\). Calculate its molar mass and degree of unsaturation, then explain what the fragment peak suggests.
Step 1
\[ \begin{aligned} M &= 4(12.0)+8(1.0)+2(16.0)\\ &=88.0\ \mathrm{g\,mol^{-1}} \end{aligned} \]
The molecular-ion peak at \(m/z=88\) is consistent with this molar mass.
Step 2
\[ \mathrm{DBE}=\frac{2(4)+2-8}{2}=1 \]
The molecule has one degree of unsaturation. If it contains a carbonyl group, that double bond accounts for the unsaturation.
Step 3
The \(m/z=43\) peak is consistent with the acetyl ion, \(\ce{CH3CO+}\), which suggests a possible acetyl group in the original molecule.
The result is a useful hypothesis, not a complete identification. IR and NMR must determine whether the proposed group fits the rest of the structure.
02Step 2: Use IR to identify the functional group
Mass spectrometry has constrained the formula, but it hasn’t told us whether the compound is an ester, a carboxylic acid, or another type of organic molecule.
IR spectroscopy helps answer that question. Different bonds absorb infrared radiation at characteristic ranges of wavenumber, allowing us to identify likely functional groups.
For our unknown, the important observations are:
| IR observation | Likely interpretation |
|---|---|
| Strong absorption near \(1740\ \mathrm{cm^{-1}}\) | A carbonyl, \(\ce{C=O}\), consistent with a saturated ester |
| Strong absorptions in the \(1050\)-\(1300\ \mathrm{cm^{-1}}\) region | Consistent with C-O bonds |
| No broad O-H absorption | Argues against a carboxylic acid or alcohol |
A saturated ester commonly has a strong carbonyl absorption around \(1735\)-\(1750\ \mathrm{cm^{-1}}\). The precise position can vary with the compound and its environment.
The C-O absorptions provide additional support for an ester. An ester contains a carbonyl group and a single-bonded oxygen linking the carbonyl-containing group to another carbon-containing group.
Why not a carboxylic acid?
A carboxylic acid also contains a carbonyl group, so the carbonyl absorption alone cannot distinguish an acid from an ester.
The important extra clue is the O-H region. Carboxylic acids typically show a very broad O-H absorption extending roughly across \(2500\)-\(3300\ \mathrm{cm^{-1}}\). Alcohols generally show a broad O-H absorption at higher wavenumbers, often around \(3200\)-\(3600\ \mathrm{cm^{-1}}\).
Our spectrum has no broad O-H feature. Together with the carbonyl and C-O absorptions, this supports an ester structure.
The absence of a band is useful evidence, although it should be treated cautiously if the spectrum is incomplete or poor quality.
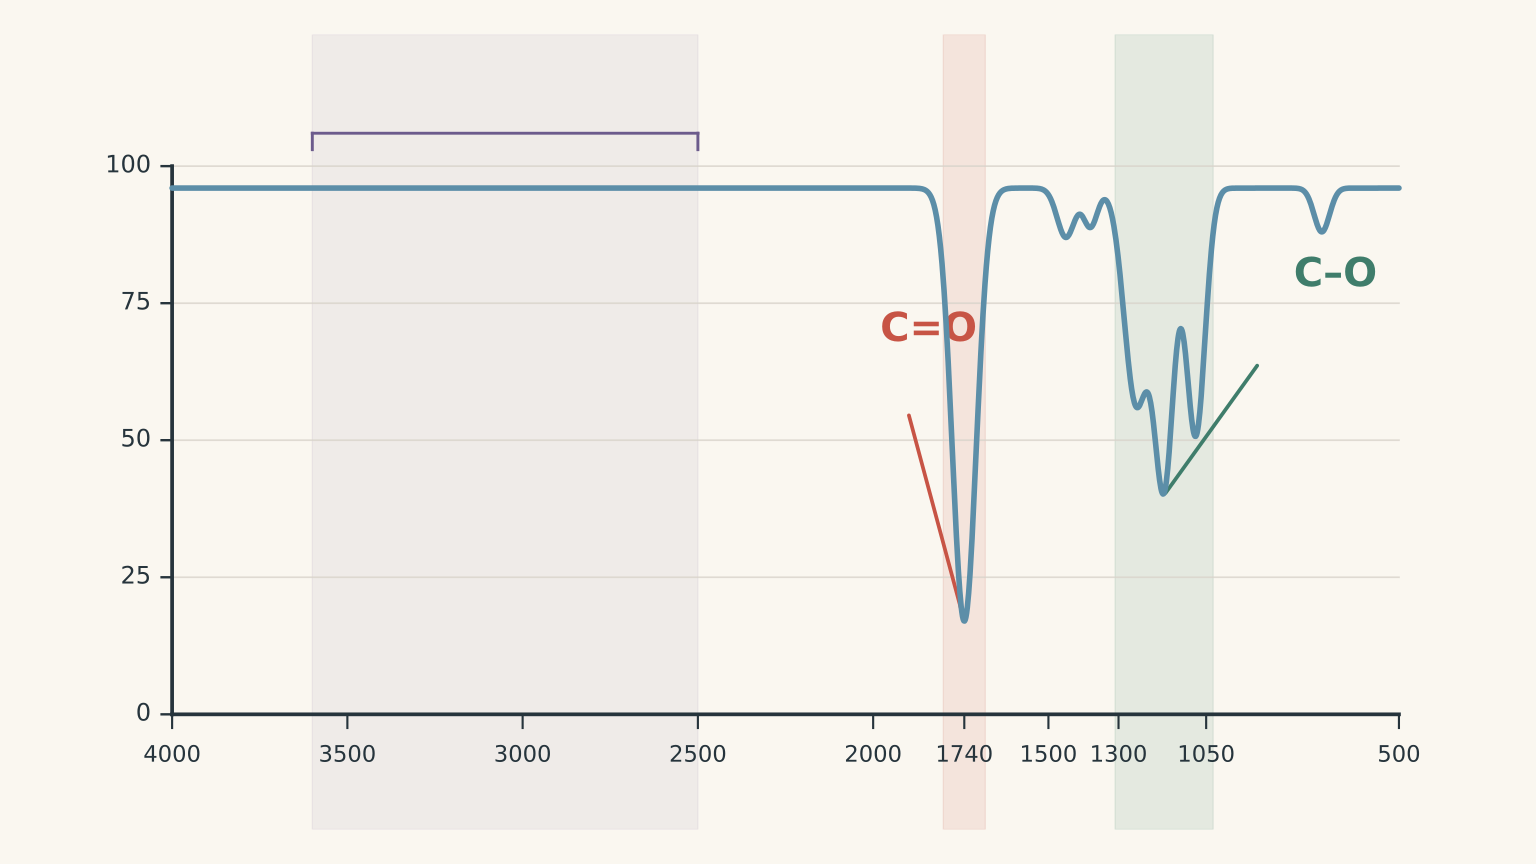
At this stage, we have a likely functional group. We still don’t know which ester is present.
Ethyl ethanoate and methyl propanoate both fit the formula and the IR evidence. To distinguish them, we need information about the hydrogen and carbon environments.
03Step 3: Use proton NMR to identify hydrogen environments
Proton NMR, also called \(^1\mathrm{H}\) NMR, tells us about the different environments of hydrogen atoms in a molecule.
Three features are especially useful:
- Chemical shift, \(\delta\), measured in parts per million (ppm), indicates the electronic environment of the hydrogen atoms.
- Integration indicates the relative number of hydrogen atoms responsible for a signal.
- Splitting gives information about neighbouring hydrogen atoms.
Here is the proton NMR data for our unknown.
| Chemical shift, \(\delta\) | Signal pattern | Integration |
|---|---|---|
| \(4.12\ \mathrm{ppm}\) | Quartet | 2H |
| \(2.05\ \mathrm{ppm}\) | Singlet | 3H |
| \(1.25\ \mathrm{ppm}\) | Triplet | 3H |
Let’s interpret the signals one at a time.
The quartet at 4.12 ppm
The signal integrates to two hydrogen atoms, so it is consistent with a \(\ce{CH2}\) group.
For a simple first-order spectrum, the \(n+1\) rule predicts that a group of hydrogen atoms is split into \(n+1\) peaks by \(n\) equivalent neighbouring hydrogens.
A quartet has four peaks, so the two hydrogens responsible for this signal have three equivalent neighbouring hydrogens.
The chemical shift is also important. A \(\ce{CH2}\) group attached directly to oxygen is typically shifted downfield compared with an ordinary alkyl \(\ce{CH2}\) group. Oxygen draws electron density away from nearby hydrogen atoms, leaving them deshielded.
The combination of a two-hydrogen integration, a quartet, and a chemical shift near \(4.12\ \mathrm{ppm}\) strongly suggests an \(\ce{O-CH2-CH3}\) fragment.
The triplet at 1.25 ppm
This signal integrates to three hydrogen atoms, so it is consistent with a \(\ce{CH3}\) group.
The triplet indicates two equivalent neighbouring hydrogens. That fits a terminal methyl group next to a \(\ce{CH2}\) group:
\[ \ce{-CH2-CH3} \]
The quartet and triplet therefore form a matching pair. Together, they support an ethyl group.
The singlet at 2.05 ppm
This signal integrates to three hydrogen atoms, suggesting another \(\ce{CH3}\) group.
Its chemical shift is consistent with a methyl group attached to a carbonyl-containing group, as in
\[ \ce{CH3-C(=O)-} \]
Why is the signal a singlet? In this structure, the carbonyl carbon next to the methyl group has no hydrogen atoms attached to it. There are therefore no neighbouring hydrogens on that adjacent carbon to produce the usual \(n+1\) splitting pattern.
This is consistent with an acetyl group.
Check the total integration
The integrations add to
\[ 2+3+3=8\text{ hydrogen atoms} \]
That matches the eight hydrogen atoms in \(\ce{C4H8O2}\).
This check is easy to overlook. If the total integration doesn’t match the molecular formula, consider whether a signal is missing, the integrations have been interpreted incorrectly, or the proposed structure is wrong.
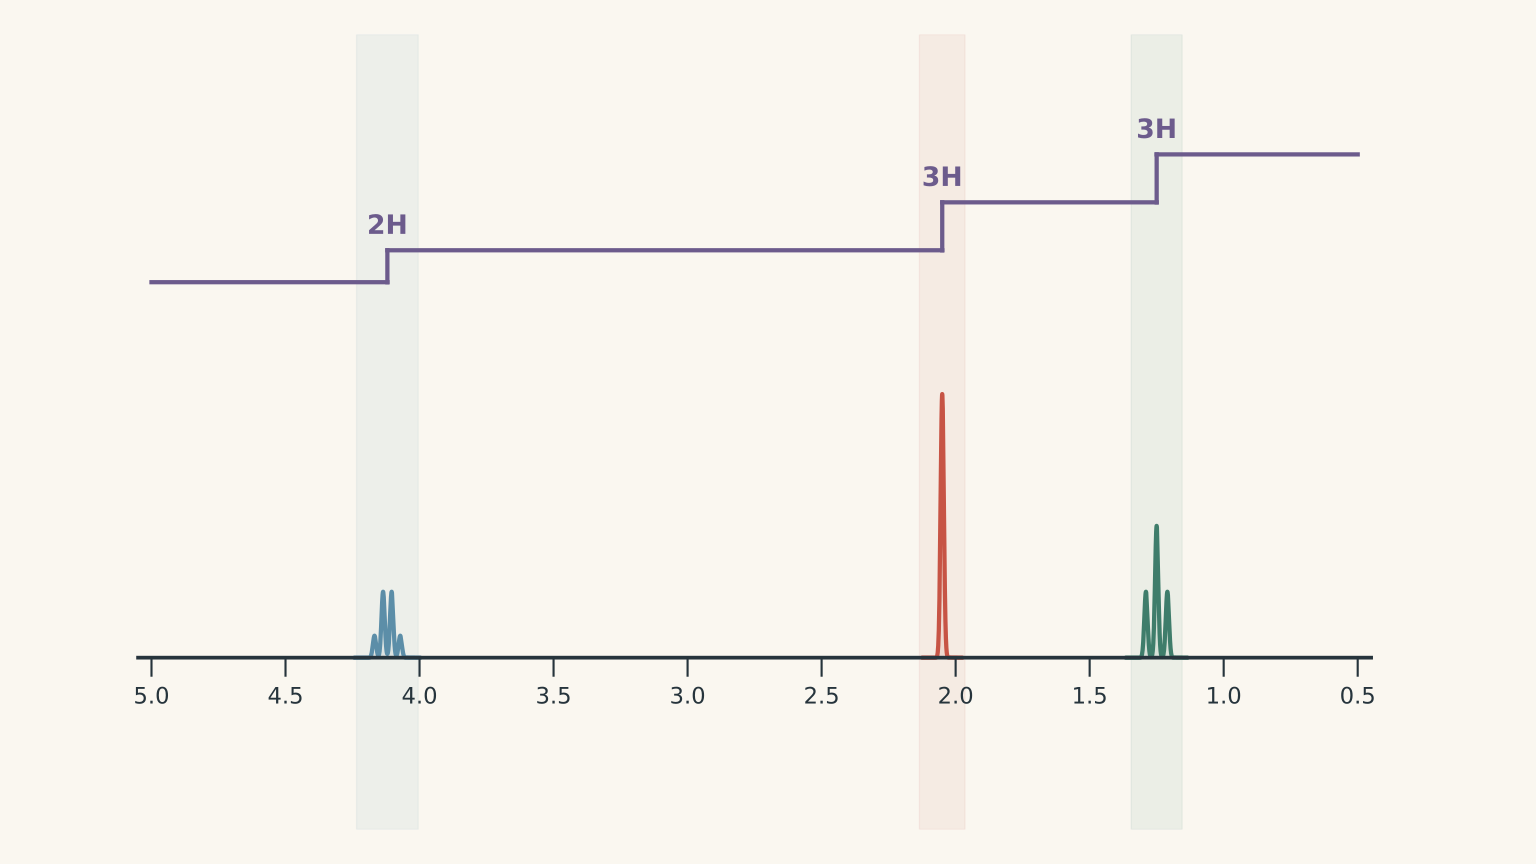
We now have two structural pieces:
- An ethyl group attached through oxygen, \(\ce{-O-CH2-CH3}\).
- A methyl group attached to a carbonyl carbon, \(\ce{CH3-C(=O)-}\).
These fragments point towards ethyl ethanoate. Before committing, check the carbon-13 NMR spectrum.
04Step 4: Use carbon-13 NMR to check every carbon
Carbon-13 NMR, written \(^ {13}\mathrm{C}\) NMR, shows the different carbon environments in a molecule.
For a typical proton-decoupled carbon-13 spectrum, each distinct carbon environment produces a signal. Equivalent carbons can share one signal, so the number of signals does not always equal the total number of carbon atoms.
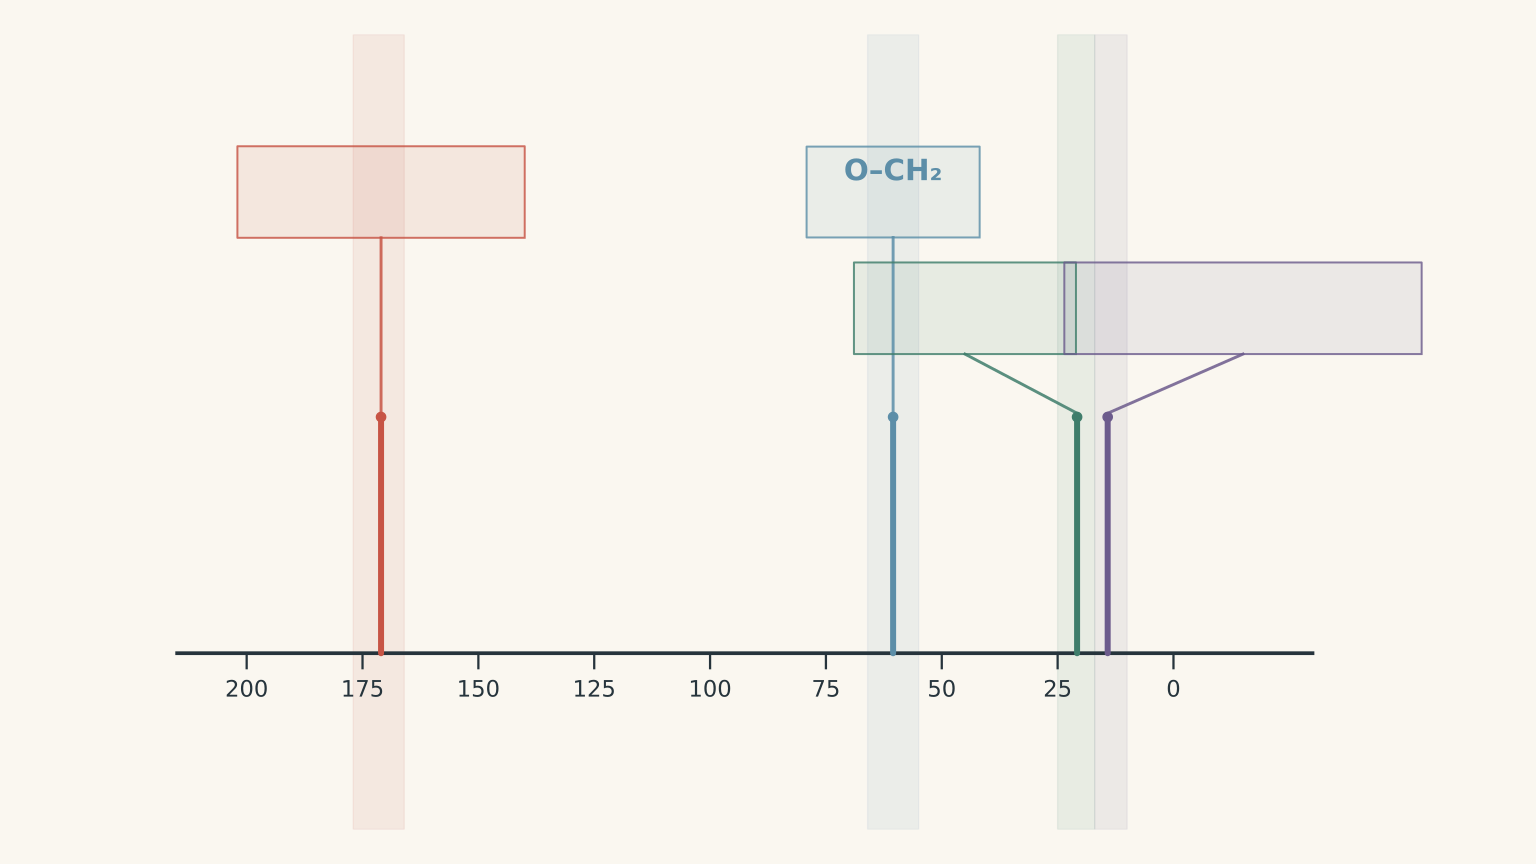
Our unknown has four carbon atoms and four carbon-13 signals:
| Chemical shift, \(\delta\) | Likely carbon environment |
|---|---|
| \(171.0\ \mathrm{ppm}\) | Ester carbonyl carbon, \(\ce{C=O}\) |
| \(60.5\ \mathrm{ppm}\) | Carbon in \(\ce{O-CH2-}\) |
| \(20.8\ \mathrm{ppm}\) | Methyl carbon in \(\ce{CH3-C(=O)-}\) |
| \(14.2\ \mathrm{ppm}\) | Terminal methyl carbon in \(\ce{-CH2-CH3}\) |
The signal near \(171\ \mathrm{ppm}\) supports an ester carbonyl. The signal near \(60\ \mathrm{ppm}\) is consistent with a carbon attached directly to oxygen.
The other two signals fit the methyl groups identified in the proton NMR.
Notice how the spectra reinforce one another. The proton NMR suggests an oxygen-bound \(\ce{CH2}\) group and an acetyl methyl group. The carbon-13 NMR independently supports the corresponding carbon environments.
Assemble the structure
We can now combine the fragments:
\[ \ce{CH3-C(=O)-O-CH2-CH3} \]
The structure is ethyl ethanoate, also commonly called ethyl acetate.
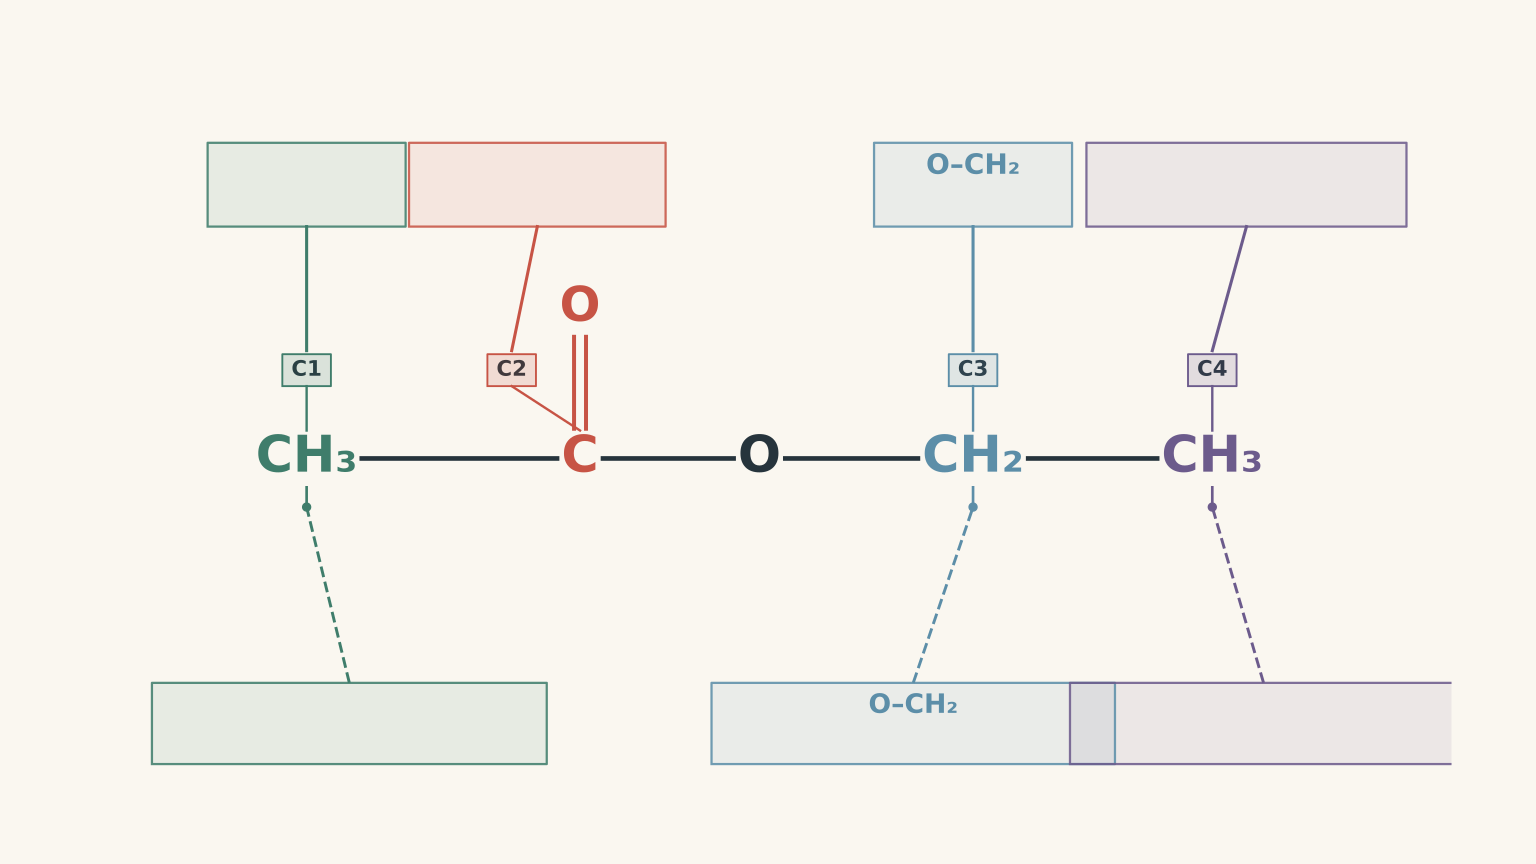
The proposed structure accounts for the full data set:
- Molecular formula: \(\ce{C4H8O2}\).
- Molecular-ion peak: \(m/z=88\).
- Degree of unsaturation: 1, accounted for by the carbonyl double bond.
- IR spectrum: ester carbonyl and C-O absorptions, without a broad O-H band.
- Proton NMR: three hydrogen environments with the correct integrations and splitting.
- Carbon-13 NMR: four distinct carbon environments consistent with the proposed structure.
- Fragmentation: a strong \(m/z=43\) peak consistent with a possible acetyl ion.
No carbon, oxygen, or hydrogen atoms are left unexplained.
Worked example: Distinguish two ester isomers
An unknown has formula \(\ce{C4H8O2}\), a molecular-ion peak at \(m/z=88\), an IR absorption near \(1740\ \mathrm{cm^{-1}}\), strong C-O absorptions, and no broad O-H band.
Its proton NMR signals are at \(4.12\ \mathrm{ppm}\) (quartet, 2H), \(2.05\ \mathrm{ppm}\) (singlet, 3H), and \(1.25\ \mathrm{ppm}\) (triplet, 3H). Its carbon-13 NMR signals are at 171.0, 60.5, 20.8, and 14.2 ppm.
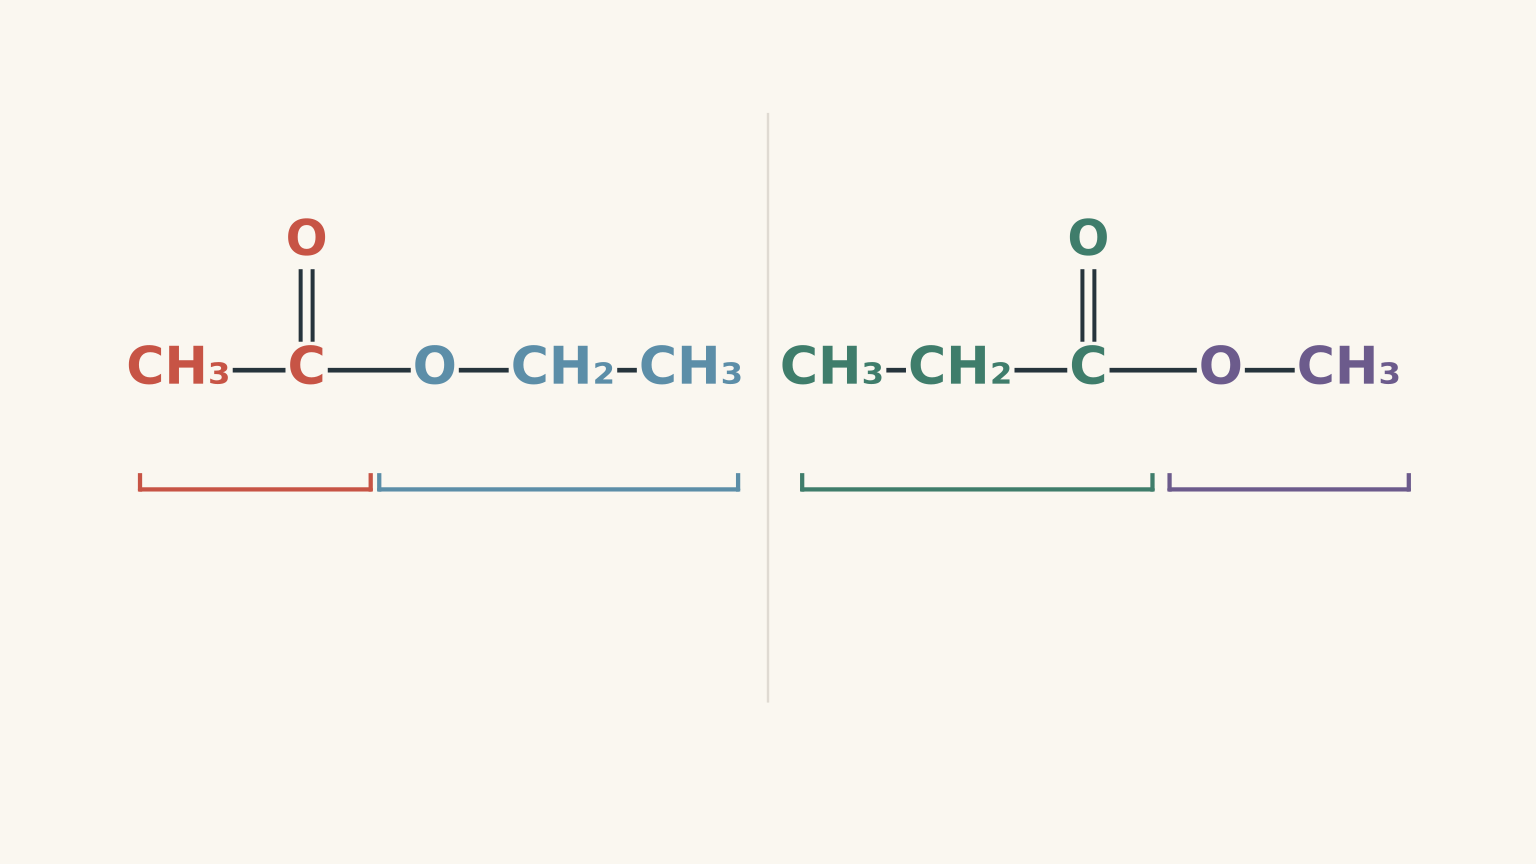
Determine which structure fits the data: ethyl ethanoate, \(\ce{CH3COOCH2CH3}\), or methyl propanoate, \(\ce{CH3CH2COOCH3}\).
Step 1
Both candidates have the formula \(\ce{C4H8O2}\), a molar mass of approximately \(88\ \mathrm{g\,mol^{-1}}\), and one degree of unsaturation. Both are esters, so both can produce a strong carbonyl absorption and C-O absorptions.
Mass spectrometry and IR have narrowed the possibilities, but neither has distinguished these two isomers.
Step 2
The quartet at \(4.12\ \mathrm{ppm}\) integrates to 2H, which supports an oxygen-bound \(\ce{CH2}\) group. The triplet at \(1.25\ \mathrm{ppm}\) integrates to 3H, matching the terminal methyl group of an ethyl fragment.
The singlet at \(2.05\ \mathrm{ppm}\) is consistent with \(\ce{CH3-C(=O)-}\).
These groups fit ethyl ethanoate.
Methyl propanoate instead contains a methoxy group, \(\ce{-OCH3}\), which would normally produce a three-hydrogen singlet around \(3.7\ \mathrm{ppm}\). It also contains a \(\ce{CH2}\) group next to the carbonyl, which would typically produce a signal around \(2.3\ \mathrm{ppm}\).
Those are not the observed proton environments.
Step 3
The signal at \(60.5\ \mathrm{ppm}\) supports \(\ce{O-CH2-}\), while the signals at 20.8 and 14.2 ppm support the acetyl methyl and terminal ethyl methyl groups.
Methyl propanoate would instead be expected to show an oxygen-bound methyl carbon near 51 ppm, a carbonyl-adjacent \(\ce{CH2}\) carbon near 27 ppm, and a terminal methyl carbon near 9-10 ppm.
The observed carbon-13 shifts agree much more closely with ethyl ethanoate.
Step 4
Ethyl ethanoate is the correct structure. Methyl propanoate fits the formula and the general IR pattern, but it fails the detailed proton and carbon NMR tests.
The important lesson is that two structures can pass the same early checks. You need the later evidence to distinguish their connectivity.
05Common mistakes when solving an unknown structure
Mistake 1: Treating the base peak as the molecular ion
The base peak is the most abundant ion, not necessarily the intact molecule. Use the molecular-ion peak to constrain the molecular mass, then interpret the fragments separately.
Mistake 2: Assuming a carbonyl proves an ester
An aldehyde, ketone, carboxylic acid, and ester can all contain a carbonyl group. Examine the other IR absorptions, particularly the O-H region and C-O region, before assigning a functional group.
Mistake 3: Counting NMR signals as atoms
Three proton NMR signals do not mean the molecule contains three hydrogen atoms or three carbons. The signals represent distinct hydrogen environments. Integration estimates how many hydrogens contribute to each signal.
Similarly, four carbon-13 signals indicate four distinct carbon environments in this example, not a universal rule that every molecule with four carbons must produce four signals.
Mistake 4: Forcing the structure to fit one memorable peak
A strong \(m/z=43\) peak is consistent with an acetyl ion, but nominal mass alone does not prove that assignment. A carbonyl band near \(1740\ \mathrm{cm^{-1}}\) is consistent with an ester, but it doesn’t establish the arrangement of its carbon atoms.
A defensible structure should account for the molecular formula, degree of unsaturation, diagnostic IR bands, proton integrations and splitting, and carbon environments. If one important observation contradicts the proposed structure, reconsider the structure rather than ignoring the evidence.
06Questions and solutions
Question 1
An unknown has the molecular formula \(\ce{C4H8O2}\), a molecular-ion peak at \(m/z=88\), and a strong IR absorption near \(1740\ \mathrm{cm^{-1}}\).
Calculate its degree of unsaturation and explain what the IR result suggests. Does the IR absorption alone prove that the compound is an ester?
Solution 1
The degree of unsaturation is 1, and the IR absorption is consistent with a carbonyl group, but it does not prove that the compound is an ester.
Using the formula
\[ \begin{aligned} \mathrm{DBE} &=\frac{2C+2+N-H-X}{2}\\ &=\frac{2(4)+2-8}{2}\\ &=1 \end{aligned} \]
The molecule has one degree of unsaturation. A carbonyl double bond would account for that unsaturation.
A strong absorption near \(1740\ \mathrm{cm^{-1}}\) is consistent with the carbonyl group of a saturated ester. However, carboxylic acids also contain carbonyl groups. The other IR features, particularly the broad O-H region and C-O absorptions, are needed to distinguish the likely functional group.
Question 2
The proton NMR spectrum of a compound with formula \(\ce{C4H8O2}\) contains these signals:
- \(1.25\ \mathrm{ppm}\): triplet, 3H
- \(2.05\ \mathrm{ppm}\): singlet, 3H
- \(4.12\ \mathrm{ppm}\): quartet, 2H
Identify the likely hydrogen environments. Explain how the integration, splitting, and chemical shifts support your assignments, and show that the total integration is consistent with the molecular formula.
Solution 2
The signals are consistent with an ethyl group attached through oxygen and a separate methyl group attached to a carbonyl carbon.
The triplet at \(1.25\ \mathrm{ppm}\) integrates to 3H. It is consistent with a terminal \(\ce{CH3}\) group next to a \(\ce{CH2}\) group. The two neighbouring hydrogens split the signal into a triplet under the \(n+1\) rule.
The quartet at \(4.12\ \mathrm{ppm}\) integrates to 2H. It is consistent with an oxygen-bound \(\ce{CH2}\) group next to a methyl group. The three neighbouring hydrogens produce a quartet, while the oxygen shifts the signal downfield.
The singlet at \(2.05\ \mathrm{ppm}\) integrates to 3H. Its chemical shift is consistent with \(\ce{CH3-C(=O)-}\). The adjacent carbonyl carbon has no hydrogen atoms, so the methyl group has no neighbouring hydrogens on that carbon to produce the usual splitting.
The total integration is
\[ 3+3+2=8\text{ H} \]
This matches the eight hydrogens in \(\ce{C4H8O2}\). The pattern supports the fragments \(\ce{-OCH2CH3}\) and \(\ce{CH3CO-}\).
Question 3
Three possible structures for a compound with formula \(\ce{C4H8O2}\) are butanoic acid, ethyl ethanoate, and methyl propanoate.
The IR spectrum shows a strong absorption near \(1740\ \mathrm{cm^{-1}}\), strong C-O absorptions, and no broad O-H band. The proton NMR spectrum contains a quartet at \(4.12\ \mathrm{ppm}\) integrating to 2H, a singlet at \(2.05\ \mathrm{ppm}\) integrating to 3H, and a triplet at \(1.25\ \mathrm{ppm}\) integrating to 3H.
Identify the structure that best fits the data. Explain which candidates are eliminated by the IR and proton NMR evidence.
Solution 3
Ethyl ethanoate is the structure that best fits the complete data set.
Butanoic acid is disfavoured by the absence of the very broad O-H absorption expected for a carboxylic acid. The strong C-O absorptions and carbonyl position instead support an ester. This conclusion assumes that the supplied IR spectrum is sufficiently complete and of good quality.
Both ethyl ethanoate and methyl propanoate remain plausible after the IR analysis because both are esters with the same molecular formula.
The proton NMR distinguishes them. Ethyl ethanoate contains an oxygen-bound \(\ce{CH2}\) group, consistent with the two-hydrogen quartet at \(4.12\ \mathrm{ppm}\), and an acetyl methyl group, consistent with the three-hydrogen singlet at \(2.05\ \mathrm{ppm}\). The terminal methyl group produces the triplet at \(1.25\ \mathrm{ppm}\).
Methyl propanoate would instead contain an \(\ce{OCH3}\) group and a carbonyl-adjacent \(\ce{CH2}\) group. Their expected chemical shifts and integrations do not match the observed pattern.
The IR spectrum identifies the likely functional group, while the proton NMR distinguishes the ester isomers.
Question 4
For the same unknown, the carbon-13 NMR spectrum contains signals at 171.0, 60.5, 20.8, and 14.2 ppm. The mass spectrum has a strong base peak at \(m/z=43\).
Assign each carbon-13 signal to a carbon environment. A student argues that the base peak at \(m/z=43\) proves the structure is ethyl ethanoate, making the carbon-13 spectrum unnecessary. Assess this claim.
Solution 4
The four carbon-13 signals support ethyl ethanoate, but the base peak at \(m/z=43\) does not prove that structure by itself.
The signal at 171.0 ppm is consistent with the ester carbonyl carbon. The signal at 60.5 ppm corresponds to the carbon in \(\ce{O-CH2-}\). The signal at 20.8 ppm is consistent with the methyl carbon in \(\ce{CH3-C(=O)-}\), and the signal at 14.2 ppm corresponds to the terminal methyl carbon of the ethyl group.
These assignments account for all four carbon atoms and agree with the fragments identified by proton NMR.
The student’s claim is incorrect because a nominal mass of 43 does not uniquely identify an acetyl ion. Other ions, including \(\ce{C3H7+}\), can also have a nominal mass of 43. The fragment is a useful clue, but it must be interpreted alongside the rest of the evidence.
The carbon-13 spectrum is not redundant. It independently checks the carbon environments and helps distinguish structures with the same molecular formula and functional group.
Question 5
Two pure compounds, A and B, have the molecular formula \(\ce{C4H8O2}\), a molecular-ion peak at \(m/z=88\), and IR spectra consistent with saturated esters.
Their NMR data are shown below. Chemical shifts are approximate, and each list contains all the relevant signals.
| Data | Compound A | Compound B |
|---|---|---|
| Proton NMR | 1.25 ppm (triplet, 3H); 2.05 ppm (singlet, 3H); 4.12 ppm (quartet, 2H) | 1.10 ppm (triplet, 3H); 2.30 ppm (quartet, 2H); 3.70 ppm (singlet, 3H) |
| Carbon-13 NMR | 171.0, 60.5, 20.8, 14.2 ppm | 174, 51, 27, 9.5 ppm |
(a) Identify A and B from the following structures:
- Ethyl ethanoate: \(\ce{CH3COOCH2CH3}\)
- Methyl propanoate: \(\ce{CH3CH2COOCH3}\)
(b) A third report contains the proton NMR data from A but the carbon-13 NMR data from B. Its molecular-ion peak remains at \(m/z=88\), and its IR spectrum still appears consistent with an ester.
Can a third structural isomer reasonably explain the mixed report? Explain which connectivity each NMR spectrum requires, why the mass and IR data cannot resolve the conflict, and what should be checked before accepting a structure.
Solution 5
Compound A is ethyl ethanoate, and compound B is methyl propanoate. The mixed report does not support a third structure: under the stated assumptions, its proton and carbon-13 NMR data are inconsistent with one another.
For compound A, the proton NMR shows a three-hydrogen triplet and a two-hydrogen quartet, indicating an ethyl group. The quartet at \(4.12\ \mathrm{ppm}\) places the \(\ce{CH2}\) group next to oxygen. The three-hydrogen singlet at \(2.05\ \mathrm{ppm}\) supports a methyl group attached to a carbonyl carbon.
Together, these signals fit \(\ce{CH3COOCH2CH3}\), ethyl ethanoate. Its carbon-13 signals agree: 171.0 ppm for the ester carbonyl, 60.5 ppm for \(\ce{OCH2}\), 20.8 ppm for the acetyl methyl, and 14.2 ppm for the terminal ethyl methyl.
Compound B has a different pattern. Its three-hydrogen singlet at \(3.70\ \mathrm{ppm}\) is consistent with \(\ce{OCH3}\). Its two-hydrogen quartet at \(2.30\ \mathrm{ppm}\) is consistent with a \(\ce{CH2}\) group next to a carbonyl, while the three-hydrogen triplet at \(1.10\ \mathrm{ppm}\) fits the terminal methyl of an ethyl group.
Those environments fit \(\ce{CH3CH2COOCH3}\), methyl propanoate. Its carbon-13 signals also agree: approximately 174 ppm for the ester carbonyl, 51 ppm for \(\ce{OCH3}\), 27 ppm for the carbonyl-adjacent \(\ce{CH2}\), and 9.5 ppm for the terminal methyl carbon.
Now consider the mixed report.
The proton NMR data from A require an oxygen-bound \(\ce{CH2}\) group and an acetyl methyl group. The carbon-13 data from B instead indicate an oxygen-bound \(\ce{CH3}\) group and a carbonyl-adjacent \(\ce{CH2}\) group. These are different arrangements of the atoms.
The shared molecular formula cannot resolve the conflict because both structures have the same numbers of carbon, hydrogen, and oxygen atoms. The IR spectra also cannot resolve it because both structures are esters with a carbonyl and C-O bonds.
The correct conclusion is that the mixed report is inconsistent with a single pure compound, assuming the data are complete and correctly assigned. Before proposing another structure, check the sample identification, whether spectra from different compounds have been combined, and whether a peak table contains a transcription error.
The deeper skill is learning to predict the spectra of candidate structures before selecting one. For each isomer, draw the connectivity, count its distinct hydrogen and carbon environments, and determine which signals it should produce. Then compare those predictions against the measured data. A strong structural assignment survives every independent check.