
How to Design a Fair Reaction-Rate Chemistry Practical
Learn how to measure reaction rates using gas volume, mass loss, and visible endpoints. Follow practical examples to control variables, analyse graphs, improve reliability, and evaluate experimental limitations for HSC Chemistry.
Two students react the same mass of calcium carbonate with hydrochloric acid. One collects 40 cm³ of carbon dioxide in 25 seconds. The other collects the same 40 cm³ in 70 seconds. Which reaction was faster?
The first reaction. Both produced the same final volume of gas, but one produced it much more quickly.
Now imagine you are designing a practical to investigate how acid concentration affects reaction rate. If you measure only the final volume of gas, you could miss the most important difference between your reactions. You need measurements that show how the reaction changes over time.
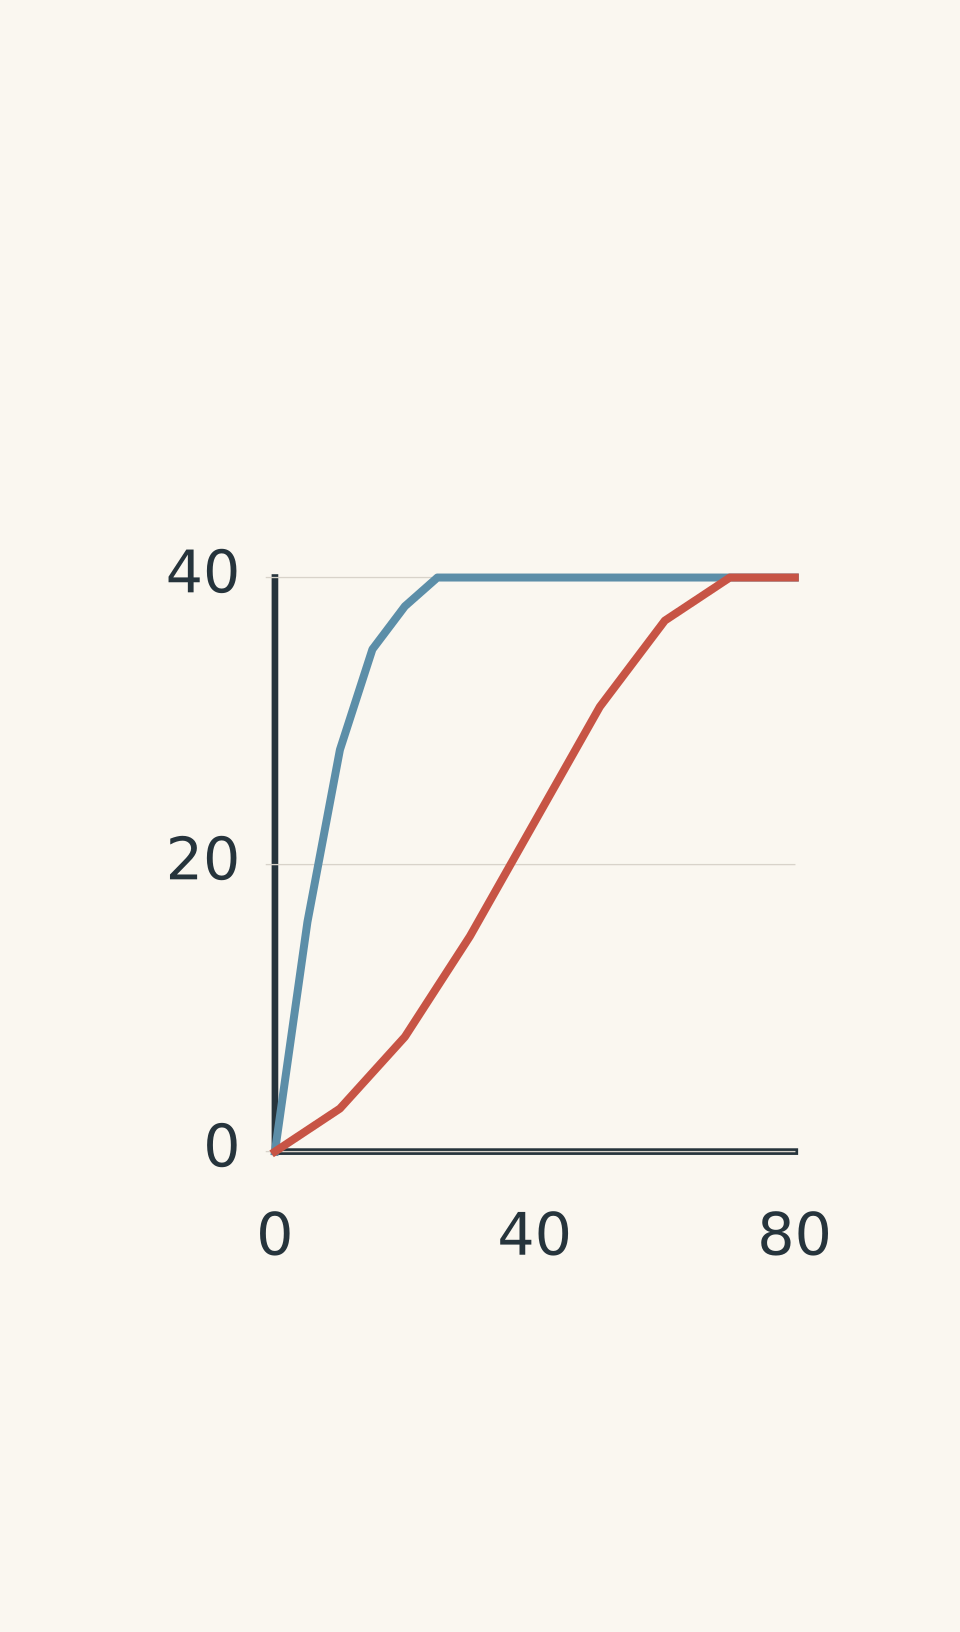
- Faster reaction (plateau at 25 s)
- Slower reaction (plateau at 70 s)
A good reaction-rate practical comes down to three decisions: what to measure, what to keep constant, and how to turn your measurements into evidence. Get those right, and your results become much easier to interpret.
01Choose a measurement that answers your question
Reaction rate describes how quickly a chemical change occurs. In a practical, you usually measure a quantity that changes as the reaction proceeds, then calculate how quickly that quantity changes.
The general relationship is:
\[ \text{Average rate} = \frac{\text{change in measured quantity}}{\text{time interval}} \]
The important detail is the measured quantity. You might measure gas volume, mass loss, or the time taken to reach a visible endpoint. These methods provide different kinds of evidence, and each has limitations.
Method 1: Measure gas volume over time
Consider calcium carbonate reacting with hydrochloric acid:
\[ \ce{CaCO3(s) + 2HCl(aq) -> CaCl2(aq) + H2O(l) + CO2(g)} \]
Carbon dioxide gas forms as the reaction proceeds. You can collect it in a gas syringe and record the volume at regular time intervals.
For example, you might record the volume every 10 seconds for 80 seconds. Plotting these measurements gives you a picture of how quickly the gas is being produced.
Required apparatus construction
| Reaction flask | CaCO₃ + 2HCl → CaCl₂ + H₂O + CO₂ Calcium carbonate reacts with hydrochloric acid inside a conical flask. An airtight bung seals the flask neck. |
|---|---|
| Gas collection | A delivery tube connects the bung to a gas syringe. Carbon dioxide travels through the tube and displaces the syringe plunger. |
This method is particularly useful because it gives you a sequence of measurements, rather than just one result at the end.
The average rate of gas production is:
\[ \text{Rate}=\frac{\Delta V}{\Delta t} \]
Here, \(\Delta V\) is the change in gas volume, measured in cm³, and \(\Delta t\) is the time interval, measured in seconds. The resulting unit is cm³ s⁻¹.
For example, if the gas volume increases by 20 cm³ over 10 seconds, the average rate is 2.0 cm³ s⁻¹.
There is a catch. A gas syringe must be airtight, and carbon dioxide can dissolve in the reaction mixture. Some gas may also occupy the delivery tube before it reaches the syringe. These effects can make the measured volume lower than the amount of gas actually produced.
Method 2: Measure mass loss over time
You can also measure a reaction that releases gas by placing the reaction flask on a balance.
As gas escapes, the mass of the flask and its contents decreases. Record the mass at regular time intervals and calculate how much mass has been lost.
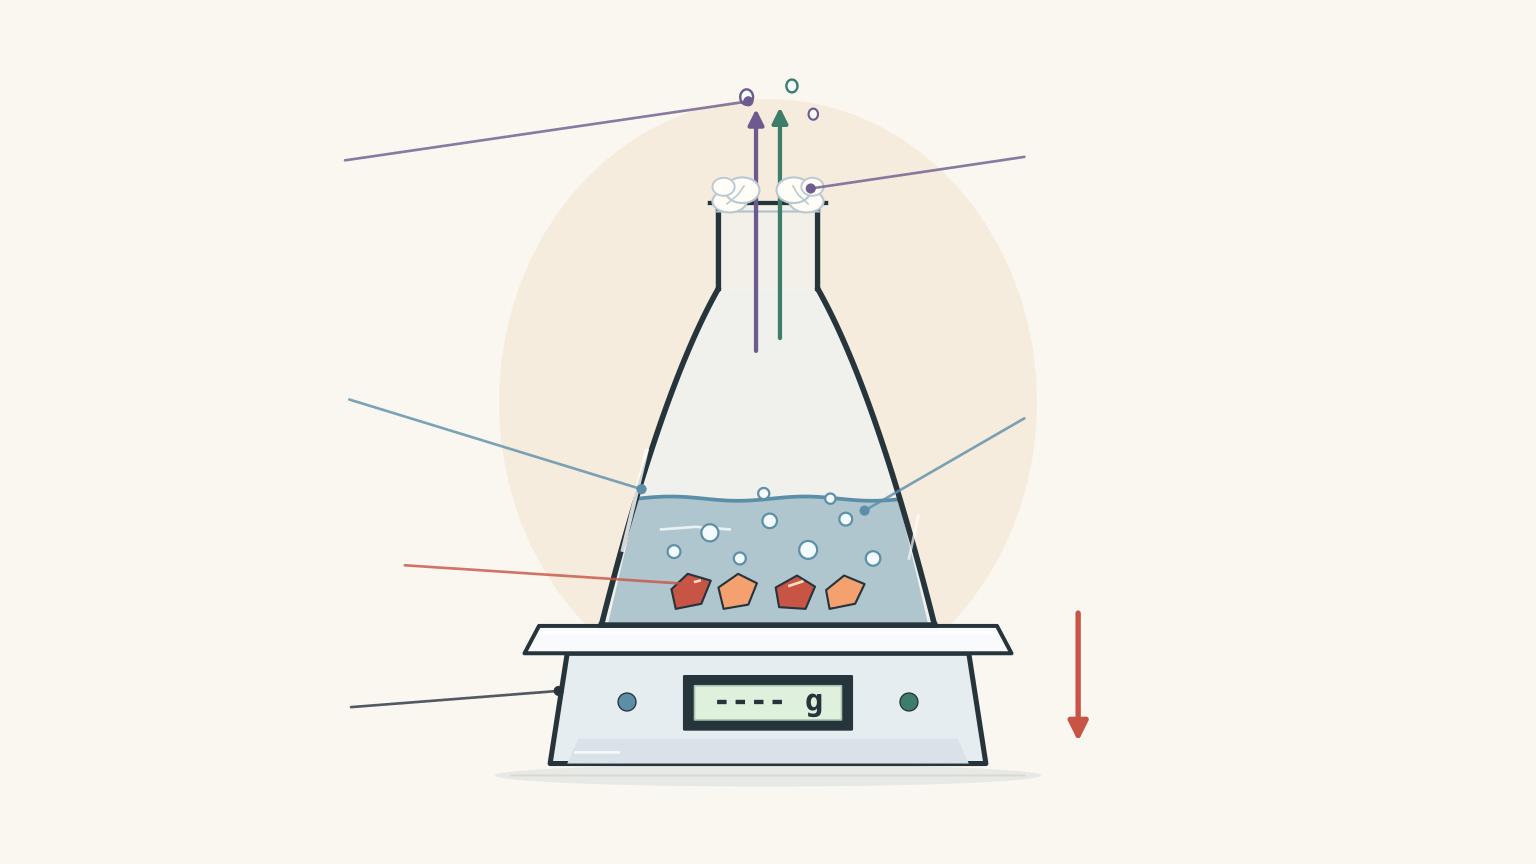
The average rate of mass loss is:
\[ \text{Rate of mass loss} = \frac{\text{mass lost}}{\text{time interval}} \]
If the mass decreases by 0.24 g over 30 seconds, the average mass-loss rate is 0.0080 g s⁻¹.
A loose cotton wool plug can reduce splashing while still allowing gas to escape. Do not seal the flask for this method: if gas cannot escape, the mass will not decrease in the intended way, and pressure can build up.
This method has its own problems. Air currents can affect the balance, droplets can escape from the flask, and evaporation can contribute to the measured mass loss. You also need a balance precise enough to detect the change.
Notice that a mass-loss rate is not automatically a molar reaction rate. It measures how quickly mass leaves the apparatus. Converting that result into an amount of substance per second requires additional chemical information.
Method 3: Measure the time to a visible endpoint
Some reactions are easier to follow through a visible change than by collecting gas or measuring mass.
A common school practical uses sodium thiosulfate and hydrochloric acid. Sulfur forms during the reaction, making the solution increasingly cloudy. You place the reaction flask over a marked cross and measure the time until the cross can no longer be seen.
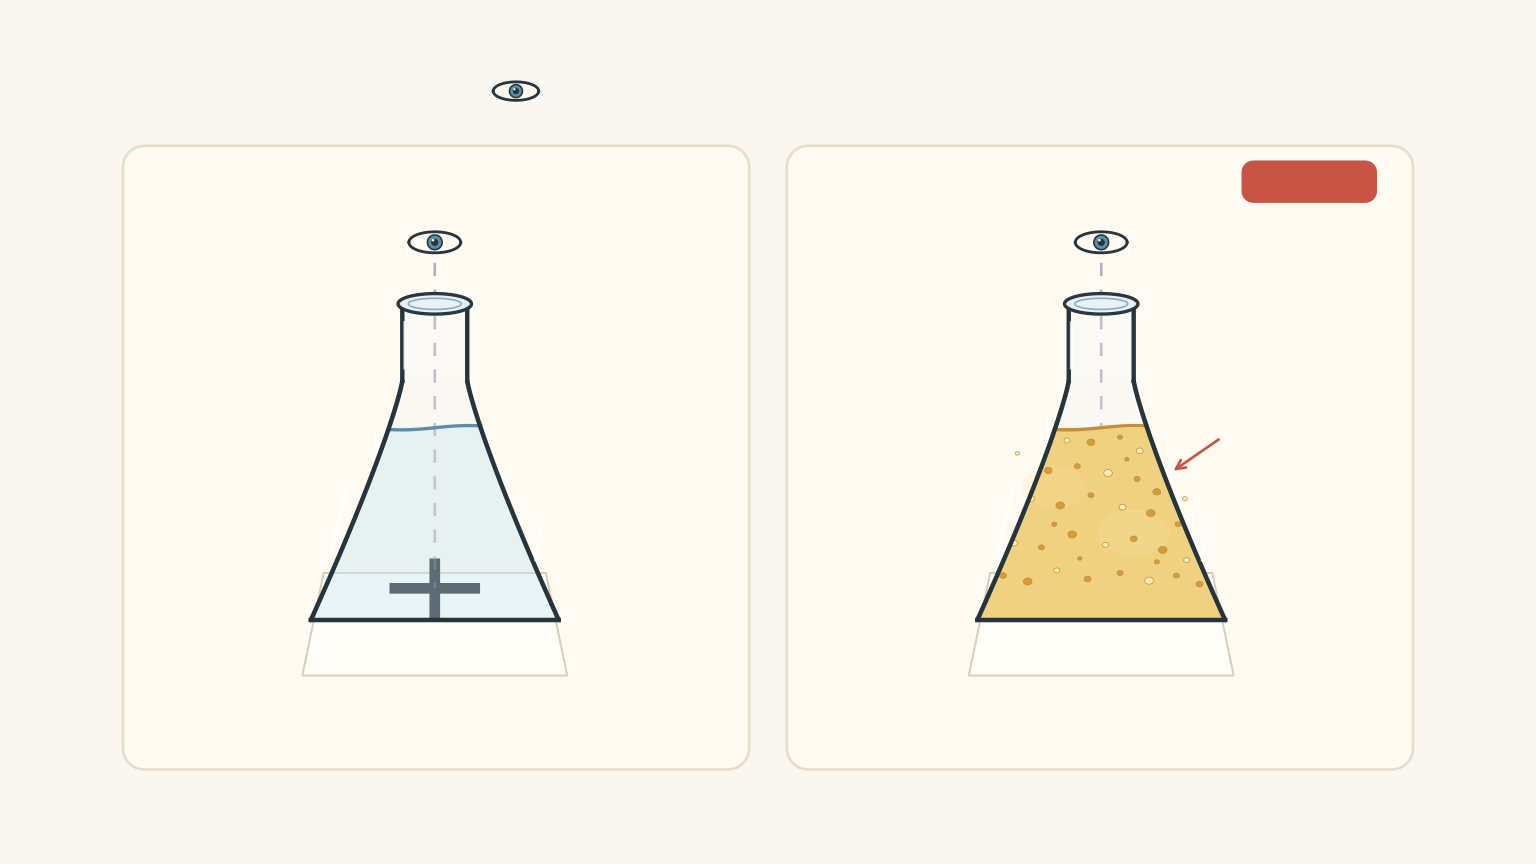
The endpoint is the agreed visual point at which you stop the timer.
You can compare reactions using the reciprocal of the time taken:
\[ r_{\text{proxy}}=\frac{1}{t} \]
Here, \(t\) is the time taken to reach the endpoint in seconds, and \(r_{\text{proxy}}\) is a relative rate indicator with units of s⁻¹.
A shorter time gives a larger value of \(1/t\), indicating a faster reaction under comparable conditions.
However, \(1/t\) is a proxy, not a direct measurement of the amount of reactant consumed per second. It is useful only when the endpoint represents approximately the same extent of reaction in every trial.
For the cross-disappearing practical, keep the flask, cross, viewing angle, lighting, and endpoint rule consistent. The sulfur dioxide produced is hazardous, so this practical must follow your teacher’s safety instructions and ventilation requirements. It is not an experiment to improvise at home.
Which method should you choose?
| Method | Best use | Main limitation |
|---|---|---|
| Gas volume over time | A reaction that produces a measurable gas | Leaks, gas dissolution, and syringe delays |
| Mass loss over time | A reaction that releases gas and produces a measurable mass change | Balance sensitivity, drafts, evaporation, or splashing |
| Time to a visible endpoint | A reaction with a clear, reproducible visual change | Subjective endpoint and timing delays |
Choose the method that measures the change most directly and reliably for your reaction. A gas syringe often gives the most useful information when a reaction produces gas, but only if the apparatus is sufficiently airtight and the gas volume can be measured accurately.
02Design a fair test
Suppose your research question is:
How does hydrochloric acid concentration affect the rate of reaction with calcium carbonate?
Before setting up the apparatus, decide which variable you will change, which result you will measure, and which conditions you must keep constant.
Plan a fair reaction-rate experiment
| INDEPENDENT VARIABLE | Hydrochloric acid concentration The factor deliberately changed between trials. |
|---|---|
| DEPENDENT VARIABLE | Initial rate of carbon dioxide production Measured using the initial slope of a gas-volume-versus-time graph. |
| CONTROLLED VARIABLES | Calcium carbonate: same mass and chip size Acid solution: same volume; same temperature Same apparatus and mixing method Same measurement intervals |
Identify your variables
- Independent variable: the factor you deliberately change. Here, it is the hydrochloric acid concentration.
- Dependent variable: the quantity you measure to determine the reaction rate. Here, it is the initial rate of carbon dioxide production, calculated from a gas-volume-versus-time graph.
- Controlled variables: the other conditions that could affect the result. These must be kept as consistent as practical.
For this experiment, control the following:
| Variable | How to control it | Why it matters |
|---|---|---|
| Mass of calcium carbonate | Use the same mass in every trial | Different amounts can produce different total amounts of gas |
| Chip size and surface area | Use chips of similar dimensions from the same preparation | Smaller pieces expose more surface area for reaction |
| Volume of acid solution | Use the same volume in every trial | Changing volume can affect the total reaction mixture and available acid |
| Temperature | Keep the solutions at the same temperature | Temperature affects reaction rate |
| Apparatus | Use the same gas syringe and delivery setup | Different setups can introduce different measurement errors |
| Mixing and starting method | Follow the same procedure every time | Different delays or mixing can change the measured early rate |
| Measurement intervals | Record gas volume at the same time intervals | This makes rate comparisons consistent |
One detail deserves extra attention: the acid must be in excess in every trial if you want the calcium carbonate to be the limiting reactant throughout the concentration comparison.
Why? If the acid runs out in one trial but not another, the reactions can produce different final amounts of carbon dioxide. You would then be comparing both reaction rate and reaction yield, rather than cleanly investigating how concentration affects rate.
We will return to this problem later, because it is an easy one to miss.
Surface area is a control, not a minor detail
Imagine reacting 0.50 g of calcium carbonate chips in one trial and 0.50 g of finely crushed calcium carbonate in another.
The masses are identical. Does that make the test fair?
No. The powder exposes much more surface area to the acid. More acid particles can collide with the solid’s surface at any moment, so the powder will generally react faster.
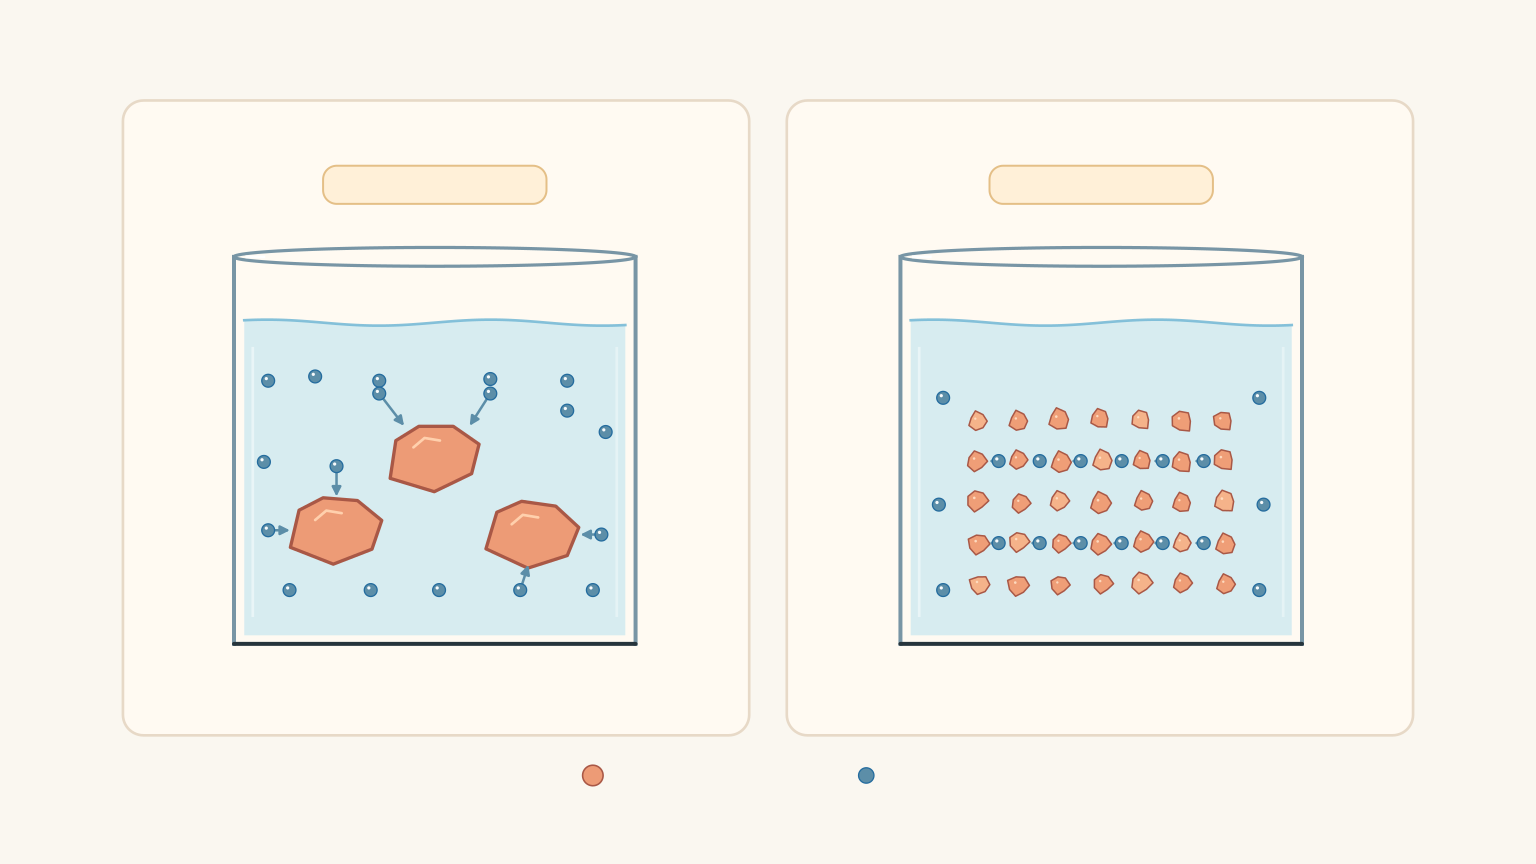
This is why controlling the mass alone is not enough. You must also control the physical form of the solid.
The same principle applies to other experiments. If you investigate temperature, concentration, or the effect of a catalyst, do not accidentally change surface area at the same time.
Start timing consistently
A surprisingly important source of error is the moment you start the stopwatch.
Suppose you mix the reactants, then spend three seconds fitting the bung into the flask. Carbon dioxide escapes before the apparatus is sealed. Your earliest gas-volume readings will underestimate the amount of gas produced.
This is particularly damaging when you want to measure the initial rate, because the first few seconds contribute heavily to your estimate.
Use a starting method that minimises the delay. Where the apparatus permits, you can arrange the reactants separately inside a sealed vessel and initiate the reaction by tipping or mixing them. If your school uses a different procedure, follow it consistently across every trial.
Do not change the starting method halfway through the investigation.
Repeat your measurements
One trial can give a misleading result because of a leak, a timing mistake, or normal experimental variation.
Complete at least three trials at each condition where practical. Calculate the mean of the repeat results and inspect their spread.
Repeats help you distinguish a consistent pattern from a result that might have occurred by chance. They do not automatically eliminate systematic errors, such as a gas syringe that leaks in every trial.
Also, do not confuse repeated readings with repeated trials. Recording eight gas volumes during one reaction gives you eight time points, but it is still only one trial.
If one result looks unusual, investigate it. Do not discard it simply because it does not match the trend. Look for a documented problem, repeat the measurement, and explain any exclusion.
03Read the graph as a record of the reaction
A graph should help you answer a chemical question, not just display your measurements.
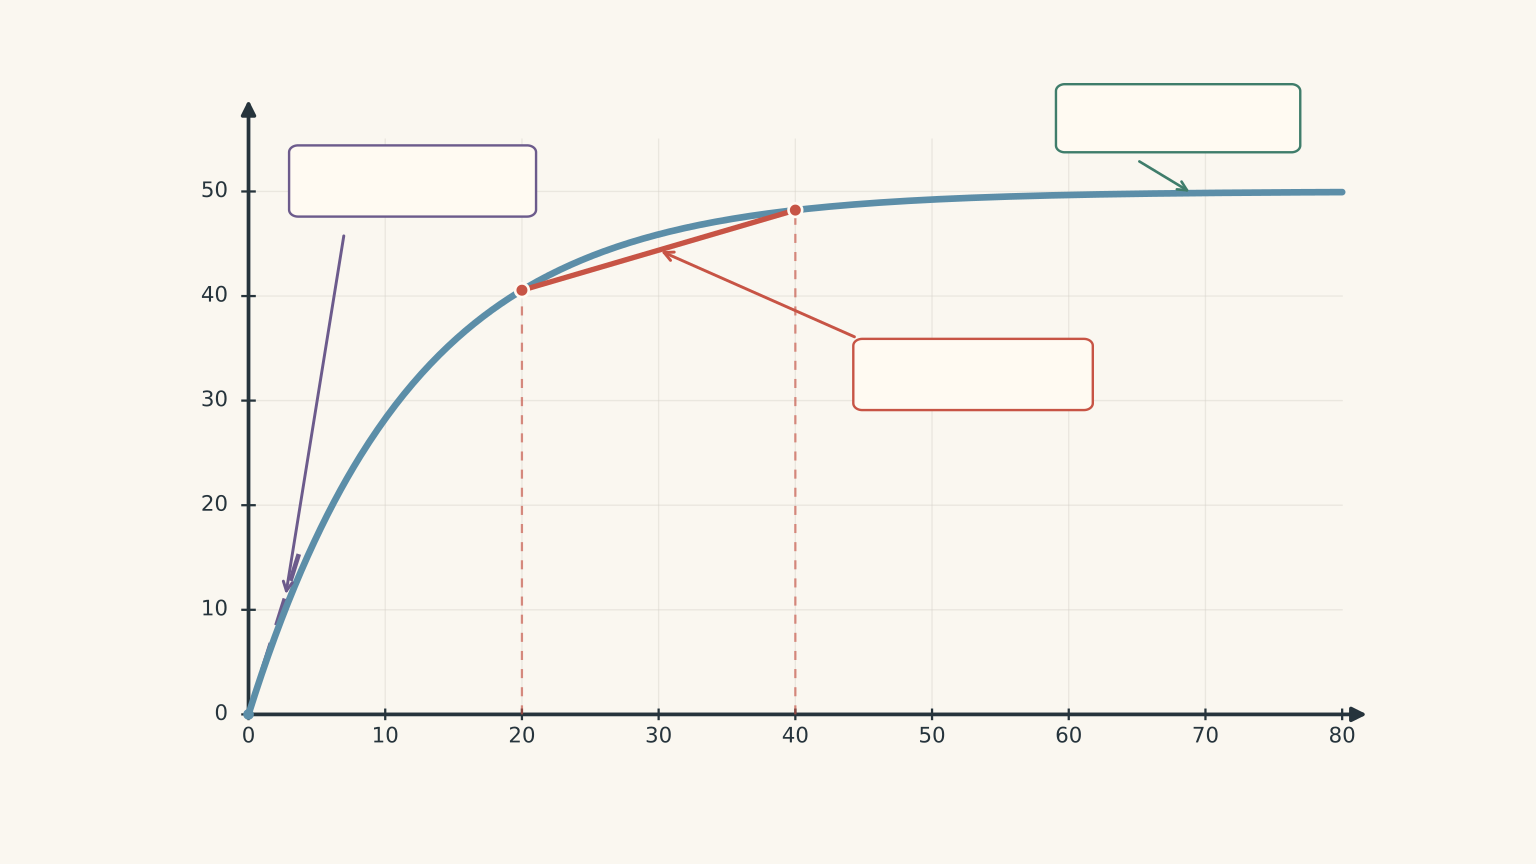
For a gas-collection practical, put time on the horizontal axis and gas volume on the vertical axis. Label both axes with units.
Understand the gradient
The gradient of a graph measures how quickly the vertical quantity changes with the horizontal quantity.
For a graph of gas volume against time:
\[ \text{Gradient}=\frac{\Delta V}{\Delta t} \]
A steeper gradient means gas is being produced more quickly.
The gradient usually decreases as the reaction proceeds. Reactants are consumed, so the conditions at the reacting surface change and the reaction generally slows. Eventually, the curve becomes horizontal when no further measurable gas is being produced.
The horizontal plateau is evidence about the final gas volume. It is not a measure of how fast the reaction occurred.
Average rate versus initial rate
An average rate describes a time interval. For example, you could calculate the average rate between 10 and 30 seconds.
The initial rate describes how quickly the reaction proceeds at the very beginning. On a smooth volume-versus-time graph, estimate it by drawing a tangent to the curve at \(t=0\) and calculating the tangent’s gradient.
In school practicals, you may instead calculate the average rate over a short, early time interval. That gives an estimate of the initial rate, not its exact instantaneous value.
Be clear about which quantity you report.
Choose the graph that matches the question
| What you want to investigate | Suitable graph | What it tells you |
|---|---|---|
| How a reaction proceeds over time | Gas volume against time | The rate at different stages of the reaction |
| How quickly gas is produced at different concentrations | Initial rate against concentration | How the measured initial rate changes with concentration |
| How quickly mass is lost | Mass lost against time | The rate of mass loss from the apparatus |
| How concentration affects an endpoint reaction | \(1/t\) against concentration, using the same endpoint | How a relative rate indicator changes with concentration |
For mass measurements, plotting mass lost against time gives a positive gradient as mass loss increases. If you plot mass remaining instead, the gradient will be negative; its magnitude represents the mass-loss rate.
For a concentration investigation, calculate an initial rate for each concentration first, then plot those rates against concentration. Do not use only the final gas volumes to compare speed.
Use a smooth curve for a time-series graph when the reaction rate changes continuously. Do not force a straight line through data that clearly curve, and do not force the graph through the origin if your measurements do not support that choice.
04Worked example: Calculate an average gas-production rate
A student records the following gas volumes during a reaction:
- At 10.0 s, the gas volume is 16.0 cm³.
- At 30.0 s, the gas volume is 40.0 cm³.
Calculate the average rate of gas production between 10.0 s and 30.0 s.
Step 1
The gas volume increases from 16.0 cm³ to 40.0 cm³.
\[ \Delta V=40.0-16.0=24.0\ \mathrm{cm^3} \]
Step 2
\[ \Delta t=30.0-10.0=20.0\ \mathrm{s} \]
Step 3
\[ \begin{aligned} \text{Average rate} &=\frac{\Delta V}{\Delta t}\\[4pt] &=\frac{24.0\ \mathrm{cm^3}}{20.0\ \mathrm{s}}\\[4pt] &=1.20\ \mathrm{cm^3\,s^{-1}} \end{aligned} \]
The average rate is \(1.20\ \mathrm{cm^3\,s^{-1}}\).
This means that the measured gas volume increased by an average of 1.20 cm³ per second over that particular interval. It does not mean the reaction produced exactly 1.20 cm³ every second: the instantaneous rate may have changed during the interval.
05Worked example: Compare reactions using an endpoint
A student investigates two sodium thiosulfate concentrations using the same cross-disappearing endpoint.
- At 0.10 mol L⁻¹, the endpoint is reached in 60.0 s.
- At 0.20 mol L⁻¹, the endpoint is reached in 32.0 s.
Calculate the reciprocal-time indicator for each trial and compare the results.
Step 1
\[ \begin{aligned} r_{\text{proxy}} &=\frac{1}{t}\\[4pt] &=\frac{1}{60.0\ \mathrm{s}}\\[4pt] &=0.0167\ \mathrm{s^{-1}} \end{aligned} \]
Step 2
\[ \begin{aligned} r_{\text{proxy}} &=\frac{1}{32.0\ \mathrm{s}}\\[4pt] &=0.0313\ \mathrm{s^{-1}} \end{aligned} \]
Step 3
\[ \text{Ratio} =\frac{0.0313}{0.0167} \approx 1.88 \]
The reciprocal-time indicator for the 0.20 mol L⁻¹ solution is approximately 1.88 times that for the 0.10 mol L⁻¹ solution.
The shorter endpoint time supports the conclusion that the more concentrated solution reacts faster under these conditions. However, the value 1.88 is a comparison of the reciprocal-time indicators, not a direct measurement proving that the true reaction rate is exactly 1.88 times greater.
That distinction matters whenever a practical measures an endpoint rather than the amount of a reactant consumed per second.
06Evaluate the limitations of your method
A good practical report does more than list possible errors. It explains how a limitation affects the result and what change would improve the measurement.
| Limitation | How it affects the result | Practical improvement |
|---|---|---|
| Delay before the apparatus is sealed | Gas escapes before measurement, potentially underestimating the early rate | Use a consistent starting method that minimises delay |
| Gas leakage | Measured gas volume is lower than the amount collected from a leak-free system | Check the bung, tubing, and syringe connections before each trial |
| Gas dissolving in the solution | Less gas reaches the syringe than was produced | Keep conditions consistent and acknowledge the method’s limitations |
| Syringe friction or sticking | The plunger may not move smoothly as gas enters | Check that the syringe moves freely before starting |
| Temperature differences | Reaction rate changes, and gas volume can also change with temperature | Control temperature; if temperature is the variable, account for differences in gas measurement conditions |
| Balance sensitivity | Small mass changes may be hidden by the instrument’s resolution | Use a suitable balance and record readings to its actual precision |
| Drafts, evaporation, or splashing | The balance may register mass changes unrelated to the intended gas loss | Reduce drafts, use a loose cotton wool plug, and avoid moving the flask |
| Subjective visual endpoint | Different observers may stop the timer at different stages | Standardise the viewing position, lighting, and endpoint rule |
Temperature deserves special attention. If you are investigating temperature using a gas syringe, a warmer gas sample can occupy a larger volume than the same amount of gas at a lower temperature. A larger measured volume does not automatically mean more gas molecules have formed.
The gas measurement conditions must therefore be considered separately from the chemical reaction rate.
For endpoint experiments, timing delays can also be substantial. If the reaction reaches its endpoint quickly, a delay of even one or two seconds represents a larger fraction of the measured time than it would in a much slower reaction.
When evaluating a limitation, use a specific explanation. For example:
Inserting the bung after mixing allows some carbon dioxide to escape before collection begins. This can underestimate the initial gas-production rate. A sealed-start method would reduce the delay and improve the comparison between concentrations.
That is much stronger than writing, “Human error affected the experiment.”
Finally, follow your teacher’s risk assessment for all chemical handling. Wear the required eye protection, use the specified reagent quantities and concentrations, and follow the prescribed ventilation and disposal procedures. Do not improvise reaction-rate experiments with acids or gas-producing reactions at home.
07Questions and solutions
Question 1
A student investigates a reaction that releases carbon dioxide. The mass of the flask and its contents is 92.46 g at the start and 92.18 g after 35.0 s.
Assuming the mass decrease is due to gas leaving the flask, calculate the average rate of mass loss in g s⁻¹.
Solution 1
The average rate of mass loss is \(8.0\times10^{-3}\ \mathrm{g\,s^{-1}}\).
First, calculate the mass lost:
\[ \begin{aligned} \text{Mass lost} &=92.46-92.18\\ &=0.28\ \mathrm{g} \end{aligned} \]
Then divide by the time interval:
\[ \begin{aligned} \text{Rate of mass loss} &=\frac{\text{mass lost}}{\text{time}}\\[4pt] &=\frac{0.28\ \mathrm{g}}{35.0\ \mathrm{s}}\\[4pt] &=0.0080\ \mathrm{g\,s^{-1}} \end{aligned} \]
The result means that the measured mass decreased by an average of 0.0080 g each second. It is a mass-loss rate, not directly a rate in mol s⁻¹.
Question 2
A student wants to investigate how hydrochloric acid concentration affects the reaction rate of calcium carbonate with hydrochloric acid. The student will collect carbon dioxide in a gas syringe.
Describe a valid experimental design. Identify the independent and dependent variables, give at least four controlled variables, explain how repeat trials should be used, and state which graph would best compare the reaction rates.
Solution 2
The independent variable should be hydrochloric acid concentration, and the dependent variable should be the initial rate of carbon dioxide production, calculated from the initial gradient of a gas-volume-versus-time graph.
A suitable procedure is as follows:
- Prepare several hydrochloric acid solutions of different concentrations, using the same volume of solution in each trial.
- Use the same mass of calcium carbonate, with chips of similar size and surface area.
- Keep the temperature, apparatus, mixing method, and timing procedure consistent.
- Ensure that hydrochloric acid is in excess at every concentration so that calcium carbonate remains the limiting reactant.
- Record the gas volume at regular time intervals from the start of the reaction.
- Repeat each concentration at least three times where practical, inspect the results, and calculate a mean initial rate.
Plot gas volume against time for each trial or concentration. Estimate the initial rate from the initial gradient of each curve, then plot mean initial rate against acid concentration.
This design measures the reaction as it proceeds rather than relying on the final gas volume. Keeping the acid in excess also helps ensure that differences in final yield do not interfere with the intended comparison of reaction rates.
Question 3
A student reacts equal masses of calcium carbonate with different hydrochloric acid concentrations. The acid is in excess in both trials, and the temperature, surface area, and apparatus are kept constant.
The following gas volumes are recorded:
| Time (s) | 0.50 mol L⁻¹ acid (cm³) | 1.00 mol L⁻¹ acid (cm³) |
|---|---|---|
| 0 | 0 | 0 |
| 10 | 11 | 18 |
| 20 | 20 | 31 |
| 40 | 32 | 40 |
| 60 | 38 | 40 |
| 80 | 40 | 40 |
Calculate the average rate of gas production during the first 20 seconds for each concentration. Explain what the results and final gas volumes indicate about the reactions.
Solution 3
The 1.00 mol L⁻¹ reaction has the larger average gas-production rate over the first 20 seconds: 1.55 cm³ s⁻¹ compared with 1.00 cm³ s⁻¹. Both reactions eventually produce the same measured gas volume of 40 cm³.
For the 0.50 mol L⁻¹ solution:
\[ \begin{aligned} \text{Average rate} &=\frac{20-0}{20-0}\\[4pt] &=1.00\ \mathrm{cm^3\,s^{-1}} \end{aligned} \]
For the 1.00 mol L⁻¹ solution:
\[ \begin{aligned} \text{Average rate} &=\frac{31-0}{20-0}\\[4pt] &=1.55\ \mathrm{cm^3\,s^{-1}} \end{aligned} \]
The more concentrated acid produces gas more quickly during the measured interval. A higher concentration means more acid particles per unit volume, increasing the frequency of collisions with the calcium carbonate surface and generally increasing the frequency of successful collisions.
The final gas volumes are equal because the same amount of calcium carbonate is used and the acid is in excess in both trials. The same amount of limiting reactant therefore produces the same theoretical amount of carbon dioxide.
The tempting mistake is to interpret the steeper curve as evidence that the reaction must produce more gas. The gradient measures rate, while the plateau measures the final gas volume. These are different features of the graph.
The calculated values are average rates over the first 20 seconds. They provide useful evidence about the early reaction, but they are not exact instantaneous rates at \(t=0\).
Question 4
A student investigates the effect of sodium thiosulfate concentration on the time taken for a cross beneath a reaction flask to disappear.
The student obtains these results:
| Concentration (mol L⁻¹) | Trial 1 (s) | Trial 2 (s) | Trial 3 (s) |
|---|---|---|---|
| 0.10 | 72 | 74 | 73 |
| 0.20 | 36 | 38 | 62 |
Calculate the mean endpoint time for each concentration. Use the reciprocal of the mean time to compare the relative rate indicators.
The student argues that the 62 s result should be discarded because it does not agree with the other two results. Evaluate this decision and suggest an appropriate next step.
Solution 4
The results suggest that the 0.20 mol L⁻¹ solution reaches the endpoint faster overall, but the 62 s result should not be discarded without a justified reason.
For the 0.10 mol L⁻¹ solution:
\[ \begin{aligned} \bar{t} &=\frac{72+74+73}{3}\\ &=73.0\ \mathrm{s} \end{aligned} \]
For the 0.20 mol L⁻¹ solution:
\[ \begin{aligned} \bar{t} &=\frac{36+38+62}{3}\\ &=45.3\ \mathrm{s} \end{aligned} \]
Now calculate the reciprocal-time indicators.
For 0.10 mol L⁻¹:
\[ \frac{1}{73.0\ \mathrm{s}} =0.0137\ \mathrm{s^{-1}} \]
For 0.20 mol L⁻¹:
\[ \frac{1}{45.3\ \mathrm{s}} =0.0221\ \mathrm{s^{-1}} \]
The ratio is:
\[ \frac{0.0221}{0.0137}\approx1.61 \]
Using all three results, the reciprocal-time indicator for the more concentrated solution is approximately 1.61 times larger.
The 62 s result is noticeably different from the other two measurements, but an unusual result is not automatically an invalid result. The student should check whether the endpoint was missed, the reactants were mixed inconsistently, or another identifiable problem occurred.
If no specific problem can be identified, the student should retain the result, report the variation, and repeat the trial. If a procedural mistake is documented, the student can explain why the affected result is excluded.
A useful improvement would be to standardise the lighting, viewing position, mixing procedure, and endpoint rule. These controls reduce the chance that differences in human judgement will be mistaken for differences in reaction rate.
Question 5
A student investigates the effect of hydrochloric acid concentration on the reaction rate of calcium carbonate.
The student reacts 0.50 g of calcium carbonate chips with 25.0 mL of hydrochloric acid in each trial. The acid concentrations are 0.20 mol L⁻¹ and 0.40 mol L⁻¹. The temperature, chip size, and apparatus are identical.
The measured early gradients of the carbon dioxide volume-versus-time graphs are approximately 0.9 cm³ s⁻¹ and 1.7 cm³ s⁻¹, respectively. The final gas volumes are 22 cm³ and 44 cm³.
The student concludes that the more concentrated acid reacts about twice as fast and produces twice as much carbon dioxide.
Evaluate both claims. Use the reaction equation and the following information to explain your reasoning:
- Reaction: \(\ce{CaCO3(s) + 2HCl(aq) -> CaCl2(aq) + H2O(l) + CO2(g)}\)
- Molar mass of calcium carbonate: 100 g mol⁻¹
Then propose a revised experiment in which the final amount of carbon dioxide should be the same for both acid concentrations. Assume complete reaction, no gas leakage, and comparable gas measurement conditions.
Solution 5
The measured early gas-production rates differ by a factor of approximately 1.9, and the more concentrated acid does produce about twice as much carbon dioxide in this particular setup. However, the difference in final gas volume is caused by the amounts of reactants available, not simply by the difference in reaction rate.
Step 1: Calculate the amount of calcium carbonate.
The amount of substance, \(n\), is calculated using mass divided by molar mass:
\[ \begin{aligned} n(\ce{CaCO3}) &=\frac{0.50\ \mathrm{g}}{100\ \mathrm{g\,mol^{-1}}}\\[4pt] &=0.0050\ \mathrm{mol} \end{aligned} \]
The balanced equation shows that one mole of calcium carbonate reacts with two moles of hydrochloric acid.
Therefore, the amount of hydrochloric acid needed to react with all the calcium carbonate is:
\[ n(\ce{HCl})=2(0.0050)=0.0100\ \mathrm{mol} \]
Step 2: Determine whether the acid is in excess.
Use \(n=cV\), where \(n\) is the amount in moles, \(c\) is concentration in mol L⁻¹, and \(V\) is solution volume in litres.
For 0.20 mol L⁻¹ acid:
\[ \begin{aligned} n(\ce{HCl}) &=0.20\times0.0250\\ &=0.0050\ \mathrm{mol} \end{aligned} \]
This is only half the amount needed to react with all the calcium carbonate. The acid is the limiting reactant, so some calcium carbonate remains unreacted.
For 0.40 mol L⁻¹ acid:
\[ \begin{aligned} n(\ce{HCl}) &=0.40\times0.0250\\ &=0.0100\ \mathrm{mol} \end{aligned} \]
This is exactly the stoichiometric amount required to react with all the calcium carbonate. Under the stated assumptions, the calcium carbonate can react completely.
Step 3: Explain the difference in final gas volume.
The balanced equation shows that one mole of hydrochloric acid produces half a mole of carbon dioxide when the acid is the limiting reactant.
In the 0.20 mol L⁻¹ trial:
\[ n(\ce{CO2})=\frac{0.0050}{2} =0.0025\ \mathrm{mol} \]
In the 0.40 mol L⁻¹ trial, all 0.0050 mol of calcium carbonate reacts, producing:
\[ n(\ce{CO2})=0.0050\ \mathrm{mol} \]
The second trial therefore produces twice as many moles of carbon dioxide as the first. The measured final volumes of 22 cm³ and 44 cm³ are consistent with this ratio.
The student’s conclusion about the final amount of carbon dioxide is correct for these particular trials. However, it would be incorrect to claim that a faster reaction must produce more product. Here, the low-concentration trial produces less gas because it runs out of hydrochloric acid before all the calcium carbonate can react.
Step 4: Evaluate the reaction-rate claim.
The ratio of the measured early gradients is:
\[ \frac{1.7}{0.9}\approx1.9 \]
The early gas-production rate in the more concentrated trial is therefore approximately 1.9 times that in the less concentrated trial. This supports the student’s description of the measured early rates as being roughly twice as large.
However, the final gas volumes do not establish this rate difference. The gradients provide the rate evidence; the plateaus provide evidence about the final gas yield.
Also, the student has reported only one run at each concentration. Repeat trials are needed to determine whether the measured rate difference is reproducible.
There is a further design problem: the low-concentration trial is acid-limited, while the higher-concentration trial has enough acid to consume all the calcium carbonate. Their reaction profiles therefore differ in both initial concentration and the amount of reaction that can occur before a reactant is exhausted.
Step 5: Redesign the experiment.
Keep the calcium carbonate mass at 0.50 g, but increase the acid solution volume to 60.0 mL for both concentrations.
For 0.20 mol L⁻¹ acid:
\[ \begin{aligned} n(\ce{HCl}) &=0.20\times0.0600\\ &=0.0120\ \mathrm{mol} \end{aligned} \]
For 0.40 mol L⁻¹ acid:
\[ \begin{aligned} n(\ce{HCl}) &=0.40\times0.0600\\ &=0.0240\ \mathrm{mol} \end{aligned} \]
Both quantities exceed the 0.0100 mol required to react with all the calcium carbonate. The calcium carbonate is now the limiting reactant in both trials.
If the reactions go to completion, both should produce the same amount of carbon dioxide because they start with the same amount of calcium carbonate.
Repeat each trial, keep the other controlled variables consistent, and compare the initial gradients rather than the final gas volumes. This revised design provides a cleaner investigation of how acid concentration affects reaction rate without confusing that effect with a change in final yield.
Once the measurements are reliable and the limiting reactant is controlled, the next useful step is to plot initial rate against concentration and examine the pattern. That is how you move from collecting experimental data to making a defensible conclusion about reaction kinetics.