
Acid-Base Analysis in Practice: HSC Chemistry Practice Exam
Test your understanding of acid-base analysis in practice with this original 42-mark Chemistry revision exam. Practise interpreting digital pH and conductivity data, evaluating calibration and sampling methods, and applying your knowledge with complete worked solutions and a marking guide.
This is an original tutorgum practice paper for the supplied Chemistry 2025 scope on acid-base analysis in practice. It tests how digital pH and conductivity probes are calibrated, used to collect and process data, and evaluated for reliability. It is an original revision resource, not an official, endorsed, past, or predicted NESA paper.
01Exam instructions
| Condition | Details |
|---|---|
| Suggested reading time | 5 minutes |
| Suggested working time | 55 minutes |
| Total marks | 42 |
| Equipment | Pen or pencil, ruler, and scientific calculator |
| Working | Show calculations and include units where appropriate. |
| Rounding | Follow the precision requested in each question. |
| Temperature | Assume measurements are made at 25°C unless stated otherwise. |
Assessed scope
This paper focuses on the supplied Chemistry 2025 scope for acid-base analysis in practice:
- Using digital pH and conductivity probes to collect data.
- Calibrating instruments and checking their performance.
- Processing repeated measurements and interpreting numerical data.
- Evaluating precision, accuracy, reliability, and possible measurement errors.
- Assessing sampling procedures and the suitability of a measurement method.
The paper does not assess titration stoichiometry, equilibrium calculations, organic chemistry, or unrelated Chemistry modules.
For this paper, a pH below 7.0 indicates an acidic solution, pH 7.0 indicates a neutral solution, and pH above 7.0 indicates an alkaline solution.
Attempt every question before consulting the worked solutions. Marks are awarded for demonstrated reasoning as well as correct numerical answers.
02Questions
Question 1 (6 marks)
A student is preparing a digital pH meter for analysing several aqueous samples. Before calibrating the meter, the student checks it against three fresh buffer solutions with certified pH values.
| Certified buffer pH | Meter reading before calibration |
|---|---|
| 4.00 | 4.18 |
| 7.00 | 7.12 |
| 10.00 | 9.76 |
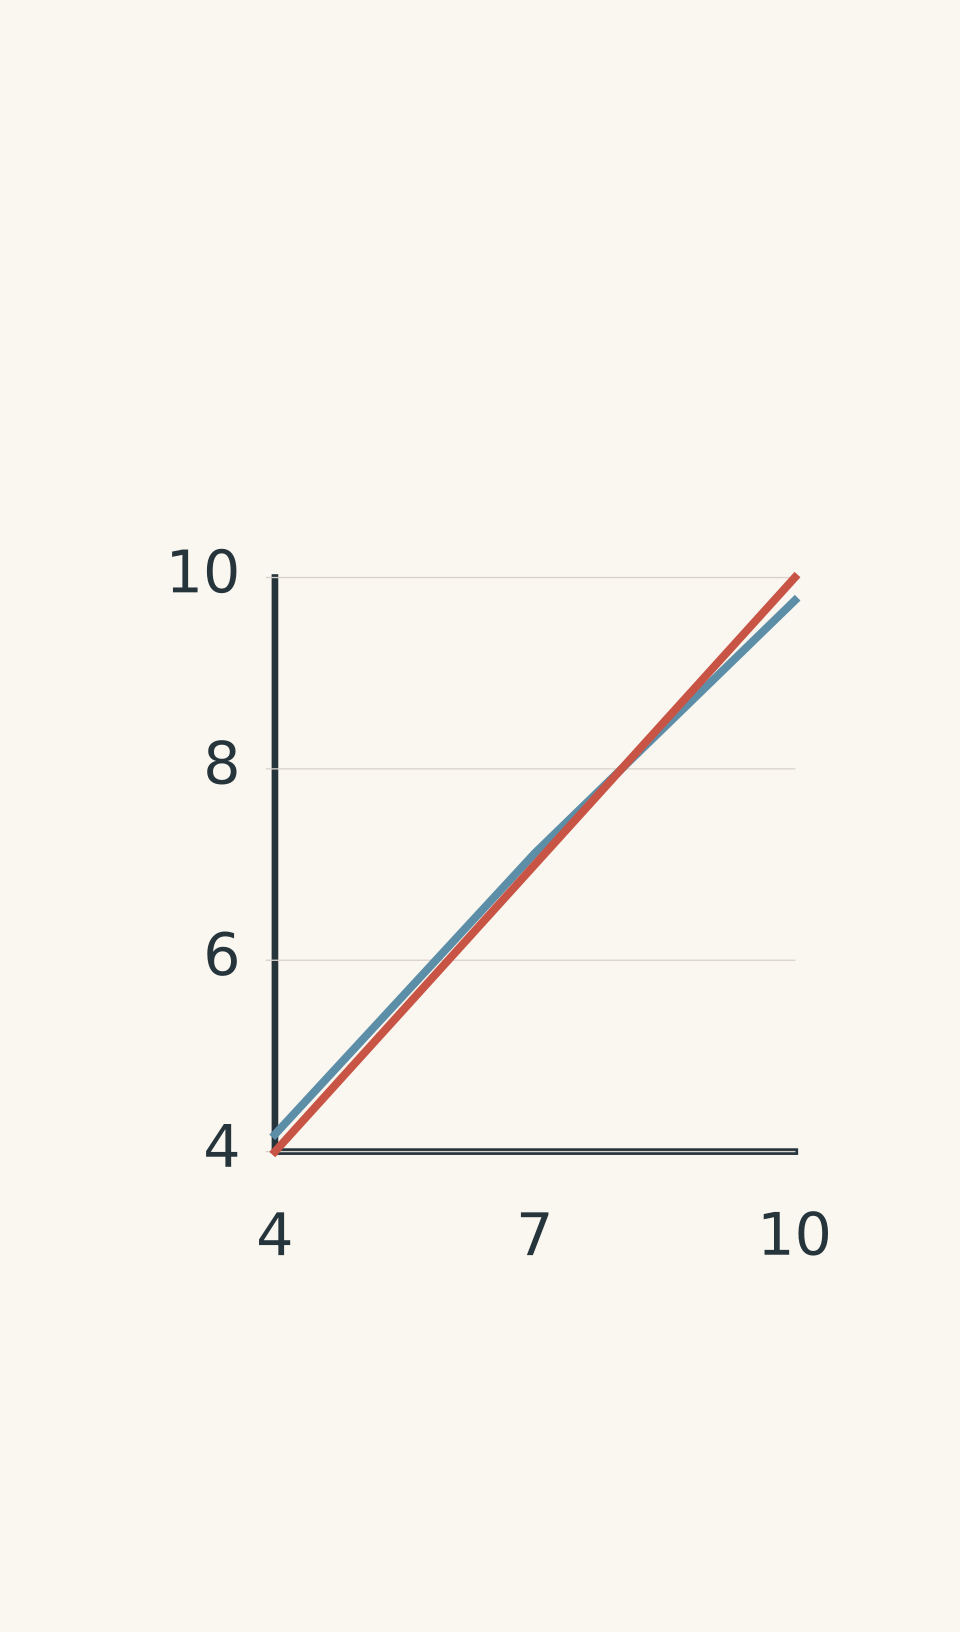
- Measured readings
- Ideal agreement
(a) Calculate the absolute error for each of the three meter readings. (3 marks)
(b) Identify the buffer that produces the largest absolute error and state the magnitude of that error. (1 mark)
(c) Explain why calibration should use fresh buffer solutions that span the expected pH range of the samples rather than relying on a single buffer. (2 marks)
Question 2 (7 marks)
A student places a calibrated digital pH probe into an acidic sample. The student records the displayed pH at regular intervals.
| Elapsed time (s) | Displayed pH |
|---|---|
| 0 | 3.82 |
| 10 | 3.94 |
| 20 | 4.01 |
| 30 | 4.02 |
| 40 | 4.02 |
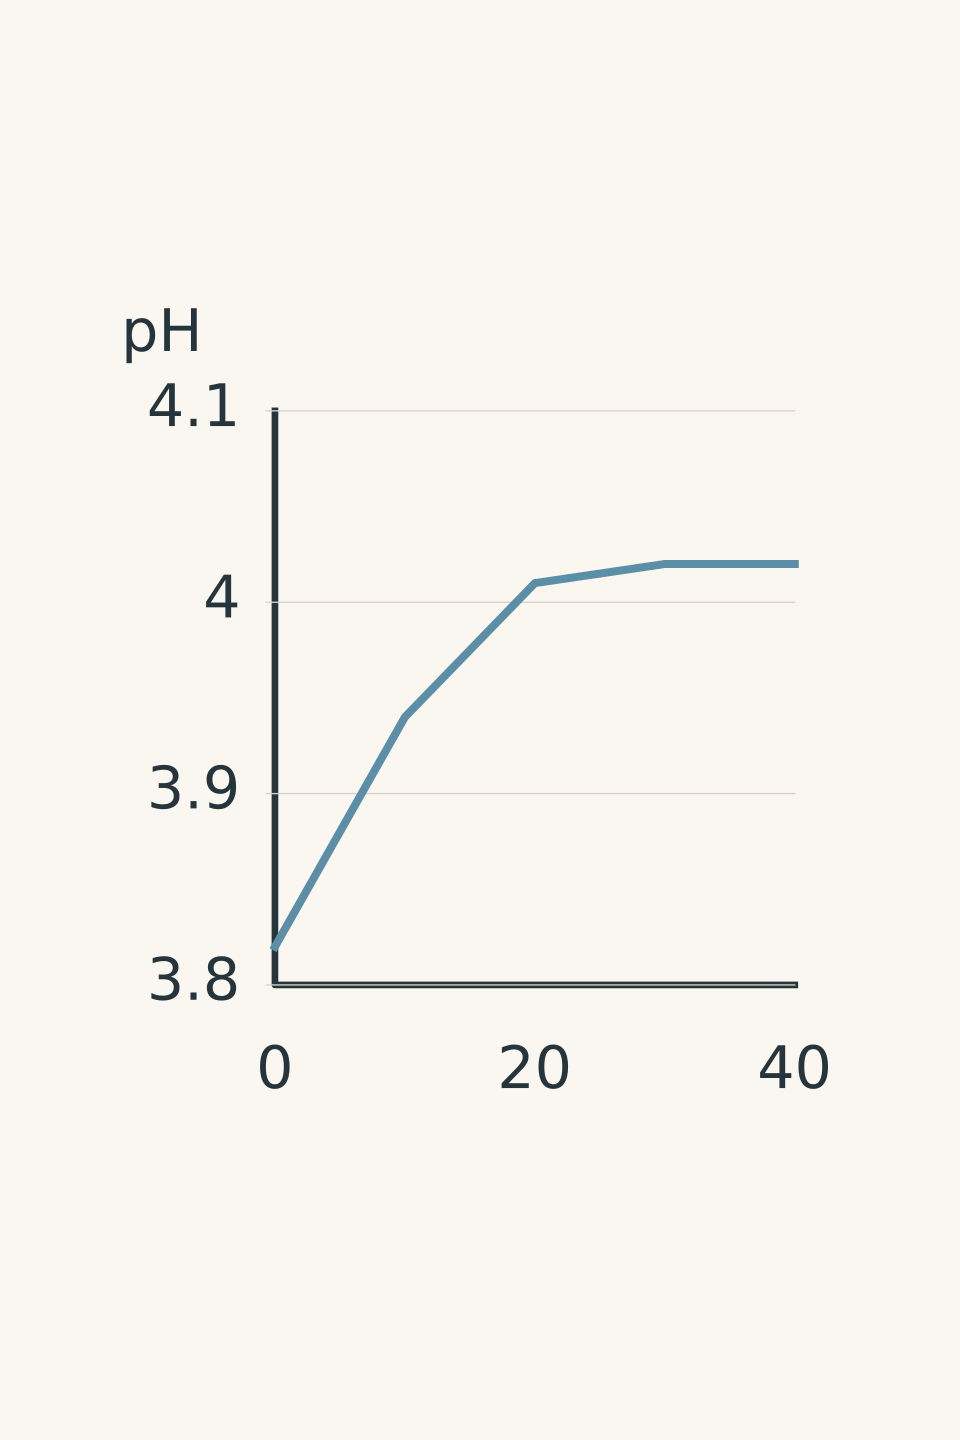
- Displayed pH
(a) Describe how the displayed pH changes during the measurement period. (2 marks)
(b) The student uses the rule that a stable reading is confirmed only when two consecutive readings are unchanged. State the pH value to report and the time at which stability is confirmed. (2 marks)
(c) Explain why recording the first displayed value may produce less reliable results than waiting for a stable reading. (2 marks)
(d) State one measurement condition that should be kept constant when comparing the pH of several samples. (1 mark)
Question 3 (7 marks)
A technician measures two aqueous samples using the same calibrated pH meter. Three readings are collected for each sample under the same measurement conditions.
| Sample | Reading 1 | Reading 2 | Reading 3 |
|---|---|---|---|
| X | 3.21 | 3.23 | 3.22 |
| Y | 5.78 | 5.80 | 5.79 |
(a) Calculate the arithmetic mean of the three displayed pH readings for sample X and sample Y. Give each result to two decimal places. (4 marks)
(b) Identify which sample is more acidic, using the data to support your answer. (1 mark)
(c) Explain what the spread of repeated readings indicates about precision. Explain why these results alone cannot establish that the measurements are accurate. (2 marks)
Question 4 (7 marks)
A laboratory uses a digital pH probe and a digital conductivity probe to analyse three aqueous samples. All measurements are taken at the same temperature.
The results are shown below.
| Sample | pH | Conductivity (\(\mathrm{mS\,cm^{-1}}\)) |
|---|---|---|
| A | 2.8 | 1.60 |
| B | 7.1 | 1.42 |
| C | 2.9 | 0.08 |
(a) Classify each sample as acidic, neutral, or alkaline using its pH. (3 marks)
(b) Identify the sample with the highest conductivity. (1 mark)
(c) Explain why the conductivity results cannot be used as a direct ranking of acidity, even though sample B has the highest conductivity. (3 marks)
Question 5 (7 marks)
A student wants to compare the pH of water collected from two different sites.
The student follows this procedure:
- Calibrates the digital pH meter using only a pH 7.00 buffer.
- Collects one 100 mL sample from each site using the same beaker, without rinsing the beaker between samples.
- Inserts the probe into each sample and records the first number displayed.
- Compares the two recorded pH values.
(a) Identify two weaknesses in this procedure. (2 marks)
(b) For each weakness identified in part (a), propose a specific improvement and explain how it would improve the quality of the results. (4 marks)
(c) Explain why taking repeated readings from one collected sample is not a substitute for collecting independent samples from the same site. (1 mark)
Question 6 (8 marks)
A laboratory uses a digital conductivity probe to compare three aqueous samples.
Before measuring the samples, the technician checks the probe using a reference solution with an expected conductivity of \(1.00\ \mathrm{mS\,cm^{-1}}\). The technician repeats this check after all sample measurements are complete.
For this question, a reference check is acceptable if its measured value is within \(\pm 0.05\ \mathrm{mS\,cm^{-1}}\) of the expected value.
The reference-check results are:
| Check | Measured conductivity (\(\mathrm{mS\,cm^{-1}}\)) |
|---|---|
| Before the sample run | 1.03 |
| After the sample run | 1.20 |
The sample measurements are:
| Sample | Reading 1 (\(\mathrm{mS\,cm^{-1}}\)) | Reading 2 (\(\mathrm{mS\,cm^{-1}}\)) |
|---|---|---|
| P | 0.42 | 0.44 |
| Q | 0.87 | 0.89 |
| R | 0.43 | 0.71 |
(a) Calculate the arithmetic mean conductivity for samples P and Q. Give each answer to two decimal places. (2 marks)
(b) Calculate the absolute difference between the two readings for sample R. Compare its consistency with the results for samples P and Q. (2 marks)
(c) Using the reference-check results, evaluate whether the conductivity probe remained stable throughout the sample run. Recommend the next steps before the results are accepted for comparison. (4 marks)
03Worked solutions and marking guide
Solution 1
(a) Absolute errors
Absolute error is the magnitude of the difference between a measured value and its certified value.
\[ \text{Absolute error} = |\text{meter reading}-\text{certified pH}| \]
For the pH 4.00 buffer:
\[ |4.18-4.00|=0.18 \]
For the pH 7.00 buffer:
\[ |7.12-7.00|=0.12 \]
For the pH 10.00 buffer:
\[ |9.76-10.00|=0.24 \]
The absolute errors are therefore 0.18, 0.12, and 0.24 pH units, respectively.
Marking guide (3 marks):
- 1 mark for each correct absolute error.
(b) Largest absolute error
The pH 10.00 buffer has the largest absolute error, at 0.24 pH units.
Marking guide (1 mark):
- 1 mark for identifying the pH 10.00 buffer and its error.
(c) Purpose of calibration
Calibration compares an instrument’s response with solutions of known pH and adjusts its response as required.
Using fresh buffers across the expected sample range helps establish reliable readings over that range. A single buffer cannot, by itself, establish that the meter responds accurately at substantially different pH values. Fresh solutions also reduce the risk of contamination affecting the calibration.
Marking guide (2 marks):
- 1 mark for explaining that calibration establishes or adjusts the meter’s response against known values.
- 1 mark for explaining that multiple suitable buffers check the response across the expected range, with fresh buffers reducing contamination risk.
Solution 2
(a) Change in displayed pH
The displayed pH increases from 3.82 to 4.02. The size of the increase becomes smaller over time, and the final two readings are unchanged.
Marking guide (2 marks):
- 1 mark for identifying the overall increase from 3.82 to 4.02.
- 1 mark for identifying that the readings level off towards the end.
(b) Stable reading
The reported pH is 4.02, with stability confirmed at 40 seconds.
The readings at 30 seconds and 40 seconds are both 4.02. The second unchanged reading confirms that the displayed value is stable according to the stated rule.
Marking guide (2 marks):
- 1 mark for the reported value of pH 4.02.
- 1 mark for identifying 40 seconds as the confirmation time and linking it to the two unchanged readings.
(c) Why wait for a stable reading?
The instrument’s display may change while the probe responds to the sample. Recording a changing value may not represent a stable measurement and can make comparisons between samples less reliable.
Waiting for a stable reading applies a consistent measurement rule and reduces errors caused by recording the value too early.
Marking guide (2 marks):
- 1 mark for explaining that the initial display may still be changing.
- 1 mark for linking a stable reading to more reliable or comparable results.
(d) Controlled condition
Acceptable answers include sample temperature, probe immersion depth, sample volume, or the procedure used to rinse the probe between samples.
Marking guide (1 mark):
- 1 mark for identifying one relevant condition that should be kept constant.
Solution 3
(a) Arithmetic means
For sample X:
\[ \begin{aligned} \text{Mean pH} &=\frac{3.21+3.23+3.22}{3}\\ &=\frac{9.66}{3}\\ &=3.22 \end{aligned} \]
For sample Y:
\[ \begin{aligned} \text{Mean pH} &=\frac{5.78+5.80+5.79}{3}\\ &=\frac{17.37}{3}\\ &=5.79 \end{aligned} \]
The mean displayed pH is 3.22 for sample X and 5.79 for sample Y.
These are arithmetic means of the instrument readings. Because pH is logarithmic, the means should not be interpreted as direct arithmetic means of hydrogen-ion concentration.
Marking guide (4 marks):
- 2 marks for sample X: 1 mark for correct averaging and 1 mark for the result of 3.22.
- 2 marks for sample Y: 1 mark for correct averaging and 1 mark for the result of 5.79.
(b) More acidic sample
Sample X is more acidic because its mean pH of 3.22 is lower than sample Y’s mean pH of 5.79.
Marking guide (1 mark):
- 1 mark for identifying sample X and supporting the choice with the lower pH.
(c) Precision and accuracy
The small spread of readings for each sample indicates good repeatability, or precision. The readings are close to one another.
However, precision does not establish accuracy. If the meter has a systematic error, such as incorrect calibration, all three readings could be close together while still differing from the true pH.
Marking guide (2 marks):
- 1 mark for linking the small spread to good precision or repeatability.
- 1 mark for explaining that a systematic error could affect all readings, so calibration or another accuracy check is still needed.
Solution 4
(a) Classification by pH
- Sample A: acidic, because its pH is 2.8.
- Sample B: alkaline, because its pH is 7.1.
- Sample C: acidic, because its pH is 2.9.
Marking guide (3 marks):
- 1 mark for each correct classification.
(b) Highest conductivity
Sample A has the highest conductivity, at \(1.60\ \mathrm{mS\,cm^{-1}}\).
Marking guide (1 mark):
- 1 mark for identifying sample A.
(c) Interpreting conductivity
Conductivity measures how readily a solution carries electrical current. Mobile ions in the solution carry that current.
Conductivity depends on the concentration and mobility of the ions present. It does not directly measure pH or uniquely identify whether a solution is acidic or alkaline.
Sample B can therefore have high conductivity while having a pH of 7.1. Dissolved ions can contribute to conductivity without making a solution strongly acidic.
To rank samples by acidity, the pH probe is the appropriate instrument. Conductivity provides additional information about the solution’s ability to conduct electricity, but it cannot replace pH measurements for this purpose.
Marking guide (3 marks):
- 1 mark for explaining that mobile ions allow a solution to conduct electricity.
- 1 mark for explaining that conductivity depends on ionic content rather than being a direct measure of pH.
- 1 mark for applying this distinction to sample B or explaining why conductivity alone cannot rank acidity.
Solution 5
(a) Weaknesses in the procedure
Any two of the following are acceptable:
- Using only a pH 7.00 buffer does not establish the meter’s response across a wider expected pH range.
- Using the same beaker without rinsing risks transferring material from one sample to the next.
- Recording the first displayed number may capture a reading that has not stabilised.
- Collecting only one sample from each site provides limited information about variation within each site.
Marking guide (2 marks):
- 1 mark for each distinct, valid weakness.
(b) Improvements and their effects
Several valid approaches are possible. Examples include:
| Weakness | Improvement | Why it helps |
|---|---|---|
| Only one calibration buffer is used. | Calibrate using fresh, suitable buffers that span the expected sample pH range. | Checks the meter’s response across a wider range of pH values. |
| The same beaker is used without rinsing. | Use separate clean, labelled containers, or clean the beaker appropriately between samples. | Reduces cross-contamination between samples. |
| The first displayed value is recorded. | Wait until the displayed reading stabilises before recording it. | Reduces errors caused by recording a changing value. |
| Only one sample is collected from each site. | Collect several independent samples using a consistent sampling method. | Provides evidence of variation within each site. |
Marking guide (4 marks):
- 2 marks for each weakness addressed: 1 mark for a specific, appropriate improvement and 1 mark for explaining how it improves the measurement or sampling quality.
- Each improvement must correspond to a weakness identified in part (a).
Reliable pH measurement in four stages
- Calibrate
Use fresh, suitable pH buffers.
Cover the expected sample pH range.
- Collect and label
Collect independent samples.
Use clean, separate labelled containers.
- Measure carefully
Rinse the probe between samples.
Wait for the reading to stabilise.
- Repeat and check
Repeat measurements and check meter performance.
Compare results only after these checks.
(c) Repeated readings versus independent samples
Repeated readings from one container mainly assess the repeatability of the measurement. Independent samples also provide information about variation between samples collected from the site.
Marking guide (1 mark):
- 1 mark for distinguishing instrument repeatability from variation among independently collected samples.
Solution 6
(a) Mean conductivity
For sample P:
\[ \begin{aligned} \text{Mean conductivity} &=\frac{0.42+0.44}{2}\\ &=0.43\ \mathrm{mS\,cm^{-1}} \end{aligned} \]
For sample Q:
\[ \begin{aligned} \text{Mean conductivity} &=\frac{0.87+0.89}{2}\\ &=0.88\ \mathrm{mS\,cm^{-1}} \end{aligned} \]
The mean conductivities are \(0.43\ \mathrm{mS\,cm^{-1}}\) for P and \(0.88\ \mathrm{mS\,cm^{-1}}\) for Q.
Marking guide (2 marks):
- 1 mark for the correct mean for sample P.
- 1 mark for the correct mean for sample Q.
(b) Consistency of sample R
The absolute difference between the two readings for sample R is:
\[ \begin{aligned} \text{Difference} &=|0.71-0.43|\\ &=0.28\ \mathrm{mS\,cm^{-1}} \end{aligned} \]
The differences for samples P and Q are both:
\[ |0.44-0.42|=0.02\ \mathrm{mS\,cm^{-1}} \]
\[ |0.89-0.87|=0.02\ \mathrm{mS\,cm^{-1}} \]
Sample R is substantially less consistent than P and Q. Its two readings should be investigated rather than automatically treated as equally reliable measurements.
Marking guide (2 marks):
- 1 mark for the absolute difference of \(0.28\ \mathrm{mS\,cm^{-1}}\).
- 1 mark for identifying that R’s readings are much less consistent than those for P and Q.
(c) Instrument stability and next steps
The expected reference conductivity is \(1.00\ \mathrm{mS\,cm^{-1}}\).
Before the run, the measured value is \(1.03\ \mathrm{mS\,cm^{-1}}\). Its absolute difference from the expected value is:
\[ |1.03-1.00|=0.03\ \mathrm{mS\,cm^{-1}} \]
This is within the permitted difference of \(0.05\ \mathrm{mS\,cm^{-1}}\), so the initial check is acceptable.
After the run, the measured value is \(1.20\ \mathrm{mS\,cm^{-1}}\):
\[ |1.20-1.00|=0.20\ \mathrm{mS\,cm^{-1}} \]
This exceeds the permitted difference. The post-run check is unacceptable and indicates that the instrument’s performance may have changed during the measurements.
The technician should not accept the full dataset as validated. The probe should be recalibrated as appropriate, checked again against the reference solution, and used to repeat the sample measurements once acceptable performance has been established. Sample R should also be remeasured because its duplicate readings differ substantially.
Marking guide (4 marks):
- 1 mark for identifying the initial check as acceptable because its deviation is \(0.03\ \mathrm{mS\,cm^{-1}}\).
- 1 mark for identifying the final check as unacceptable because its deviation is \(0.20\ \mathrm{mS\,cm^{-1}}\).
- 1 mark for concluding that the instrument did not demonstrate stable performance across the run.
- 1 mark for recommending recalibration, verification against the reference solution, and repetition of the affected measurements before accepting the comparisons.