
How to Choose an Indicator from a Titration Curve
Learn how to match an indicator's transition range to the steep region of a titration curve, and understand why the endpoint is not always the equivalence point.
Imagine you are titrating an acid with sodium hydroxide, and the pH suddenly shoots from about 4 to 10 when only a tiny extra volume of NaOH is added. You have methyl orange, bromothymol blue, and phenolphthalein on the bench. Which one should you choose?
The useful answer is not “the one closest to pH 7”. You need to look at the steep region of the titration curve and ask whether the indicator’s transition pH range sits inside it. If several indicators fit, several can be suitable.
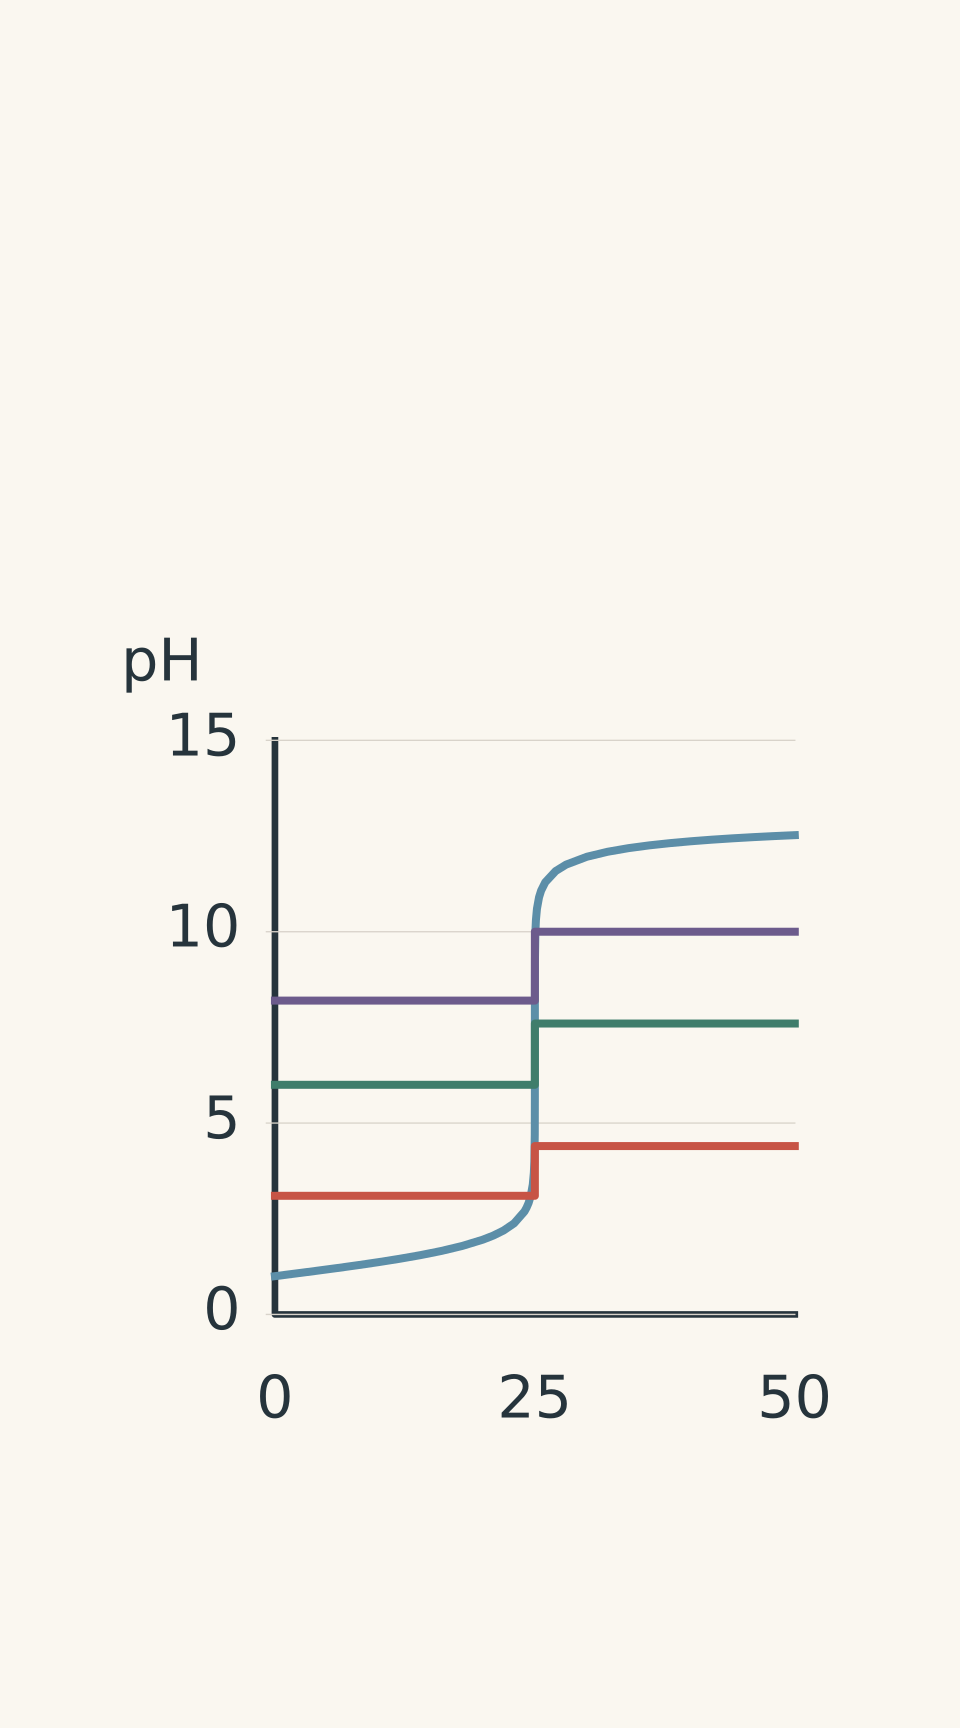
- Strong acid–strong base titration curve
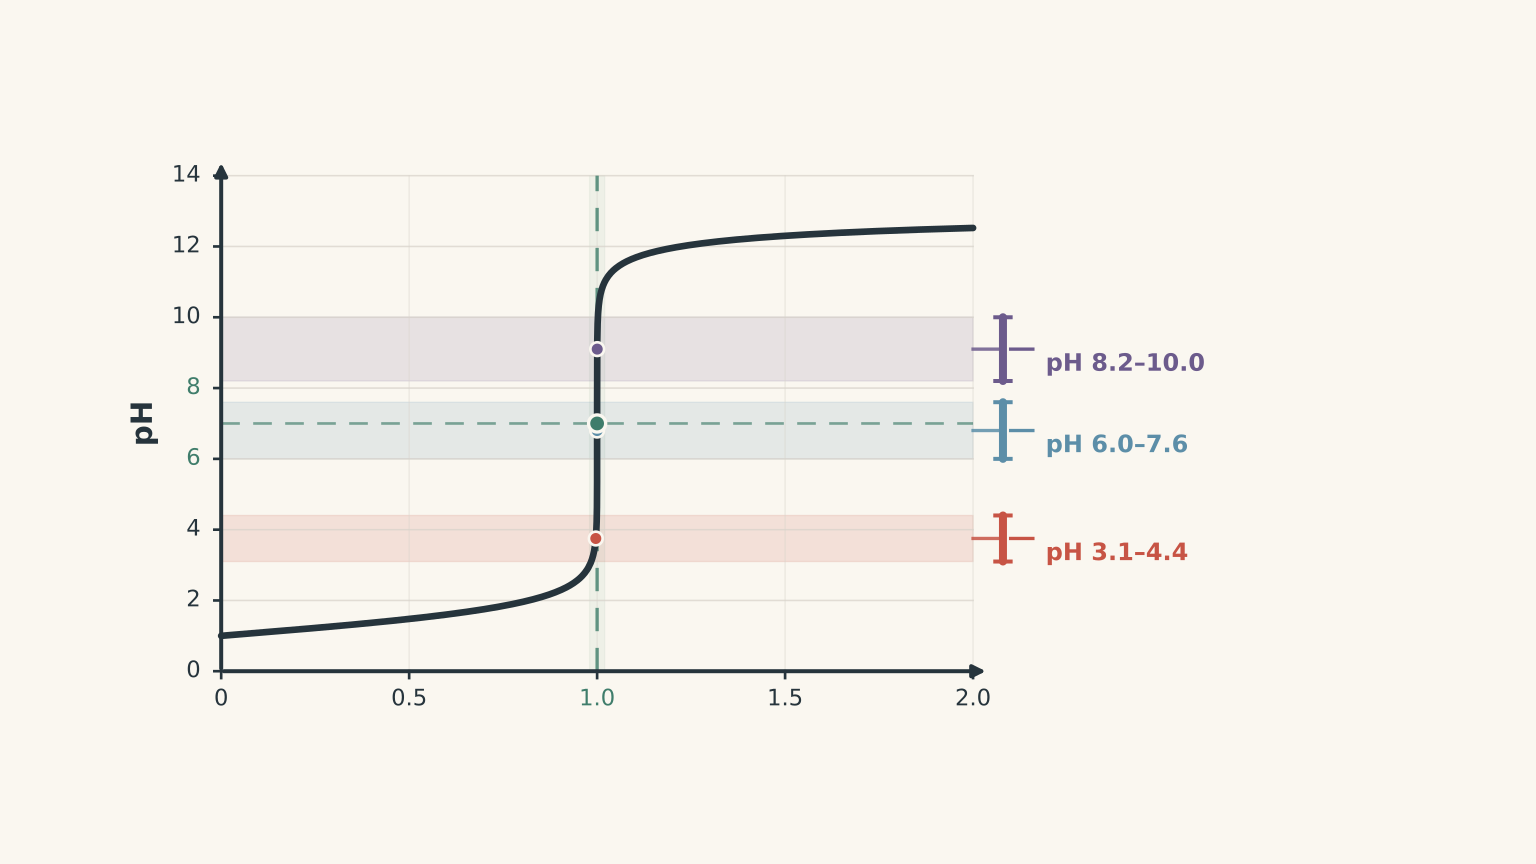
- Methyl orange transition range: pH 3.1–4.4
- Bromothymol blue transition range: pH 6.0–7.6
- Phenolphthalein transition range: pH 8.2–10.0
01The decision in one sentence
Choose an indicator whose transition range falls within the steep pH change around the equivalence point.
That sounds simple, but there are three ideas hiding inside it:
- Equivalence point: the point where the reactants have been mixed in the stoichiometric amounts required by the reaction.
- Transition range: the pH interval over which an indicator visibly changes colour.
- Steep region: the part of the titration curve where a tiny change in titrant volume causes a large change in pH.
The indicator gives you an endpoint: the point where you observe the colour change.
The equivalence point is the chemical target. The endpoint is the experimental signal you use to estimate it.
They are related, but they are not automatically the same point.
Past HSC Chemistry questions have tested this exact skill by asking students to match an indicator’s pH range to a titration curve. NESA marking guidance has also specifically linked an indicator’s colour-change range with the vertical section of the curve around equivalence.
02Start with the curve, not the indicator
Suppose the graph rises very sharply between pH 6 and pH 10.
If an indicator changes colour between pH 6.5 and 7.5, its entire colour change happens during that sharp rise. A tiny error in the volume of titrant will still put the endpoint very close to the equivalence volume.
Now imagine an indicator that changes between pH 2 and 4.
Its colour change happens well before the sharp rise. You will see the endpoint too early.
For the common case where NaOH is added to an acid:
- indicator range below the equivalence pH → tends to give an early endpoint
- indicator range above the equivalence pH → tends to give a late endpoint
- indicator range within the steep region → usually gives a useful endpoint
This is why the shape of the curve matters more than memorising “weak acid means phenolphthalein”.
Finding the equivalence point on a curve
On a typical S-shaped titration curve, the equivalence point lies around the middle of the sharpest part of the rise.
More precisely, it is associated with the inflection point, where the slope is greatest.
You do not need to stare at the graph and find a magical single pixel. Look for the central part of the near-vertical section.
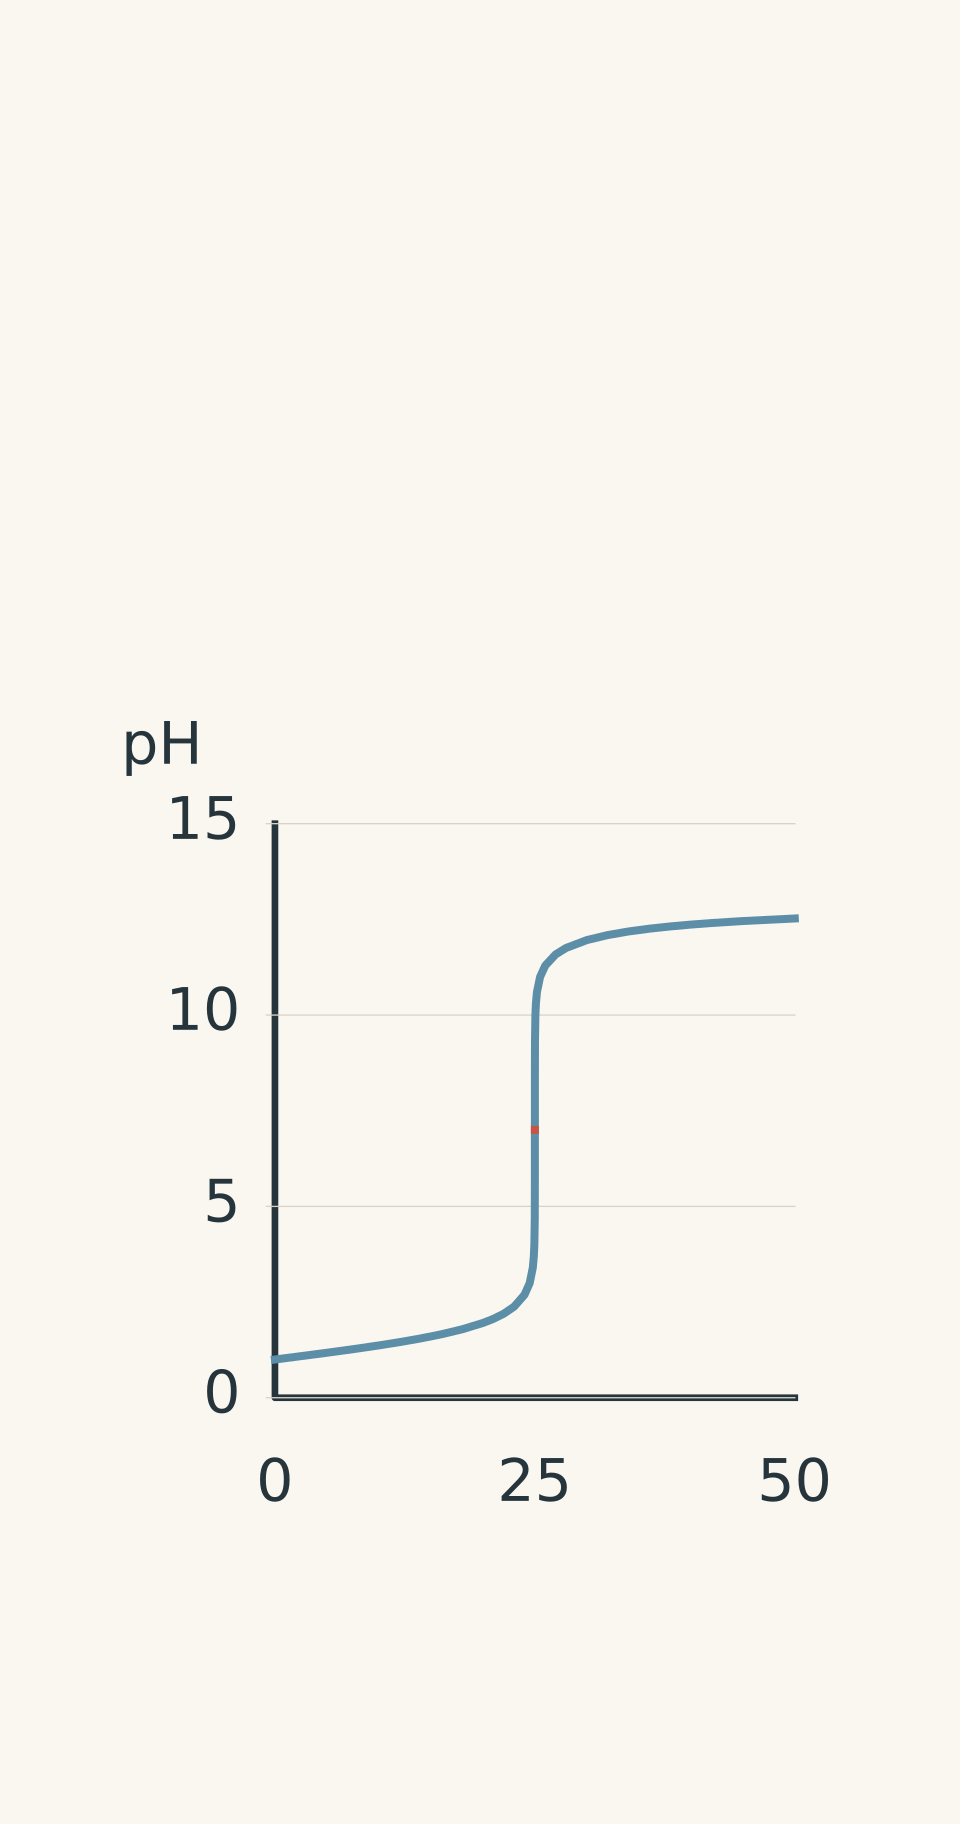
- Titration curve
- Equivalence point: 25.0 mL, pH 7.0
There is another useful clue. The pH at equivalence is not always 7.
For a strong acid-strong base titration, the equivalence pH is approximately 7 at 25 °C.
For a weak acid-strong base titration, the equivalence pH is above 7.
For a strong acid-weak base titration, the equivalence pH is below 7.
So if the steep rise is centred around pH 9, choosing an indicator that changes around pH 7 just because “neutralisation means 7” is the wrong move.
03What an indicator is actually doing
An indicator is not a light switch that suddenly flips at one exact pH.
A better mental model is a dimmer switch: the colour changes over a range.
The analogy breaks down because the indicator is not physically dimming. Its colour comes from an equilibrium between two chemical forms.
A simplified indicator equilibrium can be written as
\[ \ce{HInd(aq) + H2O(l) <=> H3O+(aq) + Ind-(aq)} \]
Here:
- \(\ce{HInd}\) is the acidic form of the indicator,
- \(\ce{Ind-}\) is the basic form,
- \(\ce{H3O+}\) represents the acidic conditions in the solution.
The two forms have different colours.
As the pH changes, the equilibrium shifts, changing the relative amounts of the two forms. During the transition range, both forms are present in significant amounts, so the colour gradually changes.
That is why an indicator has a range, not one exact transition pH. NESA HSC materials, for example, have listed methyl orange at about pH 3.1-4.4, methyl red at about pH 4.4-6.2, and phenolphthalein at about pH 8.3-10.0.
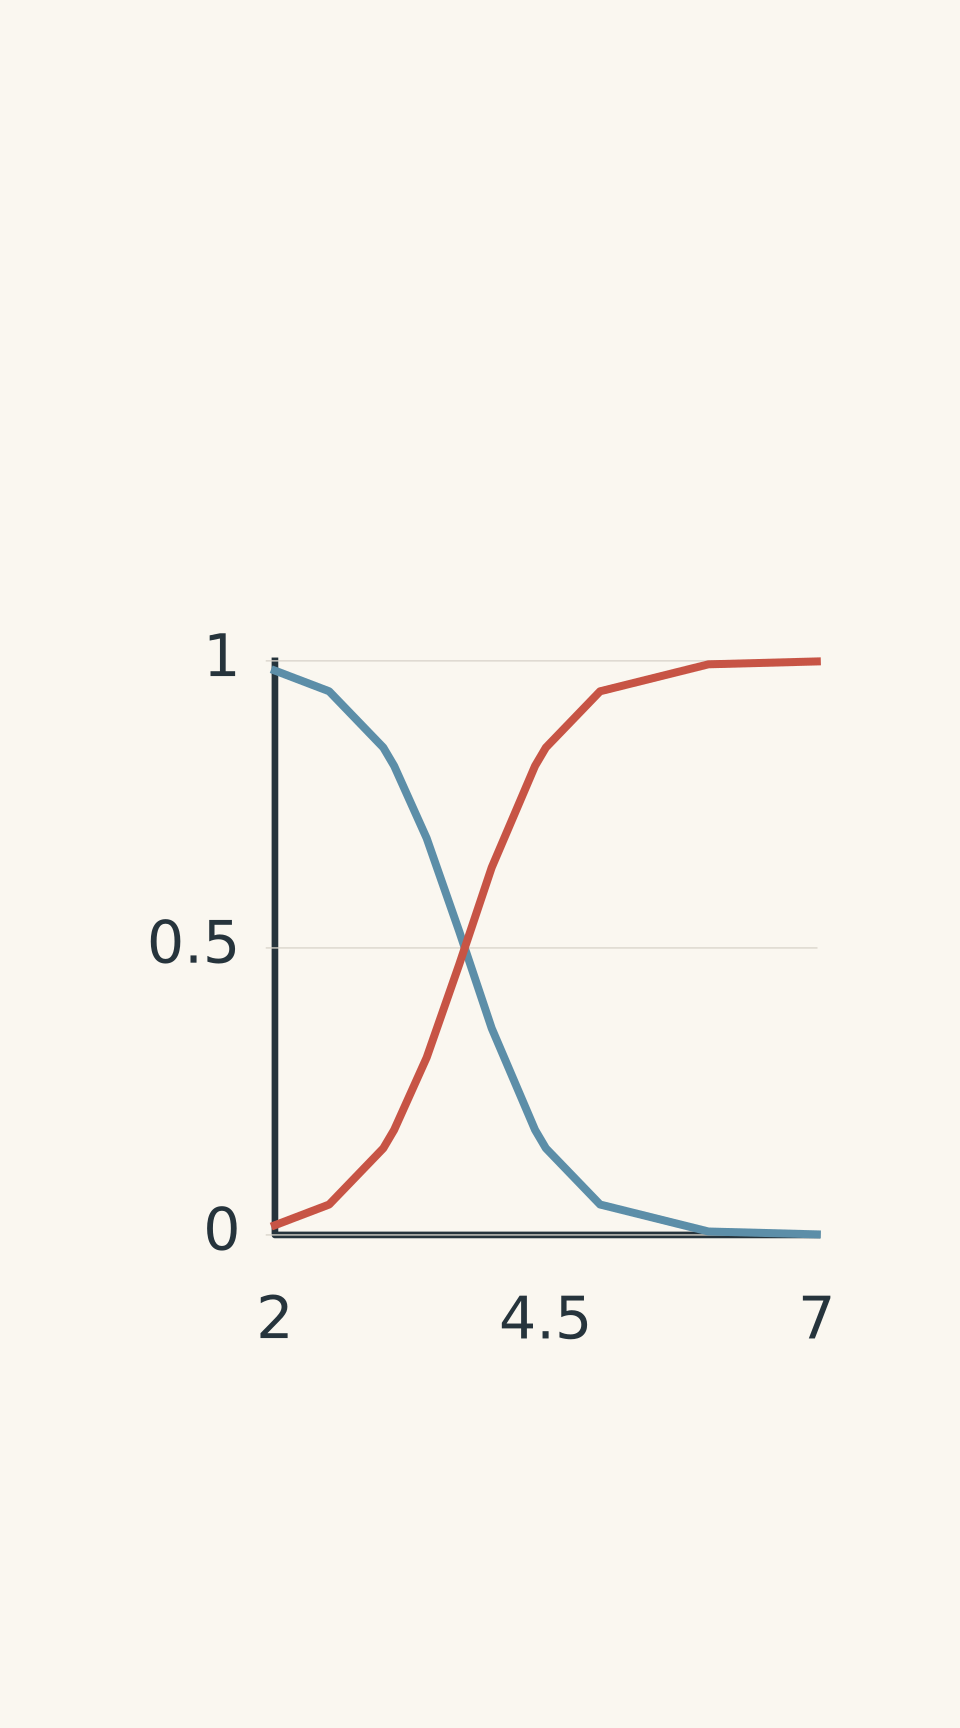
- HInd (acidic form; red)
- Ind⁻ (basic form; yellow)
04The indicator table you actually need
These are useful approximate ranges. If an exam question gives you a particular range, use the range supplied in the question.
| Indicator | Approximate transition range | Colour change |
|---|---|---|
| Methyl orange | 3.1-4.4 | red → yellow |
| Methyl red | 4.4-6.2 | red/pink → yellow |
| Bromothymol blue | 6.0-7.6 | yellow → blue |
| Phenolphthalein | 8.3-10.0 | colourless → pink |
Bromothymol blue is commonly listed around pH 6.0-7.6, while NESA HSC material has used phenolphthalein around pH 8.3-10.0.
Do not memorise this table as a set of four isolated facts. Memorise the positions on the pH scale.
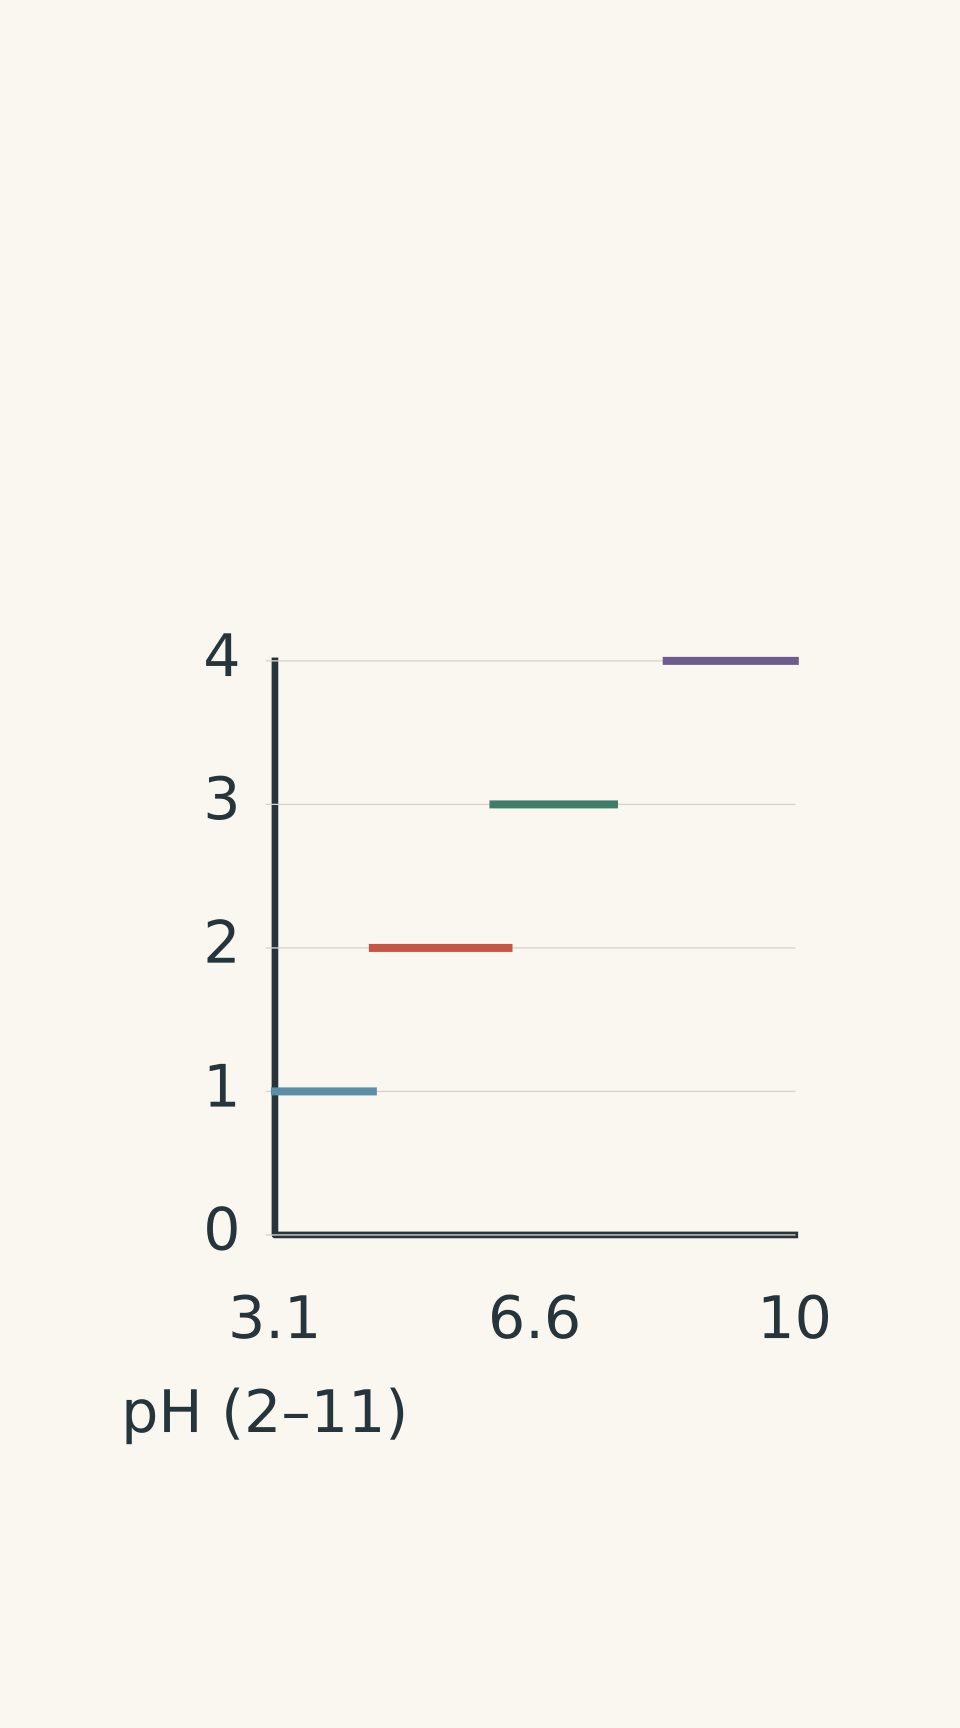
- Methyl orange · red → yellow · 3.1–4.4
- Methyl red · red/pink → yellow · 4.4–6.2
- Bromothymol blue · yellow → blue · 6.0–7.6
- Phenolphthalein · colourless → pink · 8.3–10.0
05A quick decision rule
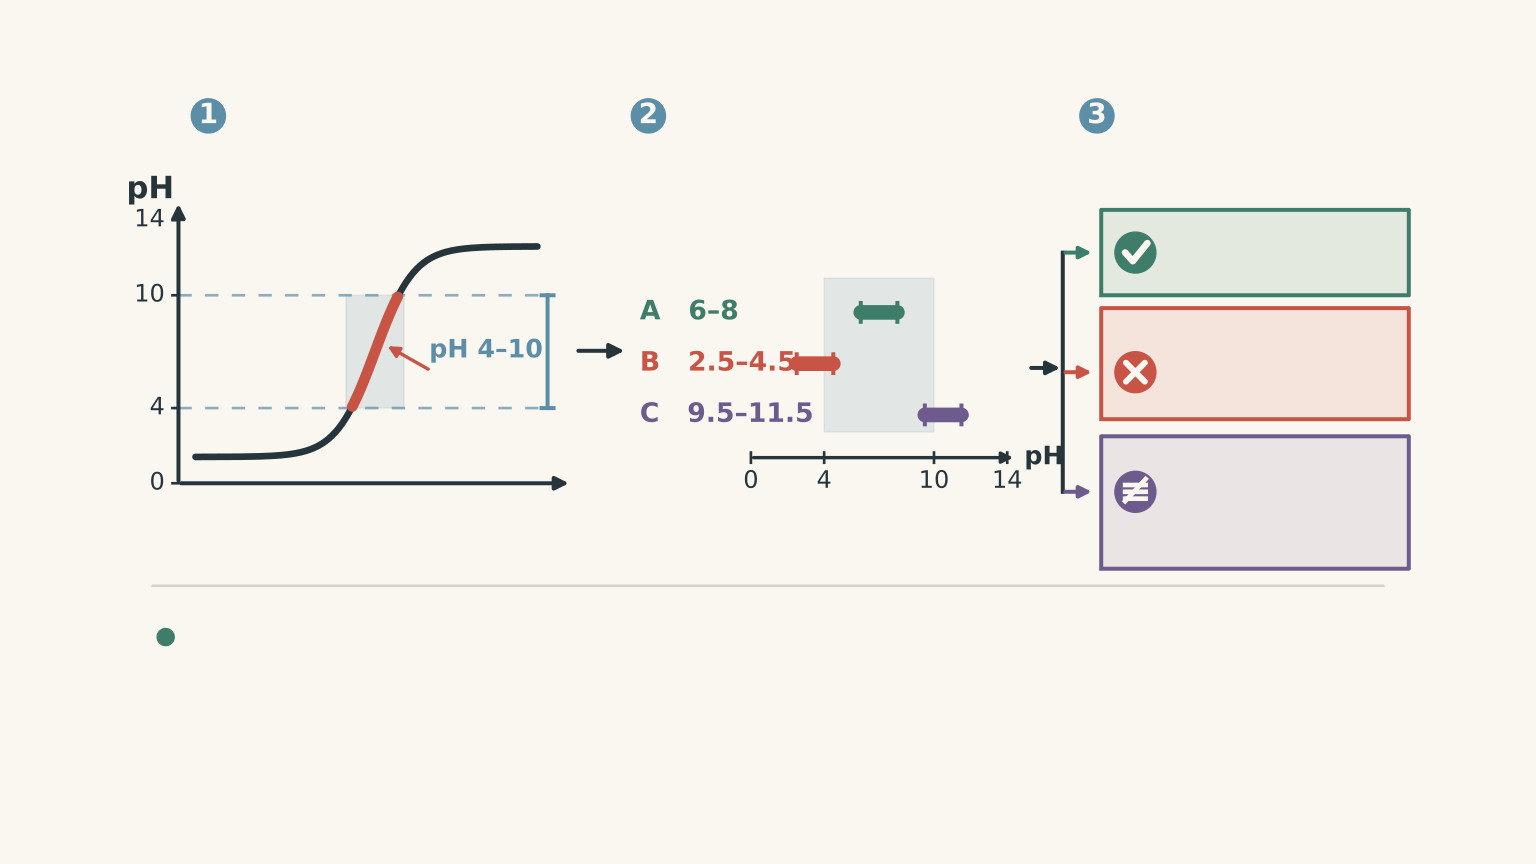
When given a titration curve and a list of indicators, use this sequence:
Step 1: Find the steep region of the curve.
Step 2: Estimate the pH range covered by that steep region.
Step 3: Place each indicator’s transition range against it.
Step 4: Keep the indicators whose colour change occurs within the steep region.
Step 5: If several indicators fit, do not invent a reason why only one can be correct.
If the question asks for a suitable indicator, more than one may be correct.
If it asks for the best indicator, prefer the one whose transition range is well centred within the steep region and close to the equivalence pH.
For exam questions, a very safe rule is:
The indicator’s transition range should lie within the near-vertical section of the titration curve.
06What the common titration curves tell you
Strong acid + strong base
The equivalence point is approximately pH 7.
The pH changes extremely rapidly around equivalence, so several indicators can work.
This is the situation where students sometimes get caught by the wording.
If methyl orange, bromothymol blue, and phenolphthalein all change colour during the steep rise, then all three can produce useful endpoints.
Bromothymol blue is particularly well centred around neutral pH, so it may be the most natural choice if the question asks for the best indicator.
But “best” and “suitable” are different questions.
Weak acid + strong base
The equivalence point is above pH 7.
Why?
At equivalence, the weak acid has been converted into its conjugate base. That conjugate base reacts with water:
\[ \ce{A-(aq) + H2O(l) <=> HA(aq) + OH-(aq)} \]
The \(\ce{OH-}\) makes the solution basic.
So the steep region is shifted towards higher pH values.
Phenolphthalein is often a good choice because its transition range sits in this region.
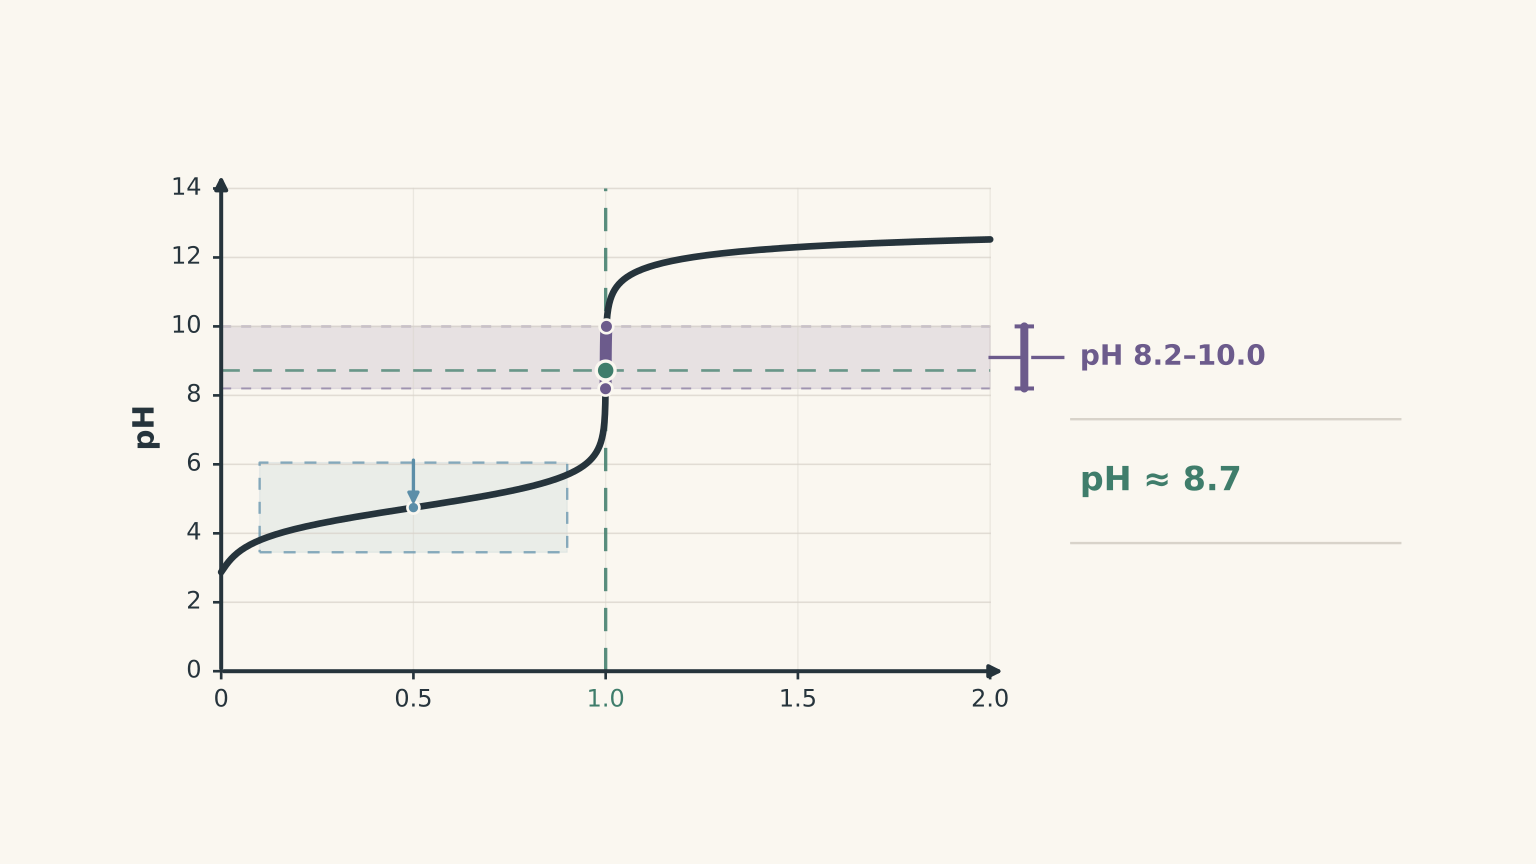
This is why the shortcut “neutralisation happens at pH 7” fails here. Neutralisation refers to the acid-base reaction reaching stoichiometric completion. It does not guarantee that the resulting solution has pH 7.
Strong acid + weak base
Now the equivalence point is below pH 7.
The weak base has been converted into its conjugate acid, which can react with water to produce \(\ce{H3O+}\):
\[ \ce{BH+(aq) + H2O(l) <=> B(aq) + H3O+(aq)} \]
So an indicator such as methyl red may be useful, depending on the actual curve.
The curve decides. The memorised acid/base label only gives you a starting prediction.
Weak acid + weak base
This is where indicator selection becomes much less attractive.
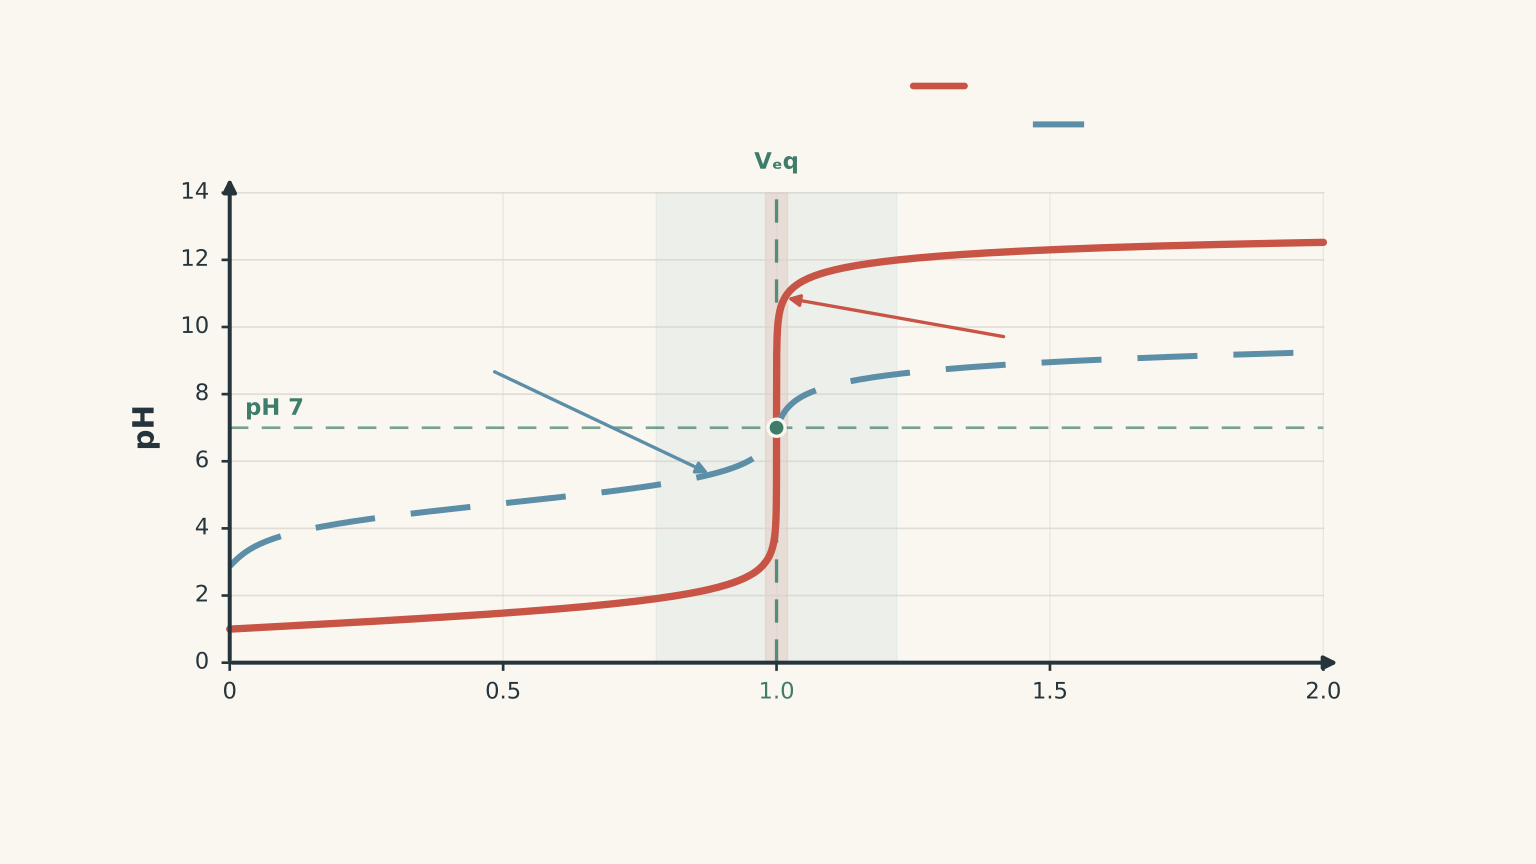
The pH change around equivalence may be too gradual to give a sharp visual endpoint. An indicator could change colour over a sizeable volume interval rather than during a tiny jump.
In that situation, a pH probe or another instrumental method can give a more precise equivalence point.
07Worked example: More than one indicator works
A strong acid is titrated with sodium hydroxide. The titration curve has an equivalence point at pH 7.0, and the steep region extends approximately from pH 3.0 to pH 11.0. Which of methyl orange, bromothymol blue, and phenolphthalein are suitable?
Step 1
The important pH interval is approximately 3.0-11.0.
Step 2
Methyl orange changes from pH 3.1-4.4. This lies within the steep region.
Bromothymol blue changes from pH 6.0-7.6. This also lies within the steep region.
Phenolphthalein changes from pH 8.3-10.0. This also lies within the steep region.
Step 3
All three are suitable because their transition ranges occur during the sharp pH change around equivalence.
If the question instead asks for the best indicator, bromothymol blue would be a sensible choice because its transition range is centred closest to the equivalence pH of 7.0.
The important point is that “suitable” does not mean “only one possible answer”.
08Worked example: A weak acid shifts the choice
A weak monoprotic acid is titrated with NaOH. The curve shows a buffer region followed by a steep rise centred at pH 9.0. Choose a suitable indicator from methyl orange, methyl red, bromothymol blue, and phenolphthalein.
Step 1
The equivalence point is around pH 9.0.
Step 2
Methyl orange: pH 3.1-4.4.
Methyl red: pH 4.4-6.2.
Bromothymol blue: pH 6.0-7.6.
Phenolphthalein: pH 8.3-10.0.
Step 3
Phenolphthalein’s entire transition range sits around the steep rise near pH 9.
The other three indicators change colour too early.
Step 4
Phenolphthalein is the suitable choice because its transition range overlaps the steep region around the equivalence point.
The tempting mistake is to choose bromothymol blue because it is associated with neutral pH. But the curve tells you that equivalence is not neutral in this titration.
09Worked example: Why endpoint and equivalence are not identical
A student titrates 25.00 mL of 0.1000 mol L\(^{-1}\) HCl with 0.1000 mol L\(^{-1}\) NaOH.
The stoichiometric equivalence point occurs at 25.00 mL of NaOH. Suppose the observed phenolphthalein endpoint is 25.05 mL. Explain why the endpoint is not the equivalence point, and determine the pH approximately at the endpoint.
The reaction is
\[ \ce{HCl(aq) + NaOH(aq) -> NaCl(aq) + H2O(l)} \]
Step 1
\[ n(\ce{HCl}) = cV = (0.1000\ \mathrm{mol\,L^{-1}}) (0.02500\ \mathrm{L}) = 2.500\times10^{-3}\ \mathrm{mol} \]
Because the reaction is 1:1, the same number of moles of NaOH is required at equivalence.
Step 2
The endpoint is 25.05 mL, which is 0.05 mL beyond the 25.00 mL equivalence volume.
\[ n_{\text{excess}} = (0.1000\ \mathrm{mol\,L^{-1}}) (0.00005\ \mathrm{L}) \]
\[ n_{\text{excess}} = 5.00\times10^{-6}\ \mathrm{mol} \]
Step 3
\[ V_{\text{total}} = 25.00\ \mathrm{mL} +25.05\ \mathrm{mL} =50.05\ \mathrm{mL} =0.05005\ \mathrm{L} \]
Step 4
\[ [\ce{OH-}] = \frac{5.00\times10^{-6}\ \mathrm{mol}} {0.05005\ \mathrm{L}} \]
\[ [\ce{OH-}] \approx 9.99\times10^{-5}\ \mathrm{mol\,L^{-1}} \]
So
\[ \mathrm{pOH} =-\log_{10}[\ce{OH-}] \approx4.00 \]
At 25 °C,
\[ \mathrm{pH}=14.00-\mathrm{pOH} \approx10.00 \]
Step 5
The endpoint is about pH 10, while the equivalence point is pH 7.
They are not the same point.
However, they are only 0.05 mL apart because the titration curve is extremely steep near equivalence. That is exactly why an indicator can still be useful: a noticeable pH difference can correspond to a tiny volume difference.
If a student incorrectly used 25.05 mL as the equivalence volume, they would calculate
\[ c(\ce{HCl}) = \frac{(0.1000)(0.02505)} {0.02500} \]
\[ c(\ce{HCl})=0.1002\ \mathrm{mol\,L^{-1}} \]
The true concentration is 0.1000 mol L\(^{-1}\), so the endpoint has produced a small high bias.
10The traps worth knowing
“The indicator changes colour at the equivalence point.”
Not exactly.
The indicator changes colour over a pH range. The endpoint is where you observe that change. A good indicator makes the endpoint very close to the equivalence point in terms of titrant volume.
“Equivalence always means pH 7.”
No.
Strong acid + strong base gives an equivalence pH around 7 at 25 °C, but weak acids and weak bases change the pH at equivalence because their conjugates react with water.
“The indicator with the closest single pH value is automatically best.”
Not quite.
Indicators have ranges, not single transition values. Look at the whole range and compare it with the steep region.
“If an indicator is not centred exactly on equivalence, it is useless.”
Also no.
In a very steep titration curve, several indicator ranges can fall within the useful vertical section. Methyl orange and phenolphthalein can both work for a strong acid-strong base titration, even though they change colour on opposite sides of pH 7.
“A visible endpoint proves that equivalence has been reached.”
No.
A visible endpoint is evidence from the indicator. Equivalence is defined by stoichiometry.
For a 1:1 acid-base reaction, the equivalence volume can be calculated from the mole relationship. The indicator is an experimental way of detecting a volume close to that point.
“If no indicator fits, I just pick the closest one.”
This is the dangerous one.
If the curve has no sufficiently sharp pH jump around equivalence, a visual indicator may simply not be precise enough. A pH probe or another appropriate method may be better.
11Quick self-check before you choose
Before looking at the indicator names, ask yourself:
- Where is the equivalence point on the curve?
- What pH is the equivalence point near?
- What pH interval contains the steepest part of the curve?
- Which indicator transition ranges sit inside that interval?
- Does the question ask for a suitable indicator or the best indicator?
- If no range fits neatly, is the curve too shallow for a reliable visual endpoint?
If you can answer those questions, you are choosing from the chemistry of the curve rather than guessing from a memorised acid/base pair.
12Questions and solutions
Question 1
A titration curve has an equivalence point at pH 7.0. The steep region extends from approximately pH 6.0 to pH 8.0.
The available indicators have these transition ranges:
- methyl orange: pH 3.1-4.4
- methyl red: pH 4.4-6.2
- bromothymol blue: pH 6.0-7.6
- phenolphthalein: pH 8.3-10.0
Which indicator is the most suitable choice based on the steep region? Explain.
Solution 1
Bromothymol blue is the most suitable choice. Its transition range, pH 6.0-7.6, lies within the steep region around the equivalence point.
Methyl orange changes too early, at pH 3.1-4.4. Phenolphthalein changes too late, at pH 8.3-10.0. Methyl red overlaps the lower edge, but its range extends below the steep region.
Bromothymol blue gives a colour change while the pH is changing rapidly, so its endpoint should be close to the equivalence volume.
Question 2
Two titrations produce the following curves.
Curve X: NaOH is added to an acid. There is a buffer region before equivalence, and the steep region is centred at pH 9.1.
Curve Y: HCl is added to a base. The steep region is centred at pH 5.2.
Using the indicator ranges above:
- identify a suitable indicator for Curve X,
- identify a suitable indicator for Curve Y,
- explain what the equivalence pH tells you about the acid/base combination in each case.
Solution 2
Curve X is best matched with phenolphthalein, and Curve Y is best matched with methyl red. The equivalence pH also indicates that Curve X is a weak acid-strong base titration, while Curve Y is a weak base-strong acid titration.
For Curve X, the equivalence region is around pH 9.1. Phenolphthalein changes over pH 8.3-10.0, so its transition range sits around the steep rise. The buffer region before equivalence also supports the presence of a weak acid being neutralised by strong base.
For Curve Y, the equivalence region is around pH 5.2. Methyl red changes over pH 4.4-6.2, so it matches the steep region.
The reason Curve X has an equivalence pH above 7 is that the conjugate base of the weak acid reacts with water to produce \(\ce{OH-}\). Curve Y has an equivalence pH below 7 because the conjugate acid of the weak base produces \(\ce{H3O+}\).
The tempting route is to choose phenolphthalein whenever NaOH appears. The constraint that changes the answer is the actual pH of the equivalence region shown by the curve.
Question 3
A strong acid is titrated with a strong base. Its curve has an equivalence point at pH 7.0, but the pH rises from about 3.0 to 11.0 during the very steep section.
A student says:
“Only bromothymol blue can be suitable because the equivalence point is at pH 7.”
Evaluate the statement. Which of the four familiar indicators could actually give a useful endpoint?
Solution 3
The statement is incorrect: methyl orange, bromothymol blue, and phenolphthalein can all give useful endpoints for this curve. Their transition ranges all lie within the very steep pH change from about 3 to 11.
Methyl orange changes at pH 3.1-4.4.
Bromothymol blue changes at pH 6.0-7.6.
Phenolphthalein changes at pH 8.3-10.0.
Because the curve is so steep, all three colour changes occur over a very small change in titrant volume near equivalence.
Bromothymol blue is a sensible choice if the question asks for the best indicator because its range is closest to the equivalence pH of 7. But that does not make methyl orange and phenolphthalein unsuitable.
The trap is confusing “best” with “suitable”. Indicator selection is about the transition range versus the steep region, not whether the transition range contains the exact equivalence pH.
Question 4
A student titrates 25.00 mL of 0.1000 mol L\(^{-1}\) HCl with 0.1000 mol L\(^{-1}\) NaOH.
The equivalence point occurs at exactly 25.00 mL of NaOH. The student records the phenolphthalein endpoint at 25.05 mL.
Assume the temperature is 25 °C.
Calculate:
- the excess amount of NaOH present at the endpoint,
- the pH at the endpoint,
- the HCl concentration the student would calculate if they incorrectly treated 25.05 mL as the equivalence volume.
Explain why the endpoint can be useful even though it is not exactly the equivalence point.
Solution 4
The endpoint contains \(5.00\times10^{-6}\) mol of excess NaOH, has a pH of approximately 10.00, and would give a calculated HCl concentration of 0.1002 mol L\(^{-1}\). The endpoint is useful because it is only 0.05 mL from the equivalence volume, despite being at a noticeably different pH.
The reaction is
\[ \ce{HCl(aq) + NaOH(aq) -> NaCl(aq) + H2O(l)} \]
Step 1: Find the amount of NaOH required at equivalence.
\[ n(\ce{HCl}) = (0.1000\ \mathrm{mol\,L^{-1}}) (0.02500\ \mathrm{L}) \]
\[ n(\ce{HCl}) =2.500\times10^{-3}\ \mathrm{mol} \]
The reaction is 1:1, so \(2.500\times10^{-3}\) mol of NaOH is required at equivalence.
Step 2: Find the amount of NaOH actually added at the endpoint.
\[ n(\ce{NaOH}) = (0.1000\ \mathrm{mol\,L^{-1}}) (0.02505\ \mathrm{L}) \]
\[ n(\ce{NaOH}) =2.505\times10^{-3}\ \mathrm{mol} \]
Therefore,
\[ n_{\text{excess}} = 2.505\times10^{-3} - 2.500\times10^{-3} \]
\[ n_{\text{excess}} = 5.00\times10^{-6}\ \mathrm{mol} \]
Step 3: Find the hydroxide concentration at the endpoint.
The total volume is
\[ V_{\text{total}} = 0.02500+0.02505 = 0.05005\ \mathrm{L} \]
Therefore,
\[ [\ce{OH-}] = \frac{5.00\times10^{-6}} {0.05005} \]
\[ [\ce{OH-}] \approx9.99\times10^{-5}\ \mathrm{mol\,L^{-1}} \]
So
\[ \mathrm{pOH} \approx4.00 \]
and, at 25 °C,
\[ \mathrm{pH} = 14.00-4.00 \approx10.00 \]
Step 4: Calculate the concentration the student would obtain.
If the student incorrectly treats 25.05 mL as the equivalence volume,
\[ c(\ce{HCl}) = \frac{(0.1000)(0.02505)} {0.02500} \]
\[ c(\ce{HCl}) = 0.1002\ \mathrm{mol\,L^{-1}} \]
The true concentration is 0.1000 mol L\(^{-1}\), so the endpoint has caused a small overestimate.
This shows the key idea: endpoint and equivalence are different, but a good indicator makes their volumes very close because the titration curve is steep.
Question 5
Two titrations use the same strong monoprotic acid and strong base at 25 °C. In both cases, the equivalence point is at approximately pH 7.0.
However, their curves have different shapes.
- Titration A: the steep region extends only from pH 6.0 to pH 8.0.
- Titration B: the steep region extends from pH 3.0 to pH 11.0.
The available indicators are methyl orange, methyl red, bromothymol blue, and phenolphthalein.
A student argues:
“The equivalence pH is the same in both titrations, so the same indicators must be suitable.”
Using the rule that an indicator’s transition range should lie within the steep region:
- Identify all suitable indicators for Titration A.
- Identify all suitable indicators for Titration B.
- Explain how the two titrations can have the same equivalence pH but require different indicator choices.
- Suppose Titration A becomes even more dilute, and its steep region narrows to pH 6.4-7.6. What does this imply about the available indicators and the reliability of a visual endpoint?
Solution 5
The student’s argument is wrong: equivalence pH and curve steepness are separate pieces of information. Titration A has only bromothymol blue as an ideal choice under the stated rule, while Titration B can use all four indicators. If Titration A becomes dilute enough that its steep region is only pH 6.4-7.6, none of the listed indicators has its entire transition range inside that region.
Part 1: Titration A
The steep region is pH 6.0-8.0.
Bromothymol blue changes from pH 6.0-7.6, so its whole range fits.
Methyl orange, pH 3.1-4.4, is too low.
Methyl red, pH 4.4-6.2, extends below the steep region.
Phenolphthalein, pH 8.3-10.0, is too high.
Therefore, bromothymol blue is the only ideal choice from the list.
Part 2: Titration B
The steep region is pH 3.0-11.0.
Methyl orange: 3.1-4.4 → suitable.
Methyl red: 4.4-6.2 → suitable.
Bromothymol blue: 6.0-7.6 → suitable.
Phenolphthalein: 8.3-10.0 → suitable.
Therefore, all four indicators are suitable under the stated rule.
Part 3: Why can the equivalence pH be the same?
Both titrations use a strong acid and a strong base, so the chemical nature of the solution at equivalence is essentially the same. At 25 °C, the equivalence pH is therefore approximately 7 in both cases.
But concentration affects how dramatically the pH changes around equivalence.
A more concentrated titration can produce a very sharp pH jump. A sufficiently dilute titration produces a less dramatic change in pH, so fewer indicator ranges may fit safely inside the steep region.
The tempting route is to use the equivalence pH alone. The missing constraint is the width of the steep region.
Part 4: The more dilute Titration A
The new steep region is pH 6.4-7.6.
Bromothymol blue extends from pH 6.0 to 7.6, so part of its transition occurs outside the stated steep region.
The other indicators are even further away.
Therefore, none of the listed indicators is an ideal choice under the stated rule.
At that point, a visual indicator is no longer the obvious measurement tool. A pH probe can be used to collect pH against titrant volume and identify the equivalence point from the curve.
The deeper lesson is that you cannot choose an indicator from the equivalence pH alone. You need to consider both where equivalence occurs and how sharply the pH changes around it.
The next useful step is to take a real titration curve from your current NESA material or a school task and cover the indicator names. First mark the equivalence point and the steep pH region. Only then bring the indicator ranges back in. That turns indicator selection from a memory test into a decision you can justify from the graph.