
Why AAS and Gravimetry Give Different Water Concentrations
AAS and gravimetry can report different copper concentrations for the same water sample, even when both methods appear reliable. Learn how to diagnose calibration errors, matrix effects, incomplete precipitation, contamination, and sample-handling problems.
You test one bottle of water for copper. Atomic absorption spectroscopy (AAS) reports \(2.40\ \mathrm{mg\,L^{-1}}\), while gravimetric analysis reports \(3.00\ \mathrm{mg\,L^{-1}}\). Which result should you trust?
The tempting answers are to trust AAS because it uses an instrument, trust gravimetry because it measures mass, or average the two results. None is justified yet. Both methods can produce accurate results, and both can introduce systematic errors that push a calculated concentration away from the true value.
The useful question is not which method sounds more reliable. It’s where each result came from, what each method actually measured, and which checks could explain the disagreement.
Two methods, different measured signals
| Atomic absorption spectroscopy (AAS) | Sample → atomised copper atoms → characteristic light absorption → calibration → concentration Measured signal: absorbance. |
|---|---|
| Gravimetric analysis | Sample → Cu(OH)₂ precipitate → heat to form CuO → measure mass → stoichiometric conversion → concentration Measured signal: mass of solid CuO. |
01First, check that you’re measuring the same thing
Before investigating experimental errors, establish exactly what concentration each method is supposed to report.
A water sample can contain copper dissolved in the water and copper attached to suspended particles. These are different fractions of the same element.
- Dissolved copper is the copper present in the fraction that passes through the specified filter.
- Total recoverable copper includes dissolved copper and copper released from suspended material during the specified sample preparation.
AAS does not automatically measure one fraction or the other. The sample preparation determines which fraction reaches the instrument. Similarly, gravimetry can estimate dissolved copper or total recoverable copper, depending on how the sample is prepared.
For example, suppose an AAS sample is filtered before analysis, but a gravimetric sample is left unfiltered and then digested to release copper from suspended particles. The two results can legitimately differ, even if both methods work perfectly.
The word same needs care here. Two aliquots from the same bottle are not necessarily analytically equivalent if they undergo different preparation steps.
Also check that both results use the same units, refer to the same original sample volume, and include the same dilution corrections.
02What AAS measures – and where it can go wrong
AAS estimates an element’s concentration from the absorption of characteristic light by atoms produced from the sample. For copper analysis, the instrument converts the sample into free atoms and measures how much light at a selected wavelength those atoms absorb.
AAS does not weigh the copper. It measures an optical signal and uses calibration data to convert that signal into a concentration.
1. Check the calibration before blaming the sample
The instrument measures absorbance, represented by \(A\). You prepare standards containing known copper concentrations, measure their absorbances, and construct a calibration relationship.
Over a suitable working range, this can be represented as
\[ A=kC+b \]
where:
- \(A\) is the measured absorbance.
- \(C\) is the copper concentration, in \(\mathrm{mg\,L^{-1}}\).
- \(k\) is the calibration slope.
- \(b\) is the intercept, which accounts for the fitted background signal.
The calibration converts an observed signal into an estimated concentration. If the calibration is wrong, the reported concentration can be wrong even when the instrument measures absorbance consistently.
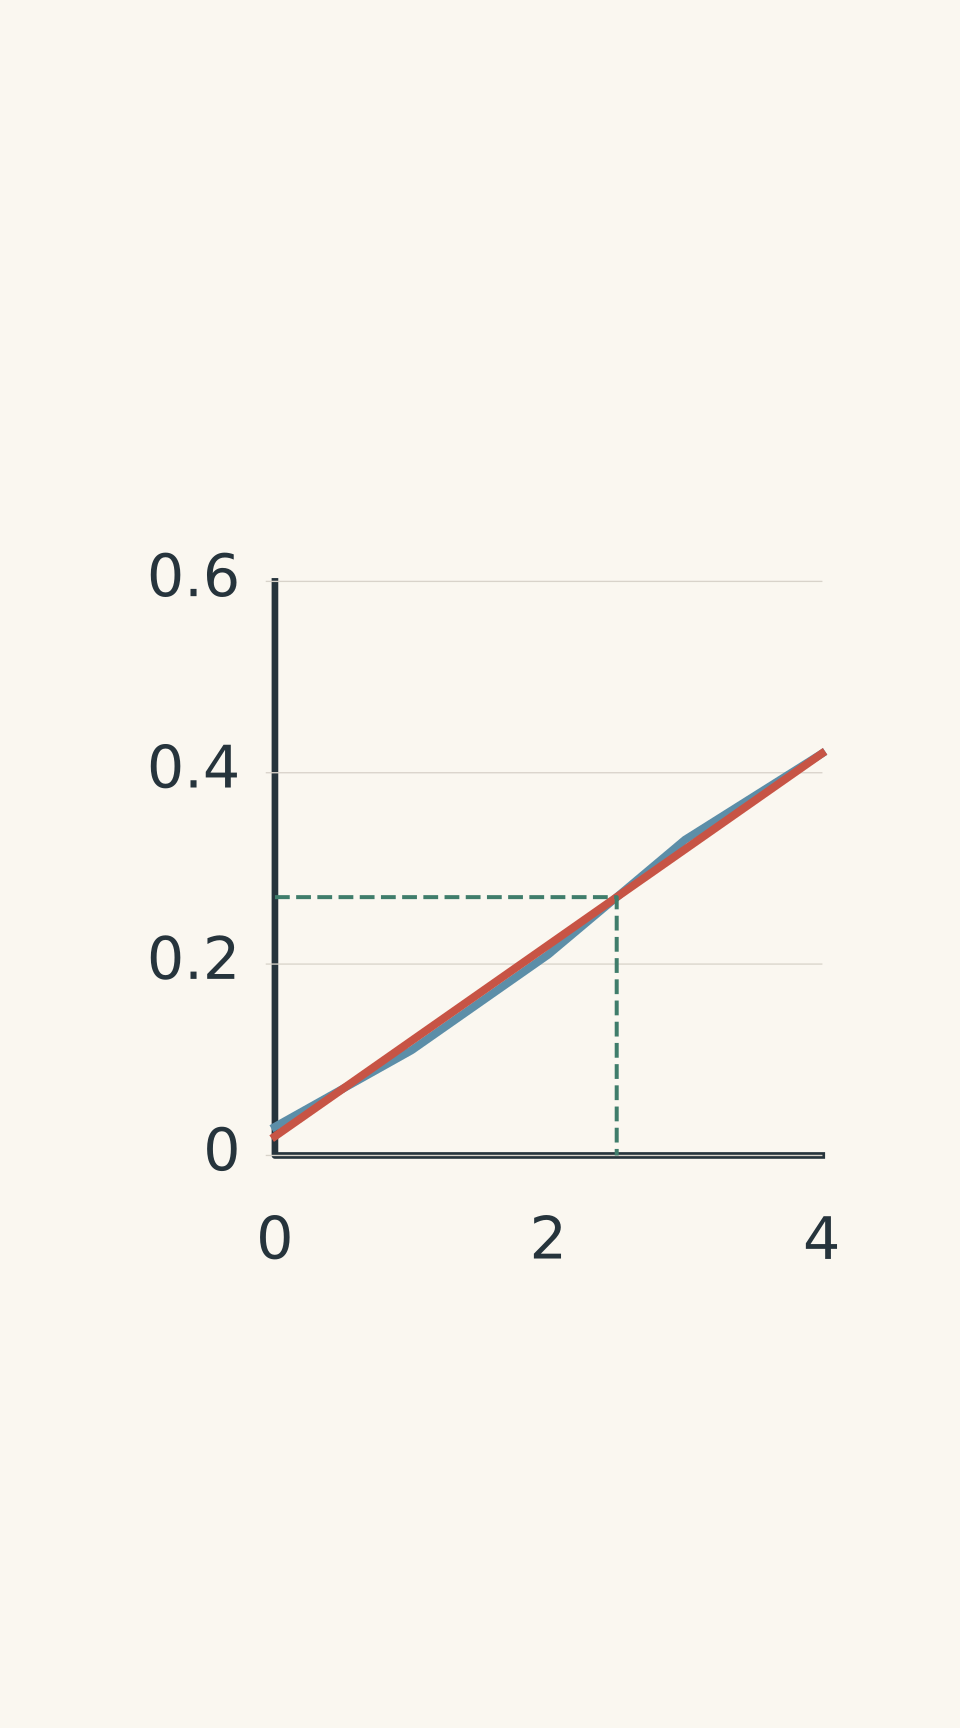
- Calibration standards (schematic)
- Best-fit line
- Unknown: A = 0.270, C = 2.50 mg/L
Check these points before accepting the result:
- The standards were prepared correctly. Incorrect standard concentrations distort the calibration.
- The blank was appropriate. A blank helps identify background signals from the solvent, reagents, and sample preparation.
- The sample falls within the calibrated range. Extrapolating far beyond the standards makes the result less dependable.
- The instrument response is stable. Drift or inconsistent operating conditions can change the signal.
- The dilution factor is correct. The instrument measures the diluted solution, not automatically the original sample.
That last point is a common source of error. If you dilute a sample to one-fifth of its original concentration, the measured concentration must be multiplied by five to recover the original value.
A calibration curve can look neat and still give the wrong answer if the standards, blank, or dilution calculations are unsuitable.
2. Understand matrix effects
A calibration standard and a water sample can contain the same amount of copper but produce different absorbances.
Why? The sample contains other substances as well as copper. This surrounding mixture is called the matrix.
High concentrations of dissolved salts, acids, or other substances can affect how the sample enters the atomiser, how efficiently copper atoms form, or how much background signal reaches the detector. Chemical and ionisation effects can also change the number of atoms contributing to the measured signal.
These are called matrix effects.
The effect can suppress or enhance the signal. Therefore, a matrix effect does not always make the reported concentration too low.
Consider a sample containing \(5.0\ \mathrm{mg\,L^{-1}}\) of copper. If its matrix suppresses the absorbance, an external calibration prepared in a simpler solution might report a concentration below \(5.0\ \mathrm{mg\,L^{-1}}\). The instrument can be functioning normally while the calibration gives a biased result for that particular sample.
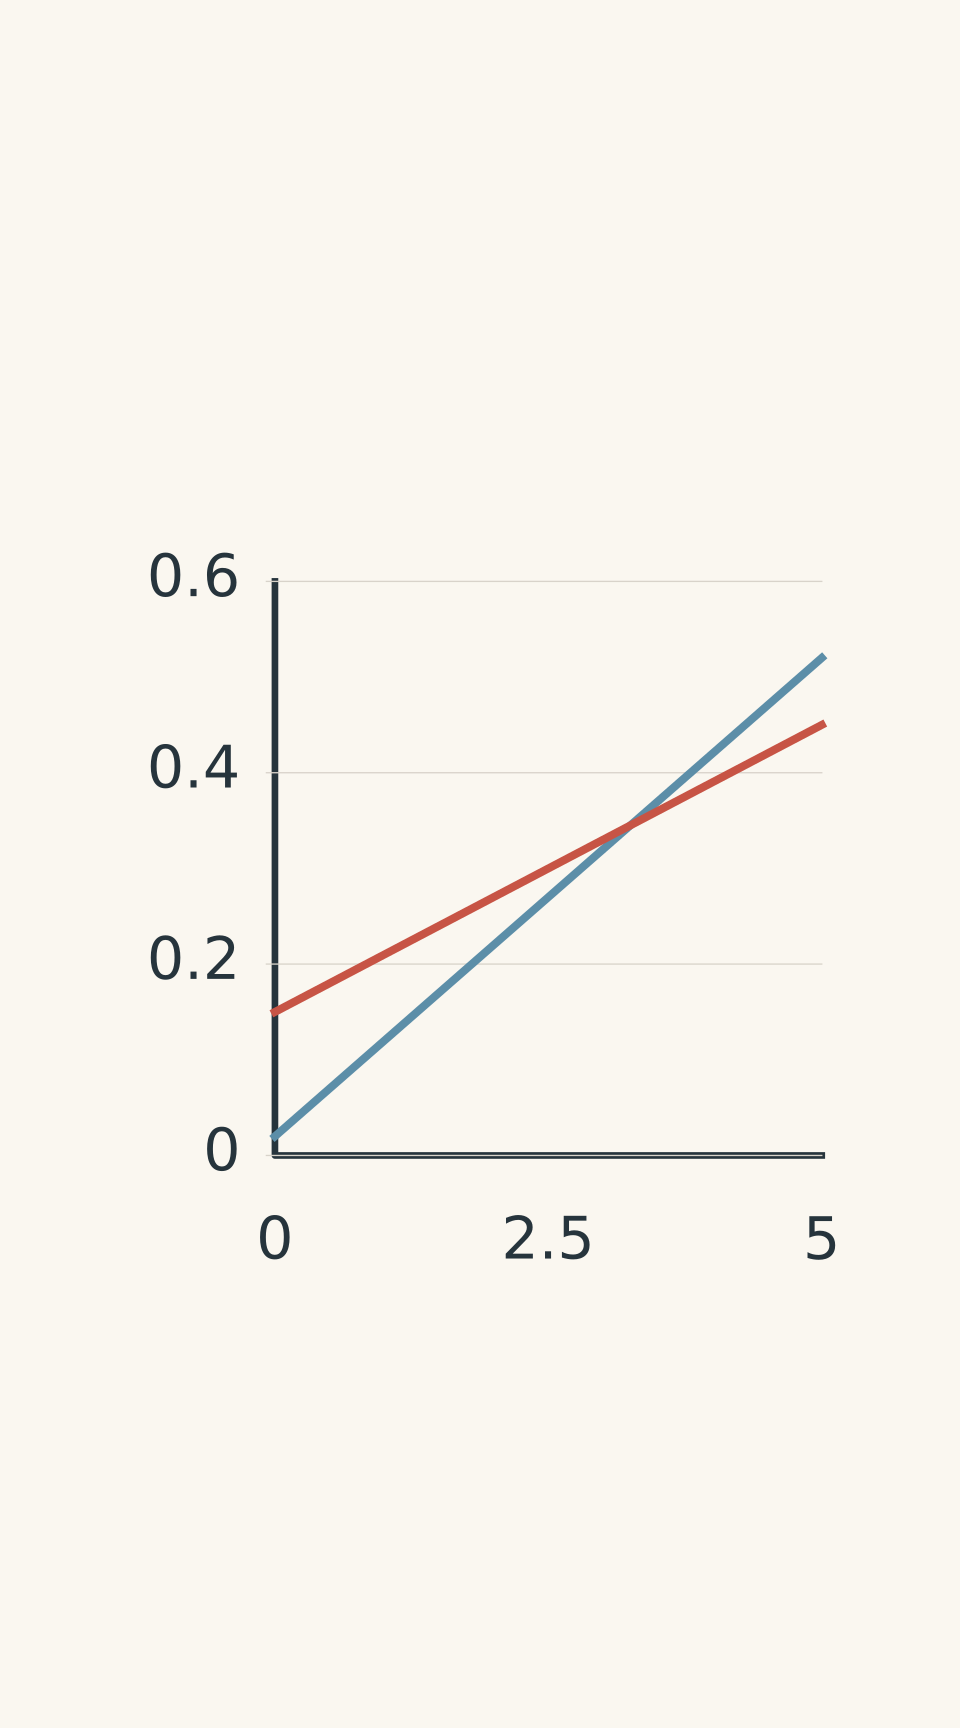
- External standards
- Sample matrix: signal suppression
How can you test whether the matrix is responsible?
Use a spike-recovery test. Add a known amount of copper to a separate portion of the sample, then measure the increase in reported concentration.
\[ \%\text{ recovery} = \frac{C_{\text{spiked}}-C_{\text{unspiked}}} {C_{\text{added}}} \times 100\% \]
Here, \(C_{\text{spiked}}\) is the reported concentration after adding copper, \(C_{\text{unspiked}}\) is the original reported concentration, and \(C_{\text{added}}\) is the concentration increase expected from the addition.
Suppose you add \(2.00\ \mathrm{mg\,L^{-1}}\) of copper, but the measured concentration increases by only \(1.60\ \mathrm{mg\,L^{-1}}\). The recovery is
\[ \frac{1.60}{2.00}\times100\%=80.0\% \]
The method has recovered only 80% of the added amount according to that measurement procedure. This is evidence of a problem, such as signal suppression, although the test alone does not prove its exact cause.
Other useful checks include:
- Standard additions: add known amounts of copper to several portions of the actual sample. This helps account for matrix-dependent sensitivity.
- Matrix-matched calibration: prepare standards in a solution with a similar matrix to the sample.
- Dilution checks: dilute the sample and recalculate its original concentration. If the corrected result changes substantially, investigate matrix effects, calibration range, or other concentration-dependent problems.
AAS is often very useful for low concentrations because it can be sensitive to small amounts of an element. That sensitivity does not guarantee accuracy in every matrix.
03What gravimetric analysis measures – and where it can go wrong
Gravimetric analysis uses a different route. Instead of measuring light absorption, it converts the analyte into a solid of known composition and determines the analyte amount from the mass of that solid.
For a suitable copper determination, dissolved copper ions can be precipitated as copper(II) hydroxide. Heating the precipitate converts it to copper(II) oxide, which can then be weighed.
The reactions are
\[ \ce{Cu^2+(aq) + 2OH^-(aq) -> Cu(OH)2(s)} \]
and
\[ \ce{Cu(OH)2(s) ->[\Delta] CuO(s) + H2O(l)} \]
The symbol \(\Delta\) indicates heating. Each mole of \(\ce{CuO}\) contains one mole of copper, so the measured mass of pure copper oxide can be converted into the mass of copper.
Copper gravimetry
- Precipitate and allow to form
Cu²⁺ + 2OH⁻ → Cu(OH)₂(s)
Incomplete precipitation → low result.
- Filter and wash
Transfer loss → low; contamination → high.
- Heat to form CuO
Cu(OH)₂(s) → CuO(s) + H₂O
Final product must be pure CuO.
- Cool in a desiccator
Limit moisture uptake.
- Weigh to constant mass
Incomplete drying → high result.
- Subtract blank; calculate concentration
Convert net CuO mass to Cu, then divide by original sample volume.
The calculation depends on several conditions being satisfied. The precipitation must recover the copper quantitatively, the final solid must have the assumed composition, and the measured mass must not include unwanted material.
1. Incomplete precipitation
The precipitation reaction must remove the intended copper from the solution.
If some copper remains dissolved in the filtrate, it never reaches the balance. The measured solid mass is too small, so the calculated copper concentration is too low.
Adding excess precipitating reagent can help, but it does not automatically guarantee complete precipitation. Solution conditions, complex-forming substances, and the solubility of the precipitate can affect recovery.
A useful check is to investigate the filtrate for residual copper. If another precipitation recovers additional copper, the first precipitation was incomplete.
2. Contamination and inadequate washing
The solid you weigh must contain the intended product, not a mixture of that product and unwanted material.
The precipitate can retain soluble salts from the solution or reagents. If these remain after filtration and washing, they contribute extra mass.
The balance cannot distinguish copper oxide from leftover salts. It simply measures the total mass placed on it.
Consequently, contamination commonly produces an artificially high result in a precipitation-based gravimetric analysis.
However, not every contaminant produces the same bias. A contaminant might also interfere with precipitation or cause analyte loss. The effect depends on what the contaminant does.
A reagent blank helps identify mass contributed by reagents, filters, and the procedure itself. The blank must undergo the same relevant steps as the sample. Subtracting its mass is appropriate when the background contribution is additive and the blank adequately represents it.
3. Product handling and final mass
The solid must reach the required final chemical form and be weighed under suitable conditions.
Several handling errors can change the result:
- Incomplete drying: retained water or volatile material increases the measured mass.
- Incomplete conversion: if the solid has not reached the assumed final composition, the molar-mass calculation may be invalid.
- Loss during transfer or filtration: some precipitate is left behind, reducing the measured mass.
- Loss during washing: some analyte-containing material dissolves or is dispersed and removed.
- Poor cooling and weighing practice: weighing a hot solid can produce unstable readings.
A standard check is to heat or dry the product, cool it appropriately, and weigh it again. Repeat until successive masses agree within the method’s accepted tolerance. This is called reaching constant mass.
Constant mass is useful evidence that the mass is stable under the chosen procedure. It does not, by itself, prove that the solid is pure or that all the copper was recovered.
The main errors at a glance
| Problem | Likely effect on reported copper concentration |
|---|---|
| Incorrect AAS calibration | Too high or too low |
| AAS matrix suppression | Too low |
| AAS matrix enhancement | Too high |
| Incorrect AAS dilution factor | Too high or too low |
| Incomplete precipitation | Too low |
| Loss of precipitate during handling | Too low |
| Soluble salts left in the solid | Too high |
| Retained water or volatile material | Too high |
| Extra solid contamination | Usually too high |
| Incorrect assumed product composition | Depends on the actual composition |
| Different sample preparation or measured fractions | Results can differ without either method being wrong |
Notice that the errors are not all in the same direction. Some increase the result, while others decrease it. Two errors can even partly cancel, making an incorrect method appear to agree with another result.
04A dependable method for investigating disagreement
When AAS and gravimetry disagree, work through the following checks in order. This is more useful than deciding in advance that one method must be better.
Diagnose conflicting results
- Same copper fraction?
No → match filtration and digestion.
- Check AAS
Audit standards, blank, range, and dilution. Poor spike recovery → investigate matrix effects.
- Check precipitation
Copper in filtrate → incomplete recovery; result too low.
- Check product mass
Mass changes on reheating → unstable product. Contamination or incomplete drying can raise results.
- Check reagent blank
Significant blank → assess and correct additive background.
- Compare corrected results
Use matched samples and uncertainties; investigate remaining differences.
Step 1: Define the measurand
The measurand is the quantity the analysis is intended to determine.
Check whether both methods measure dissolved copper, total recoverable copper, or another clearly defined fraction. Compare filtration, digestion, acidification, and other preparation steps.
If the measurands differ, make the sample preparations comparable before treating the concentration difference as an analytical error.
Step 2: Audit the AAS result
Recheck the standards, blank, calibration range, dilution factor, and calculations. Then investigate matrix effects using a spike-recovery test, standard additions, matrix matching, or a suitable dilution check.
Do not assume that a stable instrument signal means the sample concentration is correct.
Step 3: Audit the gravimetric mass
Check the sample volume, tare and product masses, reagent blank, stoichiometric conversion, and units.
Then investigate whether precipitation was complete, the solid was adequately washed, and the product reached constant mass in the intended chemical form.
If possible, test the filtrate for copper and examine whether another heating cycle changes the mass.
Step 4: Compare independent checks
Look for agreement between checks that investigate different possible errors.
For example, a low AAS spike recovery combined with agreement between standard additions and dilution-corrected results supports a matrix-effect explanation. A gravimetric mass that decreases on reheating points towards a product-handling problem, while copper recovered from the filtrate indicates incomplete precipitation.
Neither observation automatically explains every remaining difference. Check each proposed explanation against the evidence.
Step 5: Decide what the evidence supports
Repeat measurements on suitably matched aliquots. Consider the precision of the balance, the AAS calibration uncertainty, sample heterogeneity, and the limitations of each method.
Averaging two disagreeing values does not correct a systematic error. First establish whether the results are comparable and whether the likely sources of bias have been addressed.
05Worked examples
Worked example: Correct an AAS result for dilution
A copper AAS calibration gives \(A=0.120C\), where \(A\) is absorbance and \(C\) is copper concentration in \(\mathrm{mg\,L^{-1}}\). A \(10.0\ \mathrm{mL}\) portion of water is diluted to \(20.0\ \mathrm{mL}\) and produces an absorbance of \(0.144\). Calculate the copper concentration in the original water.
Step 1
Rearrange the calibration equation:
\[ C=\frac{A}{0.120} \]
Substitute the measured absorbance:
\[ C=\frac{0.144}{0.120} =1.20\ \mathrm{mg\,L^{-1}} \]
This is the concentration in the diluted solution, not the original water.
Step 2
\[ \text{Dilution factor} =\frac{20.0\ \mathrm{mL}}{10.0\ \mathrm{mL}} =2.00 \]
Step 3
\[ C_{\text{original}} =1.20\times2.00 =2.40\ \mathrm{mg\,L^{-1}} \]
The original copper concentration is \(2.40\ \mathrm{mg\,L^{-1}}\).
The tempting mistake is to report \(1.20\ \mathrm{mg\,L^{-1}}\) because that is what the calibration gives. The correction is to remember which solution was actually measured.
Worked example: Convert a precipitate mass into copper concentration
A \(2.00\ \mathrm{L}\) water sample is analysed gravimetrically. The final copper oxide product has a mass of \(7.80\ \mathrm{mg}\). A reagent blank processed through the same procedure leaves \(0.30\ \mathrm{mg}\) of solid. Assume the blank contribution is additive and the corrected product is pure \(\ce{CuO}\).
Calculate the copper concentration. An AAS result on a matched aliquot is \(2.40\ \mathrm{mg\,L^{-1}}\). Compare the results and state whether the difference identifies which method is wrong.
Step 1
\[ m_{\ce{CuO}} =7.80-0.30 =7.50\ \mathrm{mg} \]
The net copper oxide mass is \(7.50\ \mathrm{mg}\).
Step 2
The molar masses are
\[ M_{\ce{Cu}}=63.55\ \mathrm{g\,mol^{-1}} \]
\[ M_{\ce{CuO}}=79.55\ \mathrm{g\,mol^{-1}} \]
Because each mole of \(\ce{CuO}\) contains one mole of copper,
\[ \begin{aligned} m_{\ce{Cu}} &=m_{\ce{CuO}} \frac{M_{\ce{Cu}}}{M_{\ce{CuO}}}\\ &=7.50\ \mathrm{mg} \frac{63.55}{79.55}\\ &=5.99\ \mathrm{mg} \end{aligned} \]
The recovered copper mass is \(5.99\ \mathrm{mg}\).
Step 3
\[ \begin{aligned} C_{\ce{Cu}} &=\frac{m_{\ce{Cu}}}{V_{\text{sample}}}\\ &=\frac{5.99\ \mathrm{mg}}{2.00\ \mathrm{L}}\\ &=3.00\ \mathrm{mg\,L^{-1}} \end{aligned} \]
The blank-corrected gravimetric result is \(3.00\ \mathrm{mg\,L^{-1}}\).
Step 4
The difference is
\[ 3.00-2.40 =0.60\ \mathrm{mg\,L^{-1}} \]
Relative to the AAS result, the difference is
\[ \frac{0.60}{2.40}\times100\% =25.0\% \]
The gravimetric result is 25.0% higher than the AAS result.
That difference does not identify which method is wrong. Blank correction accounts for the measured additive background, but it does not prove complete precipitation, complete product purity, or the absence of matrix effects in AAS. Sample preparation could also mean the methods measure different fractions.
The next step is to investigate those possibilities, not to average the results.
06Questions and solutions
Question 1
A copper AAS calibration is described by
\[ A=0.100C+0.020 \]
where \(A\) is absorbance and \(C\) is the copper concentration in \(\mathrm{mg\,L^{-1}}\). An undiluted sample has an absorbance of \(0.270\).
Calculate its copper concentration. Explain why you cannot simply divide the absorbance by the slope.
Solution 1
The copper concentration is \(2.50\ \mathrm{mg\,L^{-1}}\).
The calibration equation includes an intercept of \(0.020\), so the concentration is found by subtracting that contribution before dividing by the slope.
Rearrange:
\[ C=\frac{A-0.020}{0.100} \]
Substitute:
\[ C=\frac{0.270-0.020}{0.100} =2.50\ \mathrm{mg\,L^{-1}} \]
Dividing \(0.270\) directly by \(0.100\) would give \(2.70\ \mathrm{mg\,L^{-1}}\), which ignores the calibration intercept. The calibration equation, not just its slope, determines the concentration.
Question 2
An external AAS calibration reports \(4.0\ \mathrm{mg\,L^{-1}}\) of copper in a water sample. A separate aliquot is spiked with an additional \(2.0\ \mathrm{mg\,L^{-1}}\) of copper, but the reported concentration of the spiked sample is only \(5.6\ \mathrm{mg\,L^{-1}}\).
Standard additions give an original sample concentration of \(5.0\ \mathrm{mg\,L^{-1}}\), while a fivefold dilution followed by correction for dilution gives \(4.9\ \mathrm{mg\,L^{-1}}\).
Calculate the spike recovery using the external calibration results. Identify the most likely explanation for the disagreement and explain which results provide supporting evidence.
Solution 2
The spike recovery is \(80\%\), and the evidence supports suppression of the AAS signal by the sample matrix.
First, calculate the measured increase in concentration:
\[ \Delta C=5.6-4.0 =1.6\ \mathrm{mg\,L^{-1}} \]
Then calculate recovery:
\[ \begin{aligned} \%\text{ recovery} &=\frac{1.6}{2.0}\times100\%\\ &=80\% \end{aligned} \]
Only 80% of the added copper is reflected in the increase reported by the external calibration.
The standard-addition result of \(5.0\ \mathrm{mg\,L^{-1}}\) and dilution-corrected result of \(4.9\ \mathrm{mg\,L^{-1}}\) agree closely. Both are higher than the external-calibration result of \(4.0\ \mathrm{mg\,L^{-1}}\).
A likely explanation is that the sample matrix reduces the AAS response relative to the external standards. Standard additions account more directly for the sample matrix, while dilution may reduce its influence. The evidence supports matrix suppression, although further validation would be needed to rule out other problems.
The wrong approach would be to average all three concentration estimates. That would combine results obtained under conditions that appear to have different biases.
Question 3
A \(0.750\ \mathrm{L}\) water sample produces \(6.00\ \mathrm{mg}\) of copper oxide after gravimetric analysis. The reagent blank produces \(0.30\ \mathrm{mg}\) of solid. Assume the corrected product is pure \(\ce{CuO}\), and use \(M_{\ce{Cu}}=63.55\ \mathrm{g\,mol^{-1}}\) and \(M_{\ce{CuO}}=79.55\ \mathrm{g\,mol^{-1}}\).
Calculate the blank-corrected copper concentration. Also calculate the concentration that would be reported if the blank were ignored, and explain the direction of the error.
Solution 3
The blank-corrected copper concentration is \(6.07\ \mathrm{mg\,L^{-1}}\). Ignoring the blank would give \(6.39\ \mathrm{mg\,L^{-1}}\), an overestimate.
First, correct the product mass:
\[ m_{\ce{CuO}}=6.00-0.30 =5.70\ \mathrm{mg} \]
Convert this to copper mass:
\[ \begin{aligned} m_{\ce{Cu}} &=5.70\ \mathrm{mg} \frac{63.55}{79.55}\\ &=4.55\ \mathrm{mg} \end{aligned} \]
Calculate the copper concentration:
\[ \begin{aligned} C_{\ce{Cu}} &=\frac{4.55\ \mathrm{mg}}{0.750\ \mathrm{L}}\\ &=6.07\ \mathrm{mg\,L^{-1}} \end{aligned} \]
If the blank were ignored, the full \(6.00\ \mathrm{mg}\) of copper oxide would be treated as sample-derived product:
\[ C_{\ce{Cu}} =\frac{6.00\times(63.55/79.55)} {0.750} =6.39\ \mathrm{mg\,L^{-1}} \]
The blank contributes extra mass that is not attributable to the copper in the sample. Treating that mass as copper oxide from the sample overestimates the copper concentration.
Question 4
A gravimetric analysis initially reports \(9.20\ \mathrm{mg\,L^{-1}}\) of copper. After reheating the product to constant mass, the result falls to \(8.50\ \mathrm{mg\,L^{-1}}\). A second precipitation from the original filtrate then recovers additional pure copper oxide equivalent to \(0.60\ \mathrm{mg\,L^{-1}}\) of copper.
Assume the reheating loss was retained moisture or other volatile material, the second precipitate is pure, and both concentration equivalents refer to the same original sample volume.
Calculate the corrected gravimetric estimate. An external-calibration AAS result is \(8.00\ \mathrm{mg\,L^{-1}}\). What can you conclude about the remaining disagreement?
Solution 4
The corrected gravimetric estimate is \(9.10\ \mathrm{mg\,L^{-1}}\), but the remaining difference does not prove that the AAS result is wrong.
Reheating reduced the first gravimetric result from \(9.20\) to \(8.50\ \mathrm{mg\,L^{-1}}\). Under the stated assumption, the original product contained retained volatile material, which inflated the first result by
\[ 9.20-8.50=0.70\ \mathrm{mg\,L^{-1}} \]
The additional precipitation recovered copper that had remained in the filtrate. This indicates that the first precipitation was incomplete.
Add the copper recovered in the second precipitation to the corrected first-crop result:
\[ C_{\text{grav}} =8.50+0.60 =9.10\ \mathrm{mg\,L^{-1}} \]
The remaining difference from AAS is
\[ 9.10-8.00 =1.10\ \mathrm{mg\,L^{-1}} \]
The two gravimetric errors acted in opposite directions. Retained volatile material made the original result too high, while incomplete precipitation made the first crop too low. Their effects partly cancelled, so the initial result was not a dependable estimate merely because it was close to the corrected value.
The remaining disagreement requires further investigation. The AAS matrix effect has not been tested, and the gravimetric result still depends on the validity of the stated recovery and product-purity assumptions. A repeatable result is not necessarily an accurate one.
Question 5
A bottle of water contains dissolved copper and fine suspended particles that contain additional copper.
An AAS aliquot is filtered through a \(0.45\ \mathrm{\mu m}\) filter before acidification. Its external calibration, standard-addition spike recovery, and dilution checks agree, giving a copper concentration of \(2.40\ \mathrm{mg\,L^{-1}}\).
A separate, unfiltered aliquot is acid-digested before gravimetric analysis. Its reagent blank is negligible, the final product reaches constant mass, and repeat measurements agree at \(3.00\ \mathrm{mg\,L^{-1}}\). When the gravimetric procedure is repeated on a filtered aliquot, it gives \(2.40\ \mathrm{mg\,L^{-1}}\).
Assume that filtration removes the suspended particles without adsorbing dissolved copper, and that acid digestion quantitatively releases copper from the particles.
Are the two original results contradictory? Calculate the particulate copper concentration and its percentage of the total copper concentration. State which result should be reported if the investigation concerns dissolved copper rather than total recoverable copper.
Solution 5
The two results are not contradictory: they measure different fractions of the copper in the original water. The particulate copper concentration is \(0.60\ \mathrm{mg\,L^{-1}}\), representing 20% of the total recoverable copper.
The filtered aliquots contain the dissolved copper fraction, measured as
\[ C_{\text{dissolved}} =2.40\ \mathrm{mg\,L^{-1}} \]
The unfiltered, acid-digested aliquot includes copper released from suspended particles, giving
\[ C_{\text{total recoverable}} =3.00\ \mathrm{mg\,L^{-1}} \]
Subtract the dissolved fraction from the total recoverable concentration:
\[ \begin{aligned} C_{\text{particulate}} &=C_{\text{total recoverable}} -C_{\text{dissolved}}\\ &=3.00-2.40\\ &=0.60\ \mathrm{mg\,L^{-1}} \end{aligned} \]
Calculate the particulate fraction of the total:
\[ \begin{aligned} \%\text{ particulate} &=\frac{0.60}{3.00}\times100\%\\ &=20\% \end{aligned} \]
The dissolved fraction is therefore 80% of the total recoverable copper.
If the investigation concerns dissolved copper, report \(2.40\ \mathrm{mg\,L^{-1}}\). If it concerns total recoverable copper, report \(3.00\ \mathrm{mg\,L^{-1}}\), subject to the stated method assumptions.
The tempting conclusion is that the higher gravimetric result must be an overestimate. But the filtered gravimetric result agrees with AAS, and the unfiltered digest includes an additional copper-containing fraction. The difference comes from what was included in the analysis, not necessarily from an error in either measurement technique.
This is the crucial distinction: agreement between methods is useful evidence, but disagreement does not automatically establish inaccuracy.
07Final self-check: before you report a concentration
Use this checklist whenever analytical results disagree.
- [ ] Same measurand: Do both results refer to the same copper fraction and original sample?
- [ ] AAS validated: Are the calibration, blank, working range, dilution factor, and matrix checks satisfactory?
- [ ] Gravimetry validated: Was precipitation complete? Was the product pure, properly washed, converted to the intended compound, and weighed to constant mass?
- [ ] Mass corrected: Was the reagent blank handled appropriately, and was the correct stoichiometric ratio used?
- [ ] Evidence compared: Do repeat measurements and independent checks support the proposed explanation?
- [ ] Conclusion justified: Have you investigated the disagreement instead of automatically trusting one method or averaging the results?
The next useful concept is measurement uncertainty. Once the measurand is consistent and the main sources of bias have been investigated, uncertainty helps you judge whether two remaining results are meaningfully different and how confidently you can report the concentration.