
Acid-Base Indicators and Reversible Colour Change
Learn how acid-base indicators change colour through reversible equilibrium shifts, why different indicators change over different pH ranges, and how to interpret their colours correctly.
Add a few drops of red cabbage indicator to an acidic solution and it turns pink-red. Add enough base and it can move through purple, blue, and green. Now add acid again. What do you predict: does the original colour return, or has the indicator been permanently changed?
The colour can return. That is the important clue. An acid-base indicator is not usually being destroyed and rebuilt each time the pH changes. Its molecules are shifting reversibly between different chemical forms, and those forms absorb visible light differently.
That simple observation gives us a way to detect acid-base conditions without measuring pH directly.
01The colour change is an equilibrium shift
First, refresh the acid-base idea underneath this.
In water, an acid can increase the concentration of hydronium ions, \(\ce{H3O+}\). A base can remove \(\mathrm{H}^{+}\), often causing the \(\ce{H3O+}\) concentration to fall.
Many indicators can themselves behave as weak acids. We can represent one as \(\ce{HIn}\), where \(\mathrm{In}^{-}\) is its deprotonated form:
\[
\ce{HIn(aq) + H2O(l) <=> H3O+(aq) + In^-(aq)}
\]
Suppose \(\ce{HIn}\) is yellow and \(\mathrm{In}^{-}\) is blue.
The two forms are the same indicator molecule in different protonation states. A slightly silly way to picture it is as the same person changing outfits depending on whether they are currently holding an \(\mathrm{H}^{+}\). The analogy is useful because the identity is mostly retained while the form changes. It breaks down because adding or removing a proton actually changes the molecule’s electron distribution, not just its appearance.
Now predict what happens if acid is added.
Adding acid increases the concentration of \(\ce{H3O+}\). According to Le Chatelier’s principle, the equilibrium responds by shifting to the left:
\[
\ce{HIn(aq) + H2O(l) <- H3O+(aq) + In^-(aq)}
\]
More \(\ce{HIn}\) is present, so the acid-form colour becomes dominant.
Adding base has the opposite effect. Hydroxide ions react with hydronium ions:
\[
\ce{H3O+(aq) + OH^-(aq) -> 2H2O(l)}
\]
Removing \(\ce{H3O+}\) shifts the indicator equilibrium to the right. More \(\mathrm{In}^{-}\) forms, so the base-form colour becomes dominant.
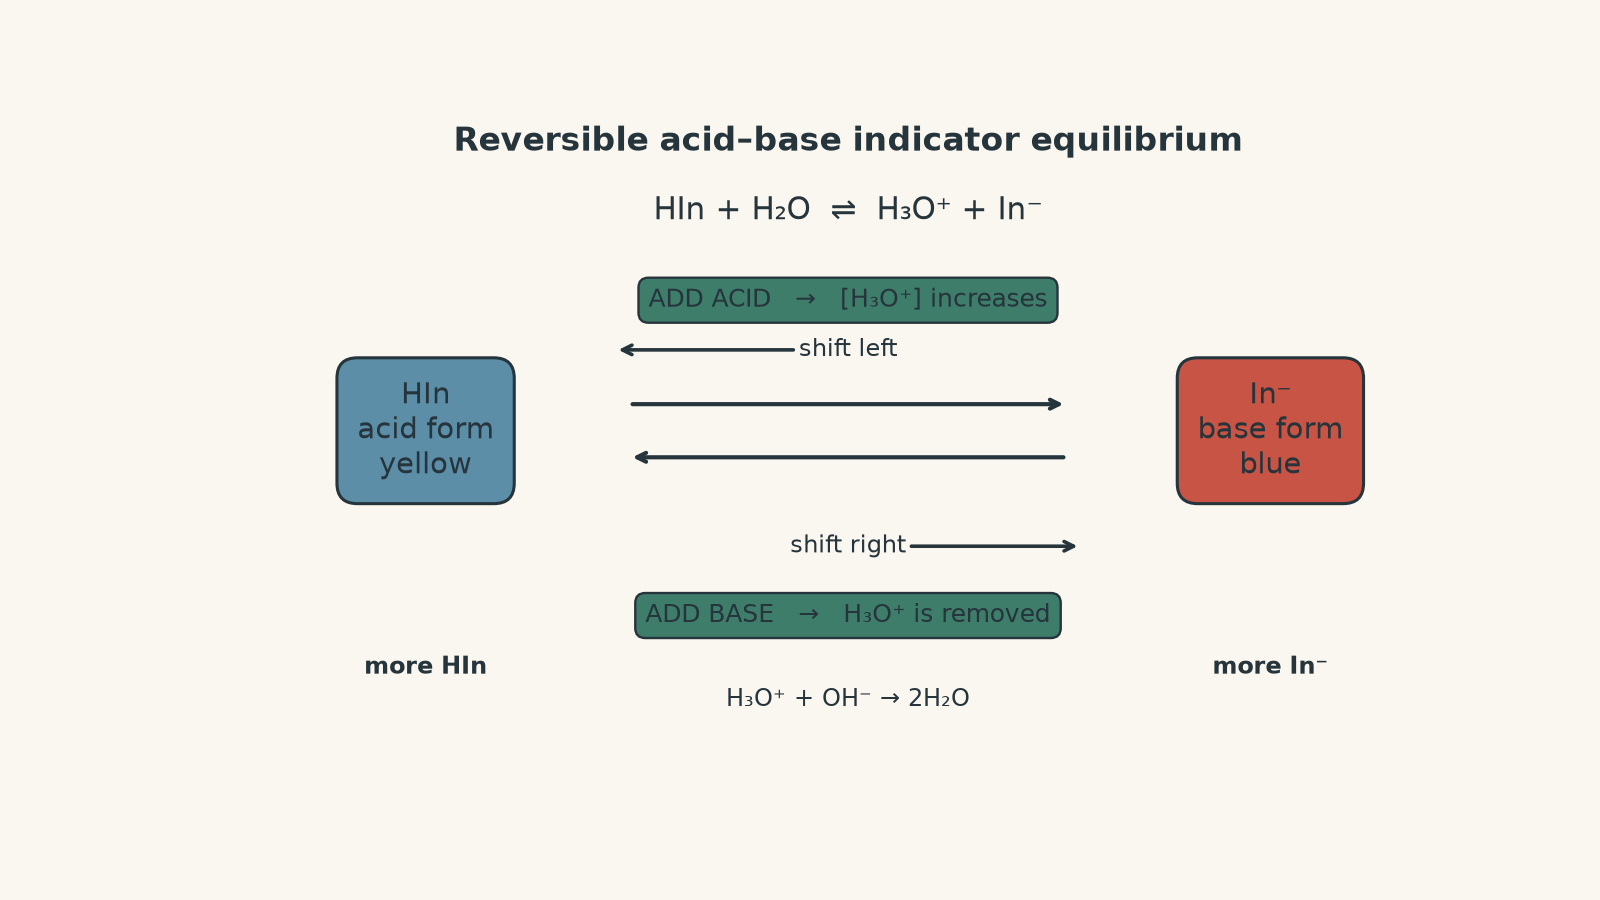
This is why the colour change can be reversed. Add acid, shift one way. Add base, shift the other way.
02Why does adding one proton change the colour?
Saying “the equilibrium shifts” explains why the proportions change, but not why the forms have different colours.
Visible colour depends on how a molecule interacts with visible light. The electrons in an indicator molecule can occupy different energy states. When the molecule absorbs certain wavelengths of visible light, the wavelengths that remain are what reach your eyes.
Protonating or deprotonating an indicator changes the arrangement of electrons across the molecule. That can change the energies of the electronic transitions available to it, so different wavelengths are absorbed.
The result is a different observed colour.
You do not need to imagine the proton itself as being coloured. It changes the electronic structure of the whole indicator species.
This also explains why different indicators have different colours and change over different pH ranges. Their molecular structures are different, so their acid-base equilibria and light absorption are different.
03Preparing and using a natural indicator
Red cabbage is useful because it contains anthocyanin pigments that respond strongly to pH.
A simple school preparation is:
- Chop or tear red cabbage leaves into small pieces.
- Add warm distilled water and crush or stir the leaves to extract the pigments.
- Allow the mixture to stand briefly.
- Filter off the solid cabbage.
- Add a small, consistent amount of the filtered extract to separate samples of acidic, approximately neutral, and basic solutions.
- Record the observed colours.
Use clean droppers for each solution. Otherwise, a dropper carrying acid into your base sample can change the result before the indicator even gets involved.
Wear appropriate eye protection and use acids and bases at concentrations approved for the practical. Indicator solutions are for testing, not tasting.
A useful experimental improvement is to include known reference solutions. An unknown colour means much more when you can compare it with colours produced under known acidic and basic conditions.
Testing reversibility
You can also use the same sample to test reversibility.
Start with cabbage indicator in an acidic solution. Add base gradually until the colour changes. Then add acid gradually.
If the indicator has not undergone a damaging side reaction, the colour should move back towards its acidic form.
There is one subtle point here. The final colour may not have exactly the same intensity as the first one because you have added extra liquid and diluted the indicator. Reversibility refers to the chemical forms being able to interconvert, not to the beaker somehow returning to its exact original composition.
Red cabbage is also more complicated than the simple two-form equation above. Its extract contains several related pigments, and anthocyanins can undergo several pH-dependent structural changes. That is why cabbage indicator can show several distinct colours rather than just one acid colour and one base colour.
The \(\ce{HIn/In^-}\) model is still extremely useful. It is a first model for understanding indicator equilibrium. It is not a claim that every natural indicator contains exactly two coloured species.
04An indicator changes colour over a range, not at one exact pH
A common first picture is that an indicator suddenly flips colour at one pH value.
Real indicators do not behave like a light switch.
Around the transition, both forms are present. Your eye sees the combined result.
For a weak-acid indicator,
\[
\ce{HIn(aq) + H2O(l) <=> H3O+(aq) + In^-(aq)}
\]
its acid dissociation constant is
\[
K_a = \frac{[\ce{H3O+}][\mathrm{In}^{-}]}{[\ce{HIn}]}
\]
where:
- \(K_a\) is the acid dissociation constant of the indicator
- \([\ce{H3O+}]\) is the hydronium ion concentration in \(\mathrm{mol\,L^{-1}}\)
- \([\mathrm{In}^{-}]\) is the concentration of the deprotonated indicator form
- \([\ce{HIn}]\) is the concentration of the protonated indicator form.
Rearranging gives
\[
\frac{[\mathrm{In}^{-}]}{[\ce{HIn}]} = \frac{K_a}{[\ce{H3O+}]}
\]
We can also use
\[
\mathrm{p}K_a = -\log K_a
\]
and
\[
\mathrm{pH} = -\log[\ce{H3O+}]
\]
to obtain
\[
\mathrm{pH} = \mathrm{p}K_a + \log\left(\frac{[\mathrm{In}^{-}]}{[\ce{HIn}]}\right)
\]
The equation has a useful physical meaning.
When \(\mathrm{pH} = \mathrm{p}K_a\),
\[
[\mathrm{In}^{-}] = [\ce{HIn}]
\]
so the two indicator forms are present in equal concentrations.
If the pH is one unit below the \(\mathrm{p}K_a\),
\[
\frac{[\mathrm{In}^{-}]}{[\ce{HIn}]} = 0.10
\]
so the acid form is about ten times as abundant.
If the pH is one unit above the \(\mathrm{p}K_a\),
\[
\frac{[\mathrm{In}^{-}]}{[\ce{HIn}]} = 10
\]
so the base form is about ten times as abundant.
That is why a typical visible transition occurs over roughly
\[
\mathrm{p}K_a \pm 1
\]
This is an approximation, not a law saying every human eye detects colour at exactly a 10:1 ratio.
Common indicators therefore change across different ranges.
| Indicator | Approximate transition range | Acid-side colour | Base-side colour |
|---|---|---|---|
| Methyl orange | pH 3.1-4.4 | red | yellow |
| Bromothymol blue | pH 6.0-7.6 | yellow | blue |
| Phenolphthalein | pH 8.2-10.0 | colourless | pink |
The practical consequence is important: an indicator tells you about a pH region. It does not normally provide an exact pH measurement.
Worked example: What colour should the indicator show?
An indicator has \(\mathrm{p}K_a = 6.80\). Its \(\ce{HIn}\) form is yellow and its \(\mathrm{In}^{-}\) form is blue. Estimate the ratio of the two forms at pH 7.40 and predict the observed colour.
Step 1
\[
\mathrm{pH} = \mathrm{p}K_a + \log\left(\frac{[\mathrm{In}^{-}]}{[\ce{HIn}]}\right)
\]
Step 2
\[
7.40 = 6.80 + \log\left(\frac{[\mathrm{In}^{-}]}{[\ce{HIn}]}\right)
\]
Therefore,
\[
\log\left(\frac{[\mathrm{In}^{-}]}{[\ce{HIn}]}\right)=0.60
\]
and
\[
\frac{[\mathrm{In}^{-}]}{[\ce{HIn}]}=10^{0.60}\approx4.0
\]
Step 3
There are about four times as many blue \(\mathrm{In}^{-}\) species as yellow \(\ce{HIn}\) species.
The solution should therefore appear predominantly blue, although some yellow form remains. Depending on the indicator’s actual colours and concentrations, the observed shade could be blue-green rather than a perfectly pure blue.
The important result is not the exact shade. At pH 7.40, the base form dominates because the pH is above the indicator’s \(\mathrm{p}K_a\).
05Why a tiny addition can produce a dramatic colour change
Near neutralisation in some acid-base mixtures, a small extra volume of titrant can cause a large pH change.
The indicator itself is not amplifying the reaction. It is responding to that rapidly changing pH.
Worked example: Reversing an indicator with acid and base
A student mixes \(25.0\ \mathrm{mL}\) of \(0.0100\ \mathrm{mol\,L^{-1}}\) hydrochloric acid with \(24.0\ \mathrm{mL}\) of \(0.0100\ \mathrm{mol\,L^{-1}}\) sodium hydroxide. A yellow-to-blue indicator with a transition near pH 7 is present.
Calculate the pH after mixing and predict the dominant indicator colour. The student then adds another \(2.00\ \mathrm{mL}\) of \(0.0100\ \mathrm{mol\,L^{-1}}\) sodium hydroxide. Calculate the new pH and explain the new colour.
Assume complete neutralisation and additive volumes.
Step 1
Hydrochloric acid supplies \(\ce{H3O+}\):
\[
n(\ce{H3O+})=CV
=(0.0100)(0.0250)
=2.50\times10^{-4}\ \mathrm{mol}
\]
Sodium hydroxide supplies \(\ce{OH^-}\):
\[
n(\ce{OH^-})=CV
=(0.0100)(0.0240)
=2.40\times10^{-4}\ \mathrm{mol}
\]
Step 2
The neutralisation is
\[
\ce{H3O+(aq) + OH^-(aq) -> 2H2O(l)}
\]
so the excess hydronium amount is
\[
2.50\times10^{-4}-2.40\times10^{-4}
=1.00\times10^{-5}\ \mathrm{mol}
\]
The total volume is
\[
25.0+24.0=49.0\ \mathrm{mL}
=0.0490\ \mathrm{L}
\]
Therefore,
\[
[\ce{H3O+}]
=
\frac{1.00\times10^{-5}}{0.0490}
=
2.04\times10^{-4}\ \mathrm{mol\,L^{-1}}
\]
and
\[
\mathrm{pH}
=
-\log(2.04\times10^{-4})
=
3.69
\]
At pH 3.69, the acid-side yellow form strongly dominates for an indicator changing near pH 7.
Step 3
The additional amount of \(\ce{OH^-}\) is
\[
n(\ce{OH^-})
=
(0.0100)(0.00200)
=
2.00\times10^{-5}\ \mathrm{mol}
\]
There had been \(1.00\times10^{-5}\ \mathrm{mol}\) of excess \(\ce{H3O+}\), so after neutralisation there is
\[
2.00\times10^{-5}-1.00\times10^{-5}
=
1.00\times10^{-5}\ \mathrm{mol}
\]
of excess \(\ce{OH^-}\).
The new total volume is
\[
51.0\ \mathrm{mL}
=
0.0510\ \mathrm{L}
\]
so
\[
[\ce{OH^-}]
=
\frac{1.00\times10^{-5}}{0.0510}
=
1.96\times10^{-4}\ \mathrm{mol\,L^{-1}}
\]
Then
\[
\mathrm{pOH}
=
-\log(1.96\times10^{-4})
=
3.71
\]
and, at \(25^\circ\mathrm{C}\),
\[
\mathrm{pH}=14.00-3.71=10.29
\]
The solution is now well on the basic side of the indicator’s transition range, so the blue form dominates.
The indicator has therefore moved from mainly yellow to mainly blue because the acid-base reaction drove the pH from 3.69 to 10.29. Adding sufficient acid again would drive the indicator equilibrium back towards its yellow form.
06What an indicator can and cannot tell you
Several tempting interpretations cause problems in HSC questions.
A stronger-looking colour does not necessarily mean a stronger acid
Colour intensity depends on several things, including how much indicator is present and how much light passes through the solution.
Even the actual colour primarily reflects pH, not “acid strength” by itself.
Acid strength describes the extent to which an acid ionises. Concentration describes how much acid is present per unit volume. A concentrated weak acid can have a lower pH than a sufficiently dilute strong acid.
So “this sample is redder, therefore its acid must be stronger” is not a safe conclusion.
An indicator does not usually give one exact pH
If methyl orange is yellow, you can infer that the pH is above its main transition range. You cannot infer an exact value such as pH 6.2 from that colour alone.
A pH meter provides a numerical measurement. An indicator provides chemical evidence over a range.
Universal indicator is not one magical rainbow molecule
Universal indicator is a mixture of indicators selected so that different components change colour across different pH ranges.
Its wide colour scale comes from that mixture.
This is different from modelling one indicator as a simple \(\ce{HIn/In^-}\) equilibrium.
Neutral does not mean “where every indicator changes”
Different indicators have different \(K_a\) values, so their transition ranges occur at different pH values.
Phenolphthalein, for example, changes in the basic region. Its colour change is not evidence that the solution has just reached pH 7.
That becomes especially important when choosing an indicator for an acid-base titration.
An indicator is only approximately a spectator
In ordinary practical work, only a few drops of dilute indicator are used. Its amount is deliberately small enough that it does not significantly change the pH being measured.
But the indicator is itself an acid or base.
If you add a large amount, especially to a small or very dilute sample, it can alter the system it is supposed to be observing.
That point matters in the final question below.
07Questions and solutions
Question 1
An indicator exists as red \(\ce{HIn}\) and yellow \(\mathrm{In}^{-}\):
\[
\ce{HIn(aq) + H2O(l) <=> H3O+(aq) + In^-(aq)}
\]
The indicator is initially red in an acidic solution. Sodium hydroxide is added until the solution becomes yellow.
Explain the colour change and predict what happens if sufficient acid is then added.
Solution 1
The indicator becomes yellow because adding sodium hydroxide lowers the hydronium ion concentration, shifting the indicator equilibrium towards yellow \(\mathrm{In}^{-}\). Adding sufficient acid shifts the equilibrium back towards red \(\ce{HIn}\), so the red colour can return.
The added hydroxide reacts with hydronium ions:
\[
\ce{H3O+(aq) + OH^-(aq) -> 2H2O(l)}
\]
Removing \(\ce{H3O+}\) causes
\[
\ce{HIn(aq) + H2O(l) <=> H3O+(aq) + In^-(aq)}
\]
to shift to the right according to Le Chatelier’s principle.
Adding acid later increases \([\ce{H3O+}]\), shifting the equilibrium left again.
A tempting explanation is that sodium hydroxide simply “turns the dye yellow”. That misses the important mechanism. The colour follows the changing proportions of two equilibrium forms of the indicator.
Question 2
An indicator has
\[
K_a=2.5\times10^{-5}
\]
Its \(\ce{HIn}\) form is orange and its \(\mathrm{In}^{-}\) form is purple.
Calculate the ratio
\[
\frac{[\mathrm{In}^{-}]}{[\ce{HIn}]}
\]
at:
a. pH 4.20
b. pH 5.20
For each solution, state which indicator form dominates.
Solution 2
At pH 4.20 the ratio is approximately \(0.40:1\), so orange \(\ce{HIn}\) dominates. At pH 5.20 the ratio is approximately \(4.0:1\), so purple \(\mathrm{In}^{-}\) dominates.
From
\[
K_a=\frac{[\ce{H3O+}][\mathrm{In}^{-}]}{[\ce{HIn}]}
\]
we obtain
\[
\frac{[\mathrm{In}^{-}]}{[\ce{HIn}]}
=
\frac{K_a}{[\ce{H3O+}]}
\]
For part a,
\[
[\ce{H3O+}]
=
10^{-4.20}
=
6.31\times10^{-5}\ \mathrm{mol\,L^{-1}}
\]
Therefore,
\[
\frac{[\mathrm{In}^{-}]}{[\ce{HIn}]}
=
\frac{2.5\times10^{-5}}
{6.31\times10^{-5}}
=
0.396
\]
So there is roughly \(0.40\) mole of purple form for every \(1\) mole of orange form.
For part b,
\[
[\ce{H3O+}]
=
10^{-5.20}
=
6.31\times10^{-6}\ \mathrm{mol\,L^{-1}}
\]
so
\[
\frac{[\mathrm{In}^{-}]}{[\ce{HIn}]}
=
\frac{2.5\times10^{-5}}
{6.31\times10^{-6}}
=
3.96
\]
There are now roughly \(4.0\) moles of purple form for every \(1\) mole of orange form.
The important change is not that pH 5.20 is “basic” – it is not. The solution is still acidic relative to pH 7. What matters is that pH 5.20 is high enough relative to this indicator’s \(\mathrm{p}K_a\) for its deprotonated form to dominate.
That is a common trap: indicator colour depends on the indicator’s own equilibrium, not simply on whether the solution is above or below pH 7.
Question 3
A student titrates a weak monoprotic acid with sodium hydroxide. The calculated pH at the equivalence point is 8.72.
Three indicators are available:
| Indicator | Transition range |
|---|---|
| A | pH 3.1-4.4 |
| B | pH 6.0-7.6 |
| C | pH 8.2-10.0 |
Which indicator is the most appropriate of the three for detecting the equivalence region? Explain why choosing the indicator whose range is closest to pH 7 would be poor reasoning.
Solution 3
Indicator C is the appropriate choice because its transition range, pH 8.2-10.0, includes the equivalence-point pH of 8.72.
The purpose of a titration indicator is to change colour during the steep pH change near the equivalence point. There is no general rule that an indicator should change near pH 7.
For this weak-acid-strong-base titration, the equivalence solution is basic. The conjugate base formed from the weak acid reacts with water and produces \(\ce{OH^-}\), so the equivalence-point pH is above 7.
Indicator B might look tempting because its range surrounds neutral pH. That choice quietly assumes every acid-base equivalence point is neutral. The given equivalence pH, 8.72, shows that assumption is wrong here.
Indicator A changes much too early, while substantial acid would still remain.
The broader decision rule is to match the indicator’s transition range to the rapid pH change around equivalence, not to the number 7.
Question 4
Red cabbage extract gives approximately the following observations in one experiment:
| pH | Observed colour |
|---|---|
| 2 | red |
| 6 | purple |
| 8 | blue |
| 10 | green |
| 12 | yellow |
When a sample is changed from pH 2 to pH 12 and then carefully returned to pH 2, the red colour returns.
A student argues:
“The cabbage pigment must follow one simple equilibrium, \(\ce{HIn <=> H+ + In^-}\). Every colour between red and yellow is just a different mixture of those two forms.”
Evaluate this model using the observations. Explain what the reversible colour change does establish and what it does not establish.
Solution 4
The observations support reversible pH-dependent chemical changes, but they do not support the claim that one two-species \(\ce{HIn/In^-}\) equilibrium is sufficient to describe red cabbage indicator.
The return of the red colour after the pH is restored strongly supports the idea that the major colour changes are reversible rather than simply being caused by irreversible destruction of the pigment.
However, the simple model contains only two coloured chemical forms. Changing their ratio can explain a gradual transition between two endpoint colours, but cabbage extract displays several qualitatively different colours – red, purple, blue, green, and yellow – across a broad pH range.
Red cabbage contains anthocyanin pigments capable of several protonation and structural changes. A more realistic model therefore involves multiple pH-dependent species and equilibria.
The tempting route is to treat the familiar equation
\[
\ce{HIn <=> H+ + In^-}
\]
as a literal description of every indicator. It is better understood as a powerful simplified model for a two-form indicator.
The reversibility evidence also does not, by itself, identify every molecular structure involved. An observation such as “the colour returned” tells us that reversible processes are occurring under the experimental conditions. Determining the exact species would require additional chemical evidence.
This is an important scientific distinction: a useful model can explain an observation without being a complete molecular description of the system.
Question 5
A weak-acid indicator has \(\mathrm{p}K_a=8.00\). Its \(\ce{HIn}\) form is yellow and its \(\mathrm{In}^{-}\) form is blue.
A student has \(10.0\ \mathrm{mL}\) of \(1.00\times10^{-4}\ \mathrm{mol\,L^{-1}}\) sodium hydroxide. Before adding indicator, the student correctly calculates that the solution is basic.
Instead of using one small drop of dilute indicator, the student adds \(1.00\ \mathrm{mL}\) of a concentrated \(5.00\times10^{-3}\ \mathrm{mol\,L^{-1}}\) solution of \(\ce{HIn}\).
Assume:
- \(\ce{HIn}\) reacts essentially completely with \(\ce{OH^-}\) according to
\[
\ce{HIn(aq) + OH^-(aq) -> In^-(aq) + H2O(l)}
\]
- after this reaction, the remaining \(\ce{HIn}\) and produced \(\mathrm{In}^{-}\) establish their acid-base equilibrium
- volumes are additive.
Calculate the approximate final pH and predict the dominant indicator colour. Then explain why the result does not contradict the idea that indicators reveal the pH of a solution.
Solution 5
The final pH is approximately \(7.40\), and the yellow \(\ce{HIn}\) form dominates. The surprising result occurs because so much acidic indicator was added that the indicator substantially changed the solution it was supposed to test.
First calculate the initial amount of hydroxide:
\[
n(\ce{OH^-})
=
CV
=
(1.00\times10^{-4})(0.0100)
=
1.00\times10^{-6}\ \mathrm{mol}
\]
Now calculate the amount of \(\ce{HIn}\) added:
\[
n(\ce{HIn})
=
(5.00\times10^{-3})(0.00100)
=
5.00\times10^{-6}\ \mathrm{mol}
\]
The reaction is one-to-one:
\[
\ce{HIn + OH^- -> In^- + H2O}
\]
All \(1.00\times10^{-6}\ \mathrm{mol}\) of hydroxide therefore reacts.
It consumes the same amount of \(\ce{HIn}\), leaving
\[
n(\ce{HIn})
=
5.00\times10^{-6}
–
1.00\times10^{-6}
=
4.00\times10^{-6}\ \mathrm{mol}
\]
and producing
\[
n(\mathrm{In}^{-})
=
1.00\times10^{-6}\ \mathrm{mol}
\]
Because both forms occupy the same final volume, their concentration ratio is equal to their mole ratio:
\[
\frac{[\mathrm{In}^{-}]}{[\ce{HIn}]}
=
\frac{1.00\times10^{-6}}
{4.00\times10^{-6}}
=
0.250
\]
Use
\[
\mathrm{pH}
=
\mathrm{p}K_a+
\log\left(
\frac{[\mathrm{In}^{-}]}{[\ce{HIn}]}
\right)
\]
to obtain
\[
\mathrm{pH}
=
8.00+\log(0.250)
\]
Since
\[
\log(0.250)=-0.602
\]
the final pH is
\[
\mathrm{pH}\approx7.40
\]
The ratio
\[
\frac{[\mathrm{In}^{-}]}{[\ce{HIn}]}=0.250
\]
also means there are about four times as many yellow \(\ce{HIn}\) molecules as blue \(\mathrm{In}^{-}\) molecules. The colour should therefore be dominated by the yellow form, perhaps with some contribution from the blue form depending on the indicator’s visual properties.
The tempting prediction is blue because the original sample was sodium hydroxide. Before the indicator was added,
\[
[\ce{OH^-}]=1.00\times10^{-4}\ \mathrm{mol\,L^{-1}}
\]
so
\[
\mathrm{pOH}=4.00
\]
and, at \(25^\circ\mathrm{C}\),
\[
\mathrm{pH}=10.00
\]
But that was the pH of the original sodium hydroxide solution. Adding the concentrated weak-acid indicator is itself a chemical change. There was five times as much \(\ce{HIn}\) as \(\ce{OH^-}\) in mole terms, so the indicator could not be treated as a harmless spectator.
There is no contradiction. An indicator reveals the pH of the solution that actually exists after the indicator has been added. Good experimental technique uses only a small amount of indicator so that this act of measuring has a negligible effect on the system.
That idea leads directly to indicator choice in titrations. The best indicator is not simply the one with familiar colours or a transition close to pH 7. Its transition range must suit the rapid pH change around the equivalence point, and the amount added must be small enough that the indicator observes the acid-base system rather than noticeably becoming part of it.