
HSC Chemistry: Understanding Results Below the Detection Limit
Learn how to distinguish between absent, undetected, and detected but unquantifiable pollutants in HSC Chemistry. Use detection limits, calibration curves, worked examples, and reporting rules to interpret analytical results accurately.
Imagine testing creek water for dissolved copper. The instrument gives an absorbance reading of 0.029, while a reagent blank reads around 0.020. Is the copper absent, present at a low concentration, or simply indistinguishable from background noise?
The reading alone cannot settle that question. Before calculating anything, predict what you would report: a concentration, “not detected”, or “detected but not reliably quantifiable”?
The answer depends on three things: the detection limit, the quantification limit, and the calibration range. Understanding the difference is essential when analysing pollutants, because a number from an instrument is not automatically a reliable measurement.
01The decision rule: what can you actually report?
Start by identifying which category your result belongs to.
| Measurement result | Defensible conclusion | What you must not claim |
|---|---|---|
| Signal does not meet the detection criterion | The substance was not detected by this method. | The substance is definitely absent. |
| Signal meets the detection criterion but is below the quantification limit | The substance was detected, but its concentration cannot be measured reliably. | The calculated concentration is accurate. |
| Concentration lies within the validated quantitative calibration range | Report the concentration calculated from the calibration relationship. | More precision than the method supports. |
| Result exceeds the upper calibration limit | Dilute the sample and measure it again, if appropriate. | An extrapolated concentration is automatically valid. |
The key is to make three checks in order:
- Can the instrument distinguish the sample signal from background noise?
- If so, is the signal strong enough to determine a reliable concentration?
- Is the concentration within the range for which the method has been validated?
How to report a pollutant measurement
- Measure sample and blank
Establish the sample signal and background variation.
- Check the detection limit
Below detection criterion: report not detected, not zero.
- Check the quantification limit
Detected below LOQ: report detected, not reliably quantified.
- Check the calibration range
Within validated range: quantify; above upper limit: dilute and remeasure.
- Select the report
State the result, units, and limits without overstating certainty.
01Absent, not detected, and detected below the quantification limit
These three descriptions mean different things. Confusing them can lead to conclusions that the experimental evidence does not support.
Absent
If a substance is absent, it is not present in the sample.
However, an ordinary analytical test cannot establish absolute absence simply because the instrument gives a reading close to zero. The substance might be present at a concentration too low for the method to detect. The portion of water tested might also fail to represent the entire creek.
Not detected
A substance is not detected when the measured response does not meet the method’s criterion for distinguishing the analyte from background noise.
The analyte may still be present. Its concentration may be below the method’s detection limit.
For example, if a validated method has a detection limit of 0.06 mg/L for dissolved copper, a result reported as not detected does not establish that the copper concentration is exactly 0 mg/L.
It establishes that copper was not detected under the conditions of that method.
Detected, but below the quantification limit
This is a different situation. The signal is distinguishable from background, but it is too weak for the method to determine the concentration with acceptable reliability.
You have evidence that the substance is present, but you cannot confidently assign it a precise concentration.
Three different analytical conclusions
| Absent | Supported: The substance is not present. Beyond evidence: A near-zero reading alone proves absence. |
|---|---|
| Not detected | Supported: Signal did not meet the detection criterion. Beyond evidence: The concentration is exactly zero. |
| Detected below LOQ | Supported: Signal is distinguishable; concentration is unreliable. Beyond evidence: The calculated concentration is accurate. |
A useful distinction to remember is:
- Detection concerns whether the signal can be distinguished from background.
- Quantification concerns whether the amount can be measured reliably.
A result can satisfy the first condition without satisfying the second.
02Background signals and blank measurements
An instrument does not necessarily give a reading of zero when no analyte is present.
Suppose you are measuring dissolved copper using an illustrative colourimetric method. Copper reacts with a suitable reagent to produce a coloured complex, and the instrument measures its absorbance. Under controlled conditions, higher copper concentrations produce higher absorbance readings.
But the reagent, the container, the instrument, and other substances in the water can also contribute to the measured signal.
The instrument therefore measures a response that contains both the contribution from the analyte and background effects.
What is a blank?
A blank is prepared and measured to estimate the background response. A reagent blank, for example, contains the reagents and undergoes the same preparation steps as the sample, but it does not contain the analyte being measured.
Imagine trying to hear someone whisper in a noisy room. A faint sound might come from the person speaking, the background noise, or both.
The blank helps establish the noise level against which the sample is judged. Unlike human hearing, however, an analytical method should use defined measurement criteria and validation rather than an individual’s judgement.
For the following illustrative copper analysis, five blank measurements give these absorbance readings:
| Blank measurement | Absorbance, \(A\) |
|---|---|
| 1 | 0.020 |
| 2 | 0.022 |
| 3 | 0.019 |
| 4 | 0.021 |
| 5 | 0.018 |
The mean blank signal is
\[
\bar A_{\text{blank}}=0.020
\]
The sample standard deviation is approximately
\[
s=0.00158
\]
The standard deviation, \(s\), describes how much the readings vary around their mean. A larger standard deviation means more background variation, making weak analyte signals harder to distinguish.
Notice that the mean blank reading is 0.020, not zero. This matters when converting an instrument signal into a concentration.
A further limitation is that a reagent blank does not necessarily account for everything in creek water. Naturally coloured dissolved substances or other components of the sample can affect absorbance. These matrix effects must be controlled or accounted for before the calibration can be trusted.
03Understand the calibration curve before calculating a concentration
The instrument measures a signal, not a concentration directly. To convert one into the other, you need a calibration relationship.
A calibration curve is constructed by measuring standards containing known analyte concentrations and relating those concentrations to their instrument responses.
For this illustrative method, assume the relationship is linear over the validated range:
\[
A=0.020+0.080C
\]
where:
- \(A\) is the measured absorbance, expressed here in absorbance units (AU).
- \(C\) is the dissolved copper concentration in mg/L.
- \(0.020\) is the intercept, representing the baseline response in this simplified model.
- \(0.080\) is the calibration slope, in AU per mg/L.
The slope tells you how much the absorbance changes for each additional 1 mg/L of copper.
Rearranging the equation gives the apparent concentration corresponding to a measured signal:
\[
C=\frac{A-0.020}{0.080}
\]
You subtract the baseline before dividing by the slope. Dividing the raw absorbance by the slope would incorrectly treat the background signal as if it all came from copper.
What is the calibration range?
For this example, the validated quantitative calibration range is 0.20-2.00 mg/L.
Within this range, the method has been validated to provide reliable quantitative results under the stated conditions.
The corresponding absorbance readings predicted by the calibration equation are:
- At 0.20 mg/L: \(A=0.036\)
- At 2.00 mg/L: \(A=0.180\)
A straight line can produce a mathematical concentration outside these limits. That does not mean the concentration is valid.
Below the lower limit, the response may be too weak for reliable quantification. Above the upper limit, the instrument response may no longer follow the validated relationship.
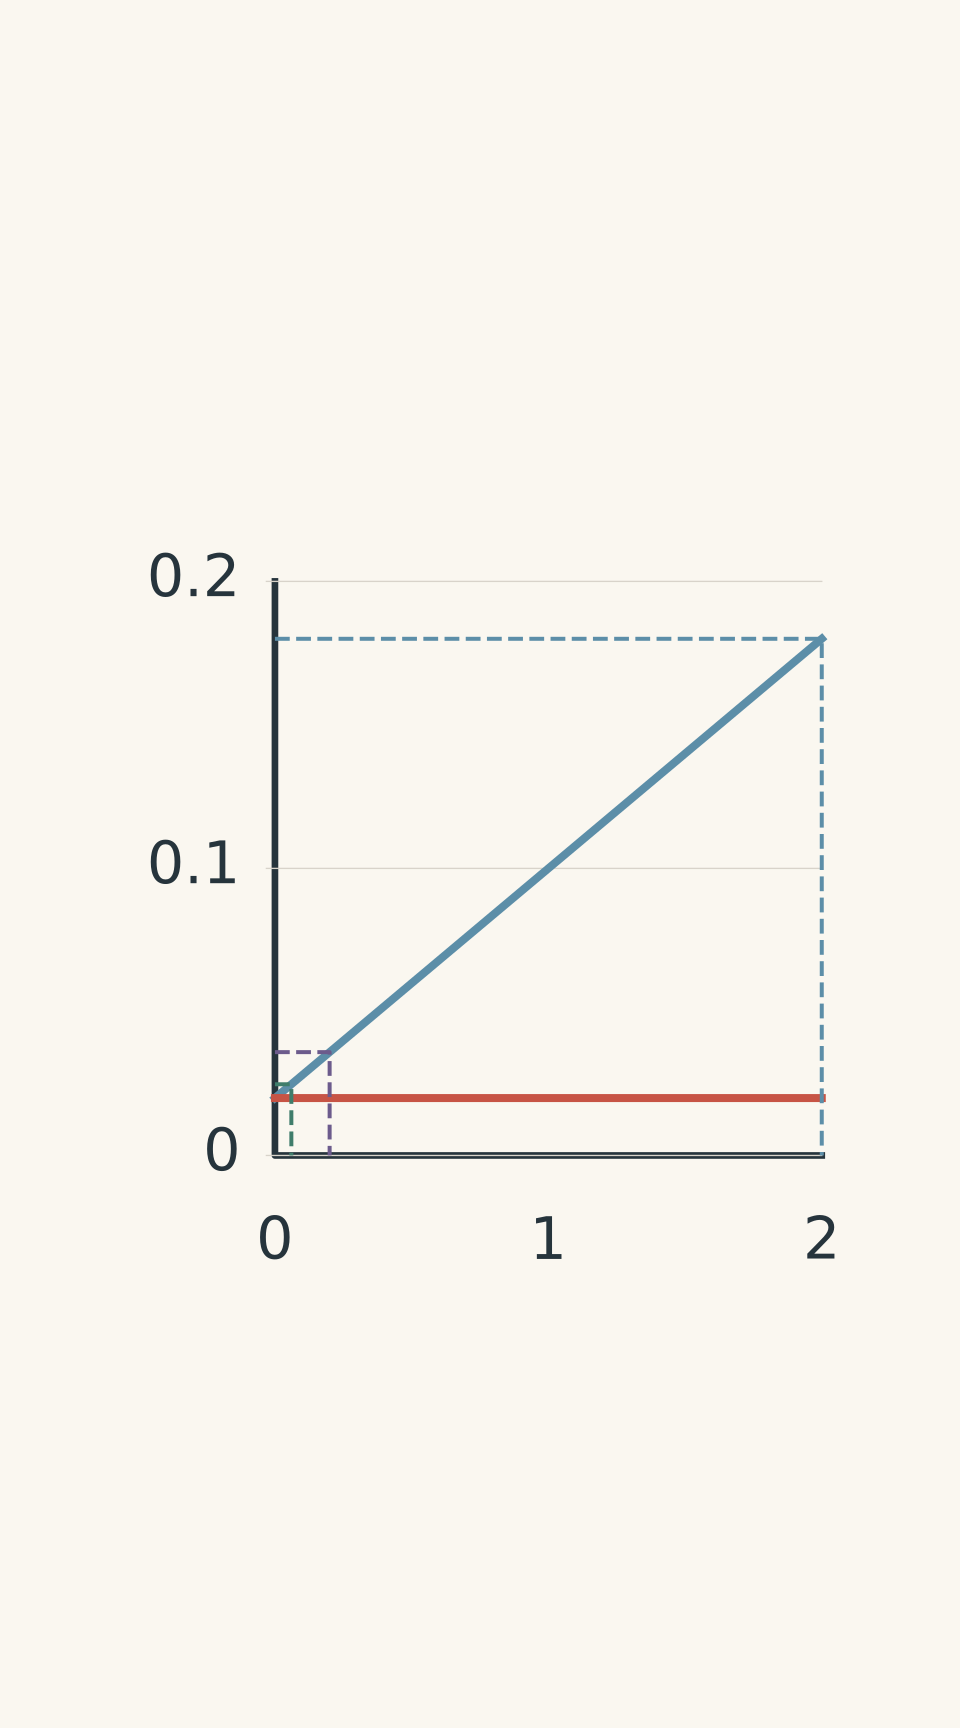
- Calibration: A = 0.020 + 0.080C
- Blank baseline: 0.020 AU
- LOD ≈ 0.06 mg/L
- LOQ = 0.20 mg/L
- Upper calibration limit = 2.00 mg/L
This leads to an important rule: a calibration equation is only a reliable quantitative tool within the conditions and range for which it has been validated.
04Detection limit versus quantification limit
The detection limit and quantification limit answer different questions.
Detection limit (LOD)
The limit of detection, or LOD, is the lowest analyte concentration that a method can distinguish from background according to its specified detection criterion.
Below this limit, the signal cannot reliably be distinguished from background using that method.
Limit of quantification (LOQ)
The limit of quantification, or LOQ, is the lowest analyte concentration that can be measured with acceptable precision and accuracy under the method’s validated conditions.
The LOQ is generally higher than the LOD. It takes a stronger signal to determine a reliable amount than to establish that a signal is distinguishable from background.
Calculate the illustrative limits
For this example, use the simplified rules
\[
A_{\mathrm{LOD}}=\bar A_{\text{blank}}+3s
\]
\[
A_{\mathrm{LOQ}}=\bar A_{\text{blank}}+10s
\]
Here, \(A_{\mathrm{LOD}}\) and \(A_{\mathrm{LOQ}}\) are the threshold signals, \(\bar A_{\text{blank}}\) is the mean blank signal, and \(s\) is the standard deviation of the blank readings.
These multipliers are useful for this teaching example, but they are not universal rules for every analytical method. Real laboratories use validated, method-specific procedures to establish their reporting limits.
Using the blank data:
\[
\begin{aligned}
A_{\mathrm{LOD}}&=0.020+3(0.00158)\\
&\approx 0.0247\ \mathrm{AU}
\end{aligned}
\]
\[
\begin{aligned}
A_{\mathrm{LOQ}}&=0.020+10(0.00158)\\
&\approx 0.0358\ \mathrm{AU}
\end{aligned}
\]
These are limits expressed as instrument signals. To express them as equivalent concentrations, use the calibration slope and subtract the blank baseline.
For the LOD:
\[
\begin{aligned}
C_{\mathrm{LOD}}
&=\frac{0.0247-0.0200}{0.080}\\
&\approx 0.059\ \mathrm{mg/L}\\
&\approx 0.06\ \mathrm{mg/L}
\end{aligned}
\]
For the LOQ:
\[
\begin{aligned}
C_{\mathrm{LOQ}}
&=\frac{0.0358-0.0200}{0.080}\\
&\approx 0.198\ \mathrm{mg/L}\\
&\approx 0.20\ \mathrm{mg/L}
\end{aligned}
\]
The method therefore has these illustrative limits:
| Quantity | Value |
|---|---|
| Detection limit | 0.06 mg/L |
| Quantification limit | 0.20 mg/L |
| Lower quantitative calibration limit | 0.20 mg/L |
| Upper quantitative calibration limit | 2.00 mg/L |
The important result is the interval between 0.06 and 0.20 mg/L. Copper may be detectable in this interval, but its concentration cannot be reported reliably using this method.
05How to report the result
Once you know the limits, choose wording that matches the evidence.
If the substance is not detected:
Copper was not detected. The method’s LOD was 0.06 mg/L.
A laboratory may use the reporting convention “ND, LOD = 0.06 mg/L”. Do not replace this with “0 mg/L”.
If the substance is detected below the LOQ:
Copper was detected, but its concentration was below the quantification limit of 0.20 mg/L.
This communicates that the signal was distinguishable from background, without pretending that the amount is known accurately.
If the result is within the quantitative calibration range:
The measured copper concentration was 0.30 mg/L.
Include the units, appropriate significant figures, and any required uncertainty or dilution information.
If the result is above the calibration range:
The initial result was above the validated calibration range. The sample was diluted and reanalysed before the original concentration was calculated.
This makes the basis of the result clear. It also avoids treating an out-of-range measurement as if it were validated.
07Worked examples
Worked example: Calculate a reportable concentration
A creek-water sample gives an absorbance of 0.044 AU. Using the calibration equation \(A=0.020+0.080C\), calculate the copper concentration and determine whether it can be reported quantitatively.
Step 1
The absorbance of 0.044 AU is above the LOQ signal of approximately 0.0358 AU. The concentration should also lie within the validated range of 0.20-2.00 mg/L.
Step 2
\[
C=\frac{A-0.020}{0.080}
\]
Step 3
\[
\begin{aligned}
C&=\frac{0.044-0.020}{0.080}\\
&=\frac{0.024}{0.080}\\
&=0.30\ \mathrm{mg/L}
\end{aligned}
\]
The absorbance units cancel against the calibration slope, leaving concentration units of mg/L.
Step 4
The calculated concentration of 0.30 mg/L lies within the validated quantitative range. Provided the sample matrix and preparation satisfy the method’s conditions, the result can be reported as 0.30 mg/L.
The important point is that the calculation and the range check are both necessary. A plausible numerical answer is not enough on its own.
Worked example: A signal above the LOD but below the LOQ
A second sample gives an absorbance of 0.029 AU. A student uses the calibration equation and reports a copper concentration of approximately 0.11 mg/L. Is that a defensible report?
Step 1
The measured signal is
\[
0.0247<0.029<0.0358
\]
It is above the detection threshold but below the quantification threshold.
Step 2
\[
\begin{aligned}
C&=\frac{0.029-0.020}{0.080}\\
&=\frac{0.009}{0.080}\\
&=0.1125\ \mathrm{mg/L}
\end{aligned}
\]
The equation produces a number, but that does not establish that the number is reliable.
Step 3
The apparent concentration is below the LOQ of 0.20 mg/L. The method has detected a signal consistent with copper, but it cannot quantify the concentration reliably at this level.
A defensible report is:
Copper was detected, but its concentration was below the quantification limit of 0.20 mg/L.
Do not report 0.11 mg/L as a reliable quantitative result. The extra decimal places do not remove the uncertainty.
Worked example: A sample above the calibration range
An undiluted water sample gives an absorbance of 0.220 AU. The quantitative calibration range is 0.20-2.00 mg/L. The analyst dilutes the sample fivefold and obtains a new absorbance of 0.060 AU.
Assuming the dilution is accurate, no copper is lost during preparation, and matrix effects are controlled, determine the original copper concentration.
Step 1
At 2.00 mg/L, the calibration equation predicts an absorbance of 0.180 AU. The undiluted reading of 0.220 AU is above this value.
Directly substituting 0.220 into the equation would give 2.50 mg/L, but that calculation extrapolates beyond the validated calibration range. It is not sufficient evidence for a reliable result.
Step 2
The diluted sample gives \(A=0.060\) AU.
\[
\begin{aligned}
C_{\mathrm{diluted}}
&=\frac{0.060-0.020}{0.080}\\
&=\frac{0.040}{0.080}\\
&=0.50\ \mathrm{mg/L}
\end{aligned}
\]
This concentration lies within the validated calibration range and is above the LOQ.
Step 3
A fivefold dilution means the original concentration was five times the concentration measured in the diluted sample.
\[
\begin{aligned}
C_{\mathrm{original}}
&=5C_{\mathrm{diluted}}\\
&=5(0.50\ \mathrm{mg/L})\\
&=2.50\ \mathrm{mg/L}
\end{aligned}
\]
Step 4
The original sample contains an estimated 2.50 mg/L of copper, based on a diluted measurement within the validated range.
There is no contradiction in reporting an original concentration above 2.00 mg/L. The calibration range applies to the solution actually measured. A validated dilution can bring that solution into range while allowing the original concentration to be calculated.
However, dilution also raises the effective detection and quantification limits when expressed relative to the original sample. If the dilution made the measured signal too weak to quantify, multiplying the result by the dilution factor would not restore the lost reliability.
08Common mistakes
Mistake 1: Reporting zero when a substance is not detected
A non-detect is a statement about the method’s ability to distinguish a signal from background. It is not proof of absolute absence.
Report the non-detect and the relevant method limit instead of automatically assigning a concentration of 0 mg/L.
Mistake 2: Treating the LOD and LOQ as interchangeable
The LOD concerns detection; the LOQ concerns reliable quantification.
A sample can produce a detectable signal without producing a reliable concentration. Always check both limits before deciding what to report.
Mistake 3: Dividing the raw signal by the calibration slope
In the illustrative method, the equation is \(A=0.020+0.080C\), not simply \(A=0.080C\).
The baseline must be accounted for:
\[
C=\frac{A-0.020}{0.080}
\]
Ignoring the intercept incorrectly attributes the background response to copper.
Mistake 4: Extrapolating outside the calibration range
A calculator will return a concentration even when the measured signal is above the validated range. The calculation does not prove that the calibration relationship remains valid there.
Dilute and remeasure when appropriate, then apply the dilution factor.
Mistake 5: Assuming that more decimal places mean greater accuracy
A calculated result of 0.1125 mg/L is not automatically more informative than a report stating “detected, below the LOQ of 0.20 mg/L”.
The number of digits displayed by a calculator says nothing about whether the instrument can support that level of precision.
Mistake 6: Ignoring the sample matrix
A calibration curve may work well for prepared standards but give biased results for a creek-water sample containing other dissolved substances.
If the matrix changes the instrument response, the calibration equation may no longer provide a valid concentration. The method may need a suitable matrix-matched calibration, standard addition, or other validated correction.
09Questions and solutions
Question 1
A water sample gives an absorbance of 0.052 AU. The calibration equation is \(A=0.020+0.080C\), and the validated quantitative range is 0.20-2.00 mg/L.
Calculate the copper concentration and state whether the result can be reported quantitatively.
Solution 1
The copper concentration is 0.40 mg/L, and it lies within the validated quantitative range.
Rearrange the calibration equation:
\[
C=\frac{A-0.020}{0.080}
\]
Substitute the measured absorbance:
\[
\begin{aligned}
C&=\frac{0.052-0.020}{0.080}\\
&=\frac{0.032}{0.080}\\
&=0.40\ \mathrm{mg/L}
\end{aligned}
\]
The calculated concentration is above the LOQ of 0.20 mg/L and below the upper calibration limit of 2.00 mg/L. Provided the method’s other conditions are satisfied, 0.40 mg/L is a defensible quantitative result.
The calculation alone would not establish this. The range check confirms that the method can support the reported value.
Question 2
Five blank measurements give absorbance readings of 0.020, 0.022, 0.019, 0.021, and 0.018 AU. Their mean is 0.020 AU, and their sample standard deviation is 0.00158 AU.
Using the simplified rules
\[
A_{\mathrm{LOD}}=\bar A_{\mathrm{blank}}+3s
\]
and
\[
A_{\mathrm{LOQ}}=\bar A_{\mathrm{blank}}+10s
\]
calculate the LOD and LOQ in mg/L using a calibration slope of 0.080 AU per mg/L.
A sample gives an absorbance of 0.031 AU. How should it be reported?
Solution 2
The method’s LOD is approximately 0.06 mg/L, and its LOQ is approximately 0.20 mg/L. The sample is detected but cannot be quantified reliably.
First calculate the signal thresholds:
\[
\begin{aligned}
A_{\mathrm{LOD}}&=0.020+3(0.00158)\\
&=0.02474\ \mathrm{AU}
\end{aligned}
\]
\[
\begin{aligned}
A_{\mathrm{LOQ}}&=0.020+10(0.00158)\\
&=0.0358\ \mathrm{AU}
\end{aligned}
\]
Convert each threshold into a concentration equivalent:
\[
\begin{aligned}
C_{\mathrm{LOD}}
&=\frac{0.02474-0.020}{0.080}\\
&\approx0.059\ \mathrm{mg/L}\\
&\approx0.06\ \mathrm{mg/L}
\end{aligned}
\]
\[
\begin{aligned}
C_{\mathrm{LOQ}}
&=\frac{0.0358-0.020}{0.080}\\
&\approx0.198\ \mathrm{mg/L}\\
&\approx0.20\ \mathrm{mg/L}
\end{aligned}
\]
The sample signal, 0.031 AU, lies between the two signal thresholds:
\[
0.02474<0.031<0.0358
\]
Its apparent concentration is
\[
\begin{aligned}
C&=\frac{0.031-0.020}{0.080}\\
&=0.1375\ \mathrm{mg/L}
\end{aligned}
\]
Although the calibration equation gives an apparent value of 0.1375 mg/L, this value is below the LOQ. It should not be reported as a reliable concentration.
A defensible statement is “Copper detected, below the LOQ of 0.20 mg/L.”
Question 3
Two laboratories analyse the same creek-water sample using different validated methods.
- Method A has an LOD of 0.06 mg/L and an LOQ of 0.20 mg/L. It reports “not detected”.
- Method B has an LOD of 0.02 mg/L and an LOQ of 0.10 mg/L. It reports “detected, below LOQ”.
Are the results necessarily contradictory? Explain what can be concluded and what remains uncertain.
Solution 3
The reports are not necessarily contradictory. Method B can detect lower concentrations than Method A, so it can distinguish a weak signal that Method A cannot reliably distinguish from background.
For example, a concentration around 0.03 mg/L would be below Method A’s LOD but above Method B’s LOD. Under suitable method conditions, that could produce the two reported outcomes.
However, Method B’s result is still below its LOQ of 0.10 mg/L. It therefore does not provide a reliable quantitative concentration.
The strongest conclusion is that Method B detected a signal consistent with the presence of the analyte, while Method A did not detect it under its own conditions. Neither report establishes the exact concentration.
The important principle is that detection limits are properties of particular methods under specified conditions. They are not universal properties of the pollutant itself.
Question 4
An undiluted water sample gives an absorbance of 0.220 AU. The calibration equation is \(A=0.020+0.080C\), and the validated quantitative range is 0.20-2.00 mg/L.
After a fivefold dilution, the sample gives an absorbance of 0.060 AU.
Calculate the original concentration and explain why the diluted measurement is needed. Assume no analyte is lost and the dilution and sample matrix are suitable for the method.
Solution 4
The original copper concentration is 2.50 mg/L, calculated from the diluted sample’s valid measurement.
The undiluted signal of 0.220 AU exceeds the upper calibration response of 0.180 AU. Directly converting it to a concentration would extrapolate beyond the validated range.
Instead, calculate the diluted concentration:
\[
\begin{aligned}
C_{\mathrm{diluted}}
&=\frac{0.060-0.020}{0.080}\\
&=0.50\ \mathrm{mg/L}
\end{aligned}
\]
The diluted concentration is within the quantitative calibration range.
Apply the dilution factor:
\[
\begin{aligned}
C_{\mathrm{original}}
&=5(0.50\ \mathrm{mg/L})\\
&=2.50\ \mathrm{mg/L}
\end{aligned}
\]
The original concentration exceeds the calibration range, but that is acceptable because the diluted solution was measured within the range and the dilution factor was applied correctly.
The distinction is between the concentration in the original water and the concentration in the solution actually measured by the instrument. The latter must satisfy the method’s quantitative requirements.
Question 5
An environmental guideline for dissolved copper is 0.10 mg/L.
A laboratory uses a method with an LOD of 0.06 mg/L, an LOQ of 0.20 mg/L, and a calibration equation of \(A=0.020+0.080C\). The validated quantitative range is 0.20-2.00 mg/L.
A creek-water sample gives an absorbance of 0.029 AU.
One student calculates an apparent concentration and concludes that the sample exceeds the guideline. Another argues that because the result is below the LOQ, the sample complies with the guideline.
Which conclusion is justified? Explain the flaw in both arguments and identify the next measurement needed to make a defensible decision.
Solution 5
Neither compliance nor exceedance can be established reliably from this result. The sample signal is detectable, but the method cannot quantify the concentration reliably enough to determine whether it is above or below the 0.10 mg/L guideline.
The first student calculates
\[
\begin{aligned}
C_{\mathrm{apparent}}
&=\frac{0.029-0.020}{0.080}\\
&=0.1125\ \mathrm{mg/L}
\end{aligned}
\]
The tempting conclusion is that 0.1125 mg/L exceeds 0.10 mg/L, so the sample must fail the guideline.
The problem is that the calculated value lies below the method’s LOQ of 0.20 mg/L. It is an apparent concentration, not a reliably quantified result. Comparing it directly with the guideline treats a weak, uncertain measurement as if it were an established concentration.
The second student makes the opposite mistake. Being below the LOQ does not mean that the concentration is below the environmental guideline. The LOQ is a limit on the method’s quantitative reliability, not a pollutant safety threshold.
Here, the guideline of 0.10 mg/L lies between the LOD of 0.06 mg/L and the LOQ of 0.20 mg/L. The method can detect a signal in this region, but it cannot reliably quantify the concentration needed to classify the sample.
The next step is to use a validated method with an LOQ below 0.10 mg/L and a suitable quantitative range around the guideline. The sample matrix must also be accounted for, and the analysis should follow the method’s requirements for preparation, calibration, and uncertainty.
This is the crucial decision: a method can be sensitive enough to detect a pollutant but not sensitive enough to determine whether its concentration meets an environmental limit.
10What to check next
When using analytical results to assess pollution, check that the method’s LOQ is below the concentration you need to judge. Then confirm that the sample matrix, calibration range, and any dilution steps are appropriate.
The next useful concept is calibration quality: how standards, blank measurements, precision, accuracy, and recovery determine whether a calculated concentration is genuinely trustworthy.