
Titration Curves and Conductivity Graphs for HSC Chemistry
Learn how to interpret titration curves and conductivity graphs by tracking equivalence points, changing ions, buffer regions, and acid-base strength.
You add \(\ce{NaOH}\) to two colourless acid samples. Both require exactly \(25.0\ \text{mL}\) to reach equivalence. If you only watched the burette, they would look identical. But one pH curve starts very low and shoots through about pH 7, while the other starts higher, develops a broad gently sloping region, and reaches equivalence above pH 7.
Predict which acid is weak before reading on.
It is the second one. The equal equivalence volumes tell us the two samples contained the same reacting amount of acid, not that the acids had the same strength. A titration curve tells us how the acid-base balance changes. A conductivity graph tells us something different: which ions are present, how concentrated they are, and how effectively they carry charge.
Reading both graphs together lets you see chemistry that a burette volume alone hides.
01The two graphs are watching different things
A pH probe mainly tells you about the balance between \(\ce{H3O+}\) and \(\ce{OH-}\). A conductivity probe responds to all dissolved ions.
That distinction is the starting point.
| Graph | Vertical axis tells you about | Equivalence usually appears as |
|---|---|---|
| Titration curve | pH | the inflection point, near the centre of the steepest change |
| Conductivity graph | electrical conductivity | a minimum or, more generally, a change in slope |
| Both together | acid-base chemistry plus changing ion populations | matching evidence for the same stoichiometric point |
The equivalence point itself is a stoichiometric idea. It occurs when acid and base have reacted in exactly the ratio required by the balanced equation.
For a monoprotic acid reacting with hydroxide,
\[
\ce{HA + OH- -> A- + H2O}
\]
the equivalence point occurs when
\[
n(\ce{HA}) = n(\ce{OH-})
\]
where \(n\) is amount in moles.
The wide vertical-looking part of a pH graph is an equivalence region. The exact equivalence point is one point inside that region, usually identified from the inflection point or maximum slope.
An indicator endpoint is different again. It is the experimentally observed colour change. A good indicator is chosen so that its colour-change range lies inside the steep part of the titration curve.
02How to read a titration curve
Suppose an acid is in the conical flask and \(\ce{NaOH}\) is added from the burette.
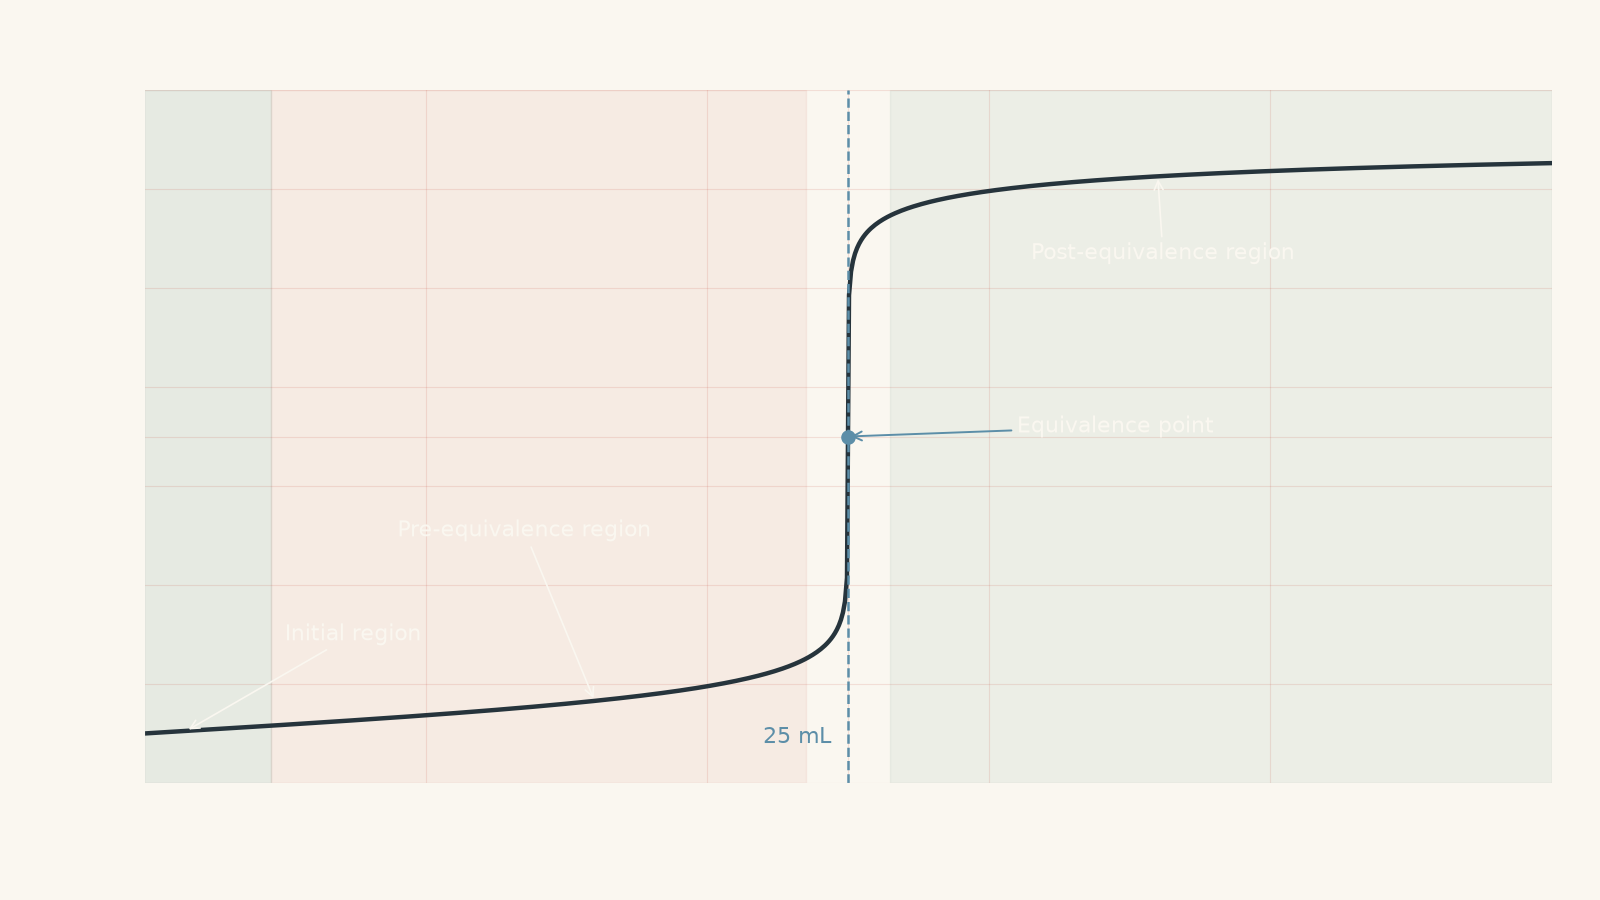
Read the curve from left to right. You are effectively watching the solution pass through four stages:
- before much titrant has been added,
- before equivalence,
- at equivalence,
- after equivalence.
The chemistry controlling pH changes at each stage.
Strong acid with strong base
Imagine \(\ce{HCl}\) being titrated with \(\ce{NaOH}\).
Both substances dissociate essentially completely:
\[
\ce{HCl + H2O -> H3O+ + Cl-}
\]
\[
\ce{NaOH -> Na+ + OH-}
\]
The reaction controlling the titration is
\[
\ce{H3O+ + OH- -> 2H2O}
\]
At the start, there is a large concentration of \(\ce{H3O+}\), so the pH is low.
Before equivalence, every added mole of \(\ce{OH-}\) removes a mole of \(\ce{H3O+}\). There is still excess strong acid, so that excess determines the pH.
Near equivalence, a tiny extra volume of base can change the solution from having a small excess of \(\ce{H3O+}\) to having a small excess of \(\ce{OH-}\). That is why the curve rises so sharply.
At \(25^\circ\text{C}\), an ideal strong acid-strong base titration has an equivalence pH of about 7.
After equivalence, excess \(\ce{OH-}\) determines the pH.
Weak acid with strong base
Now replace the \(\ce{HCl}\) with a weak monoprotic acid, \(\ce{HA}\).
A weak acid only partially ionises:
\[
\ce{HA + H2O <=> H3O+ + A-}
\]
You might predict that adding \(\ce{OH-}\) simply removes the small amount of \(\ce{H3O+}\), after which the titration should immediately be finished.
It does not.
As \(\ce{OH-}\) removes \(\ce{H3O+}\), the weak-acid equilibrium shifts and more \(\ce{HA}\) ionises. Overall, the added hydroxide converts \(\ce{HA}\) into its conjugate base:
\[
\ce{HA + OH- -> A- + H2O}
\]
One way to picture \(\ce{HA}\) is as a couple that usually stays together. Hydroxide keeps taking away the \(\mathrm{H}^{+}\) partner, so more pairs separate to restore the equilibrium. The analogy stops there: molecules obviously do not have relationship drama. The real process is a dynamic equilibrium governed by \(K_a\).
Before equivalence, significant amounts of both \(\ce{HA}\) and \(\mathrm{A}^{-}\) are present. This is a buffer.
That produces the broad, gently sloping buffer region on the titration curve.
The half-equivalence point
For a monoprotic weak acid titrated with a strong base, the half-equivalence point is especially useful.
At this point, exactly half the original \(\ce{HA}\) has been converted into \(\mathrm{A}^{-}\), so
\[
[\ce{HA}] = [\mathrm{A}^{-}]
\]
Using the Henderson-Hasselbalch equation,
\[
\text{pH} = \text{p}K_a + \log\left(\frac{[\mathrm{A}^{-}]}{[\ce{HA}]}\right)
\]
the concentration ratio is 1, so \(\log(1)=0\):
\[
\text{pH} = \text{p}K_a
\]
This gives you a powerful graph-reading rule:
For a weak acid-strong base titration, the pH halfway to equivalence equals the acid’s \(\text{p}K_a\).
It is the volume that is halfway to equivalence, not the pH.
Why weak-acid equivalence is above pH 7
At equivalence, the original \(\ce{HA}\) has essentially been converted to \(\mathrm{A}^{-}\).
The solution therefore contains the conjugate base of a weak acid. That base reacts with water:
\[
\ce{A- + H2O <=> HA + OH-}
\]
The production of \(\ce{OH-}\) makes the equivalence solution basic.
So, at \(25^\circ\text{C}\):
- strong acid + strong base: equivalence pH \(\approx 7\),
- weak acid + strong base: equivalence pH \(>7\),
- weak base + strong acid: equivalence pH \(<7\).
Do not memorise those as unexplained numbers. Ask which species is left at equivalence and whether that species reacts with water.
Characteristic acid-base profiles
| Analyte in flask | Titrant | Important curve features |
|---|---|---|
| Strong acid | Strong base | very low initial pH, no buffer region, large steep rise, equivalence near pH 7 |
| Weak acid | Strong base | higher initial pH, buffer region, \(\text{pH}=\text{p}K_a\) at half-equivalence, equivalence above 7 |
| Strong base | Strong acid | high initial pH, large steep fall, equivalence near pH 7 |
| Weak base | Strong acid | lower initial pH than strong base, buffer region, equivalence below 7 |
| Weak acid | Weak base | much smaller pH change near equivalence; equivalence pH depends on relative acid and base strengths |
A common mistake is to use equivalence pH to decide how many moles reacted. Acid strength does not change the stoichiometric mole ratio. A weak acid can require exactly the same amount of \(\ce{NaOH}\) as a strong acid if the samples contain the same number of acidic moles.
For the broader process of using equivalence data to identify an unknown, see Acid-Base Titration of an Unknown: HSC Chemistry Guide.
Worked example: Find an acid concentration from its curve
A \(20.00\ \text{mL}\) sample of nitric acid, \(\ce{HNO3}\), is titrated with \(0.1250\ \text{mol L}^{-1}\) \(\ce{KOH}\). The centre of the steep section of the titration curve occurs after \(16.40\ \text{mL}\) of \(\ce{KOH}\) has been added. Calculate the concentration of the nitric acid and predict the approximate pH at equivalence at \(25^\circ\text{C}\).
Step 1
Nitric acid is monoprotic:
\[
\ce{HNO3 + KOH -> KNO3 + H2O}
\]
The mole ratio is \(1:1\).
Step 2
Using \(n=cV\), where \(n\) is amount in moles, \(c\) is concentration in \(\text{mol L}^{-1}\), and \(V\) is volume in litres:
\[
\begin{aligned}
n(\ce{KOH})
&=0.1250\times0.01640\\
&=2.050\times10^{-3}\ \text{mol}
\end{aligned}
\]
Step 3
At equivalence,
\[
n(\ce{HNO3})=2.050\times10^{-3}\ \text{mol}
\]
Step 4
\[
\begin{aligned}
c(\ce{HNO3})
&=\frac{n}{V}\\
&=\frac{2.050\times10^{-3}}{0.02000}\\
&=0.1025\ \text{mol L}^{-1}
\end{aligned}
\]
Step 5
Both \(\ce{HNO3}\) and \(\ce{KOH}\) are strong. Their remaining ions, mainly \(\mathrm{K}^{+}\) and \(\ce{NO3-}\), do not significantly hydrolyse.
The equivalence pH is therefore approximately 7 at \(25^\circ\text{C}\).
The important point is that the steep-region volume gives the stoichiometry. The shape and equivalence pH then tell you about acid and base strength.
03Conductivity graphs: follow the ions
Conductivity measures how readily a solution carries electric current.
In a dilute solution, a useful model is
\[
\kappa \approx \sum_i \lambda_i c_i
\]
where:
- \(\kappa\) is conductivity,
- \(c_i\) is the concentration of ion \(i\),
- \(\lambda_i\) represents how effectively that ion carries charge.
You are not usually expected to calculate a titration conductivity curve from this equation in HSC Chemistry. The equation is useful because it stops one major misconception:
Conductivity is not simply proportional to the number of ions.
The identity of the ions matters too. \(\ce{H3O+}\) and \(\ce{OH-}\) are particularly effective charge carriers in water.
Picture a hallway full of people carrying messages. Adding more people can increase the rate of message transfer, but replacing very fast runners with slower walkers can reduce it even if the hallway still contains plenty of people. Real ions do not literally sprint through a solution, of course; conductivity depends on their electrical mobility in the solvent.
Spectator does not mean invisible
Consider
\[
\ce{HCl + NaOH -> NaCl + H2O}
\]
The net ionic equation is
\[
\ce{H3O+ + OH- -> 2H2O}
\]
so \(\mathrm{Na}^{+}\) and \(\mathrm{Cl}^{-}\) are spectator ions.
A student might therefore leave them out when explaining a conductivity graph.
That is a mistake.
“Spectator” only means the ion does not undergo the chemical change represented by the net ionic equation. It still carries electric current.
04Strong acid plus strong base: why the conductivity graph falls then rises
Take \(\ce{HCl}\) in the flask and add \(\ce{NaOH}\).
Before equivalence
The main ions are:
- \(\ce{H3O+}\),
- \(\mathrm{Cl}^{-}\),
- increasing \(\mathrm{Na}^{+}\).
Added \(\ce{OH-}\) is immediately consumed by \(\ce{H3O+}\).
As titration proceeds, highly mobile \(\ce{H3O+}\) is removed and effectively replaced by less mobile \(\mathrm{Na}^{+}\). Dilution also occurs because more solution is being added.
Conductivity therefore falls strongly.
At equivalence
There is no stoichiometric excess of either \(\ce{H3O+}\) or \(\ce{OH-}\).
The major dissolved ions are approximately \(\mathrm{Na}^{+}\) and \(\mathrm{Cl}^{-}\).
For a simple strong acid-strong base conductometric titration, conductivity reaches a minimum close to equivalence.
After equivalence
Extra \(\ce{NaOH}\) now leaves unreacted \(\ce{OH-}\) in solution.
Because \(\ce{OH-}\) is a highly effective charge carrier, conductivity rises.
The result is the familiar V-shaped or approximately V-shaped profile.
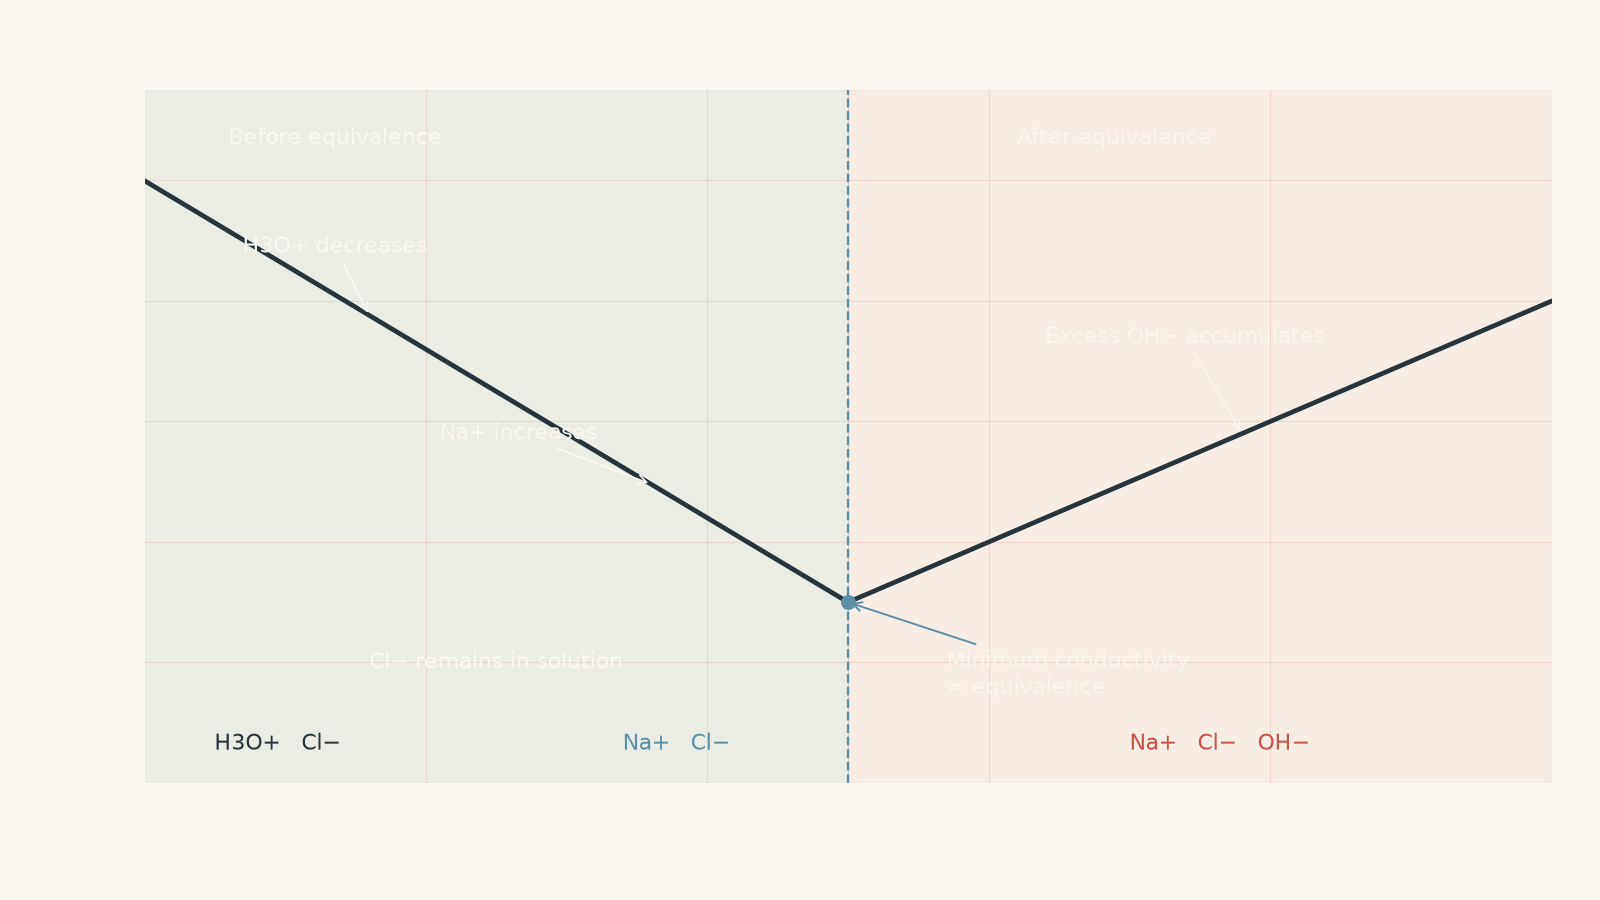
The straight sides often drawn in textbook diagrams are an approximation. Real measurements can curve because concentrations, dilution, temperature, and ionic mobilities are changing.
05Weak acid plus strong base: why there may be no conductivity minimum
Now titrate weak \(\ce{HA}\) with \(\ce{NaOH}\).
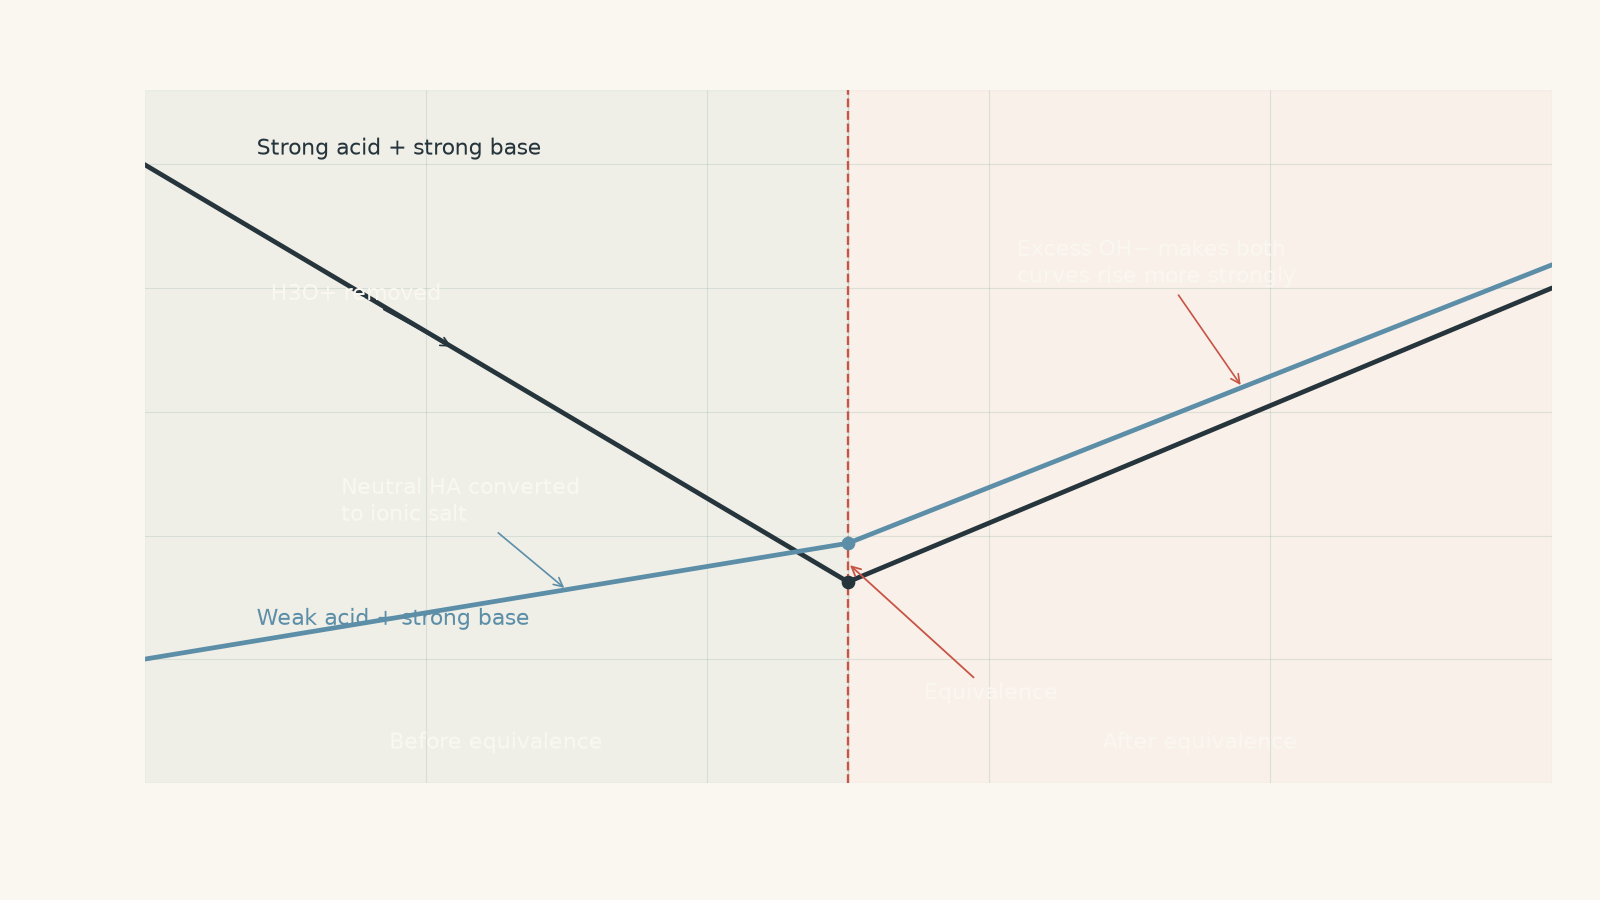
Initially, most acid molecules remain as neutral \(\ce{HA}\). There are relatively few ions, so conductivity is much lower than for a strong acid of the same formal concentration.
Add some \(\ce{NaOH}\):
\[
\ce{HA + OH- -> A- + H2O}
\]
The \(\ce{OH-}\) is consumed, but each neutral \(\ce{HA}\) converted produces dissolved \(\mathrm{A}^{-}\), while the added solution also supplies \(\mathrm{Na}^{+}\).
So the solution is being converted from mostly neutral weak acid into an ionic salt.
Conductivity generally rises.
At equivalence, most of the acid has become \(\mathrm{Na}^{+}\) and \(\mathrm{A}^{-}\).
After equivalence, added \(\ce{OH-}\) begins to accumulate. The conductivity then rises more steeply.
The equivalence point is therefore identified from a change in slope rather than from a minimum.
This gives an excellent decision rule:
- falling then rising conductivity suggests removal of a highly mobile strong-acid or strong-base ion followed by excess titrant,
- gently rising then more steeply rising conductivity can indicate a weak electrolyte being converted into an ionic salt before excess strong titrant appears.
Do not use that rule without checking which reagent is in the flask and which is being added. Reversing the titration can change the graph dramatically.
06Use the pH and conductivity evidence together
One graph can sometimes leave several possible explanations. Two graphs constrain the interpretation.
Suppose \(\ce{NaOH}\) is added to an unknown monoprotic acid.
| Observation | What it suggests |
|---|---|
| very low initial pH | substantial initial \(\ce{H3O+}\); likely strong acid |
| higher initial pH at similar formal concentration | weak acid is plausible |
| broad buffer region | weak acid/conjugate base pair is present |
| half-equivalence pH measurable | gives \(\text{p}K_a\) for a weak acid |
| equivalence near pH 7 | strong acid-strong base, under usual HSC assumptions |
| equivalence above pH 7 | conjugate base hydrolysis; weak acid-strong base |
| conductivity falls strongly before equivalence | highly mobile ion such as \(\ce{H3O+}\) is being removed |
| conductivity rises before equivalence | neutral weak electrolyte is being converted into ions |
| conductivity slope steepens after equivalence | excess strong titrant ion is accumulating |
The graphs are strongest when you make the two explanations agree.
For example, a weak-acid conclusion should not come only from “the initial pH looks a bit higher”. A buffer region, an equivalence pH above 7, and a conductivity increase as ionic salt forms all support the same model.
Worked example: Extract concentration, \(K_a\), and equivalence chemistry
A \(25.00\ \text{mL}\) sample of a monoprotic weak acid \(\ce{HA}\) is titrated with \(0.1000\ \text{mol L}^{-1}\) \(\ce{NaOH}\). The titration curve has an equivalence point at \(30.00\ \text{mL}\), and the pH at \(15.00\ \text{mL}\) is 4.20.
Calculate the original concentration of \(\ce{HA}\), determine \(K_a\), estimate the pH at equivalence at \(25^\circ\text{C}\), and predict the main shape of the conductivity graph.
Step 1
At equivalence,
\[
n(\ce{HA})=n(\ce{OH-})
\]
so
\[
\begin{aligned}
n(\ce{OH-})
&=cV\\
&=0.1000\times0.03000\\
&=3.000\times10^{-3}\ \text{mol}
\end{aligned}
\]
Therefore the original sample contained
\[
3.000\times10^{-3}\ \text{mol}
\]
of \(\ce{HA}\).
Step 2
\[
\begin{aligned}
c(\ce{HA})
&=\frac{3.000\times10^{-3}}{0.02500}\\
&=0.1200\ \text{mol L}^{-1}
\end{aligned}
\]
Step 3
Half of \(30.00\ \text{mL}\) is \(15.00\ \text{mL}\).
At half-equivalence,
\[
\text{pH}=\text{p}K_a
\]
Therefore
\[
\text{p}K_a=4.20
\]
and
\[
\begin{aligned}
K_a
&=10^{-4.20}\\
&=6.31\times10^{-5}
\end{aligned}
\]
Step 4
The original \(3.000\times10^{-3}\ \text{mol}\) of \(\ce{HA}\) has been converted mainly to \(\mathrm{A}^{-}\).
The total volume is
\[
25.00+30.00=55.00\ \text{mL}=0.05500\ \text{L}
\]
so
\[
[\mathrm{A}^{-}]
=\frac{3.000\times10^{-3}}{0.05500}
=0.05455\ \text{mol L}^{-1}
\]
The conjugate base hydrolyses:
\[
\ce{A- + H2O <=> HA + OH-}
\]
Step 5
At \(25^\circ\text{C}\),
\[
K_aK_b=K_w=1.0\times10^{-14}
\]
so
\[
\begin{aligned}
K_b
&=\frac{1.0\times10^{-14}}{6.31\times10^{-5}}\\
&=1.58\times10^{-10}
\end{aligned}
\]
Step 6
For a weak base, using the usual small-\(x\) approximation,
\[
K_b\approx\frac{[\ce{OH-}]^2}{[\mathrm{A}^{-}]}
\]
Therefore
\[
\begin{aligned}
[\ce{OH-}]
&\approx\sqrt{K_b[\mathrm{A}^{-}]}\\
&=\sqrt{(1.58\times10^{-10})(0.05455)}\\
&=2.94\times10^{-6}\ \text{mol L}^{-1}
\end{aligned}
\]
Then
\[
\begin{aligned}
\text{pOH}&=-\log(2.94\times10^{-6})=5.53\\
\text{pH}&=14.00-5.53=8.47
\end{aligned}
\]
The equivalence solution is basic, as expected for a weak acid titrated with a strong base.
Step 7
Initially, conductivity is relatively low because \(\ce{HA}\) is only partially ionised.
Before equivalence, conductivity should generally increase as neutral \(\ce{HA}\) is converted into \(\mathrm{Na}^{+}\) and \(\mathrm{A}^{-}\).
After \(30.00\ \text{mL}\), excess \(\ce{OH-}\) begins accumulating, so the graph should rise more steeply.
The equivalence volume should appear as a change in slope, not necessarily as a minimum.
07The most tempting graph-reading mistakes
Mistake: “Equivalence always occurs at pH 7”
Only a strong acid-strong base titration has an equivalence pH of approximately 7 at \(25^\circ\text{C}\) under the usual ideal assumptions.
Ask what species remains at equivalence.
If it is the conjugate base of a weak acid, expect a basic solution. If it is the conjugate acid of a weak base, expect an acidic solution.
Mistake: “The lowest conductivity is always the equivalence point”
That works well for a simple strong acid-strong base conductometric titration because highly mobile \(\ce{H3O+}\) is removed before equivalence and excess \(\ce{OH-}\) appears afterwards.
A weak acid titrated with strong base can rise throughout the titration. Its equivalence point is then found from the change in slope.
Mistake: “More ions always means greater conductivity”
Ion concentration matters, but mobility matters too.
Replacing \(\ce{H3O+}\) with \(\mathrm{Na}^{+}\) can lower conductivity even though the solution remains full of ions.
Dilution also matters.
Mistake: “Spectator ions do not matter”
They do not appear in the net ionic reaction, but they absolutely contribute to conductivity.
Mistake: “Half-equivalence means pH is halfway between the starting and equivalence pH”
No. Half-equivalence is defined by amount reacted.
For a weak monoprotic acid,
\[
n(\ce{HA\ converted})=\frac{1}{2}n(\ce{HA\ initially})
\]
and therefore
\[
[\ce{HA}]=[\mathrm{A}^{-}]
\]
which gives
\[
\text{pH}=\text{p}K_a
\]
The pH scale is logarithmic, so taking an arithmetic halfway point between two pH values has no chemical basis.
08Questions and solutions
Question 1
A \(20.00\ \text{mL}\) sample of a monoprotic acid is titrated with \(0.1000\ \text{mol L}^{-1}\) \(\ce{NaOH}\).
Its titration curve begins near pH 3, contains a clear buffer region, and has an equivalence point at \(24.00\ \text{mL}\) with pH 8.7.
Determine:
- whether the acid is strong or weak,
- its original concentration,
- the relationship between pH and \(\text{p}K_a\) at \(12.00\ \text{mL}\) of added base.
Solution 1
The acid is weak, its original concentration is \(0.1200\ \text{mol L}^{-1}\), and at \(12.00\ \text{mL}\) the pH equals \(\text{p}K_a\).
The buffer region is strong evidence for a weak acid because appreciable amounts of \(\ce{HA}\) and \(\mathrm{A}^{-}\) coexist before equivalence. The equivalence pH of 8.7 supports the same conclusion: \(\mathrm{A}^{-}\) hydrolyses to produce \(\ce{OH-}\).
At equivalence,
\[
n(\ce{HA})=n(\ce{OH-})
\]
so
\[
\begin{aligned}
n(\ce{OH-})
&=(0.1000)(0.02400)\\
&=2.400\times10^{-3}\ \text{mol}
\end{aligned}
\]
Therefore
\[
\begin{aligned}
c(\ce{HA})
&=\frac{2.400\times10^{-3}}{0.02000}\\
&=0.1200\ \text{mol L}^{-1}
\end{aligned}
\]
Half the equivalence volume is
\[
\frac{24.00}{2}=12.00\ \text{mL}
\]
so at that volume,
\[
[\ce{HA}]=[\mathrm{A}^{-}]
\]
and hence
\[
\text{pH}=\text{p}K_a
\]
The tempting route is to see an equivalence volume and immediately classify the acid from the amount of base used. That cannot work. Equivalence volume measures reacting amount; the buffer region and equivalence pH reveal acid strength.
Question 2
A \(25.00\ \text{mL}\) sample of an unknown monoprotic acid is titrated with \(0.1000\ \text{mol L}^{-1}\) \(\ce{NaOH}\).
Its conductivity falls steeply as base is added, reaches a minimum at \(20.00\ \text{mL}\), then rises sharply. A pH probe shows that the steep pH change is centred close to pH 7 at the same volume.
Determine the concentration of the acid and explain, in terms of the ions present, why the conductivity falls before \(20.00\ \text{mL}\) and rises afterwards.
Solution 2
The acid is consistent with a strong monoprotic acid of concentration \(0.08000\ \text{mol L}^{-1}\); conductivity falls because highly mobile \(\ce{H3O+}\) is removed before equivalence, then rises because excess \(\ce{OH-}\) accumulates after equivalence.
At the conductivity minimum and pH inflection,
\[
V_{\text{eq}}=20.00\ \text{mL}=0.02000\ \text{L}
\]
The amount of hydroxide added is
\[
\begin{aligned}
n(\ce{OH-})
&=cV\\
&=(0.1000)(0.02000)\\
&=2.000\times10^{-3}\ \text{mol}
\end{aligned}
\]
For a monoprotic acid,
\[
n(\text{acid})=2.000\times10^{-3}\ \text{mol}
\]
Therefore
\[
\begin{aligned}
c(\text{acid})
&=\frac{2.000\times10^{-3}}{0.02500}\\
&=0.08000\ \text{mol L}^{-1}
\end{aligned}
\]
Before equivalence, added \(\ce{OH-}\) reacts with \(\ce{H3O+}\):
\[
\ce{H3O+ + OH- -> 2H2O}
\]
The amount of \(\ce{H3O+}\) therefore decreases. At the same time, \(\mathrm{Na}^{+}\) from the titrant remains in solution. Replacing highly mobile \(\ce{H3O+}\) with less mobile \(\mathrm{Na}^{+}\), together with dilution, causes conductivity to decrease.
At equivalence there is no stoichiometric excess of \(\ce{H3O+}\) or \(\ce{OH-}\), giving the conductivity minimum in this system.
After equivalence, added \(\ce{OH-}\) is no longer consumed and its concentration rises, so conductivity increases strongly.
The tempting explanation is simply “there are fewer ions before equivalence”. That is incomplete. Spectator ions remain, and \(\mathrm{Na}^{+}\) is being added. The crucial change is both ion concentration and ion mobility.
Question 3
Two \(25.00\ \text{mL}\) monoprotic acid samples, A and B, each have concentration \(0.1000\ \text{mol L}^{-1}\). Each is separately titrated with \(0.1000\ \text{mol L}^{-1}\) \(\ce{NaOH}\).
Both reach equivalence at \(25.00\ \text{mL}\).
For A:
- conductivity begins high, falls to a minimum, then rises,
- equivalence occurs close to pH 7.
For B:
- initial conductivity is much lower,
- conductivity rises gently before \(25.00\ \text{mL}\) and more steeply afterwards,
- equivalence occurs at pH 8.8,
- at \(12.50\ \text{mL}\), pH \(=4.76\).
Identify the acid type represented by A and B, calculate \(K_a\) for B, and estimate the pH of each mixture after \(30.00\ \text{mL}\) of \(\ce{NaOH}\) has been added.
Solution 3
A behaves as a strong acid, B behaves as a weak acid with \(K_a=1.74\times10^{-5}\), and after \(30.00\ \text{mL}\) of \(\ce{NaOH}\) both solutions have approximately pH \(11.96\).
A has the classic strong acid-strong base evidence: high initial conductivity due to abundant \(\ce{H3O+}\), a conductivity minimum near equivalence, and an equivalence pH near 7.
B has lower initial conductivity because most weak-acid molecules are neutral. Its conductivity increases as neutral acid is converted into ionic salt, and its equivalence pH above 7 shows that the conjugate base hydrolyses.
For B, \(12.50\ \text{mL}\) is half the \(25.00\ \text{mL}\) equivalence volume. Therefore
\[
\text{p}K_a=4.76
\]
and
\[
\begin{aligned}
K_a
&=10^{-4.76}\\
&=1.74\times10^{-5}
\end{aligned}
\]
Now consider \(30.00\ \text{mL}\) of base.
Each acid sample initially contains
\[
(0.1000)(0.02500)
=2.500\times10^{-3}\ \text{mol}
\]
of acid.
The amount of \(\ce{OH-}\) added is
\[
(0.1000)(0.03000)
=3.000\times10^{-3}\ \text{mol}
\]
so the excess is
\[
3.000\times10^{-3}-2.500\times10^{-3}
=5.000\times10^{-4}\ \text{mol}
\]
The total volume is
\[
25.00+30.00=55.00\ \text{mL}=0.05500\ \text{L}
\]
Therefore
\[
\begin{aligned}
[\ce{OH-}]
&=\frac{5.000\times10^{-4}}{0.05500}\\
&=9.09\times10^{-3}\ \text{mol L}^{-1}
\end{aligned}
\]
so
\[
\begin{aligned}
\text{pOH}&=-\log(9.09\times10^{-3})=2.04\\
\text{pH}&=14.00-2.04=11.96
\end{aligned}
\]
For B, \(\mathrm{A}^{-}\) can also hydrolyse, but once there is this much excess strong base, that contribution is negligible compared with the directly added \(\ce{OH-}\).
The tempting prediction is that the weak acid must always have the higher pH because its conjugate base is basic. That matters at equivalence. Once a substantial excess of the same strong base is present, the excess \(\ce{OH-}\) dominates both solutions.
Question 4
A student places \(25.00\ \text{mL}\) of \(0.1000\ \text{mol L}^{-1}\) \(\ce{NaOH}\) in a flask and titrates it with \(0.1000\ \text{mol L}^{-1}\) of a weak monoprotic acid \(\ce{HA}\), for which
\[
K_a=1.8\times10^{-5}
\]
at \(25^\circ\text{C}\).
Determine:
- the equivalence volume,
- the approximate pH at equivalence,
- the pH after \(37.50\ \text{mL}\) of acid has been added,
- how the conductivity graph should differ from the familiar V-shaped graph obtained when a strong acid is titrated with a strong base.
Assume ideal dilute-solution behaviour and use \(K_w=1.0\times10^{-14}\).
Solution 4
Equivalence occurs at \(25.00\ \text{mL}\), its pH is approximately \(8.72\), the pH after \(37.50\ \text{mL}\) is approximately \(5.05\), and the conductivity need not turn sharply upwards after equivalence because the excess titrant is a weak, mostly neutral acid.
The initial amount of hydroxide is
\[
\begin{aligned}
n(\ce{OH-})
&=(0.1000)(0.02500)\\
&=2.500\times10^{-3}\ \text{mol}
\end{aligned}
\]
Because \(\ce{HA}\) is monoprotic, the same amount of acid is required:
\[
V=\frac{2.500\times10^{-3}}{0.1000}
=0.02500\ \text{L}
\]
so
\[
V_{\text{eq}}=25.00\ \text{mL}
\]
At equivalence, the solution contains mainly the salt \(\ce{NaA}\). The concentration of \(\mathrm{A}^{-}\) is approximately
\[
[\mathrm{A}^{-}]
=\frac{2.500\times10^{-3}}{0.05000}
=0.05000\ \text{mol L}^{-1}
\]
First calculate \(K_b\):
\[
\begin{aligned}
K_b
&=\frac{K_w}{K_a}\\
&=\frac{1.0\times10^{-14}}{1.8\times10^{-5}}\\
&=5.56\times10^{-10}
\end{aligned}
\]
For
\[
\ce{A- + H2O <=> HA + OH-}
\]
the weak-base approximation gives
\[
\begin{aligned}
[\ce{OH-}]
&\approx\sqrt{K_b[\mathrm{A}^{-}]}\\
&=\sqrt{(5.56\times10^{-10})(0.05000)}\\
&=5.27\times10^{-6}\ \text{mol L}^{-1}
\end{aligned}
\]
Therefore
\[
\begin{aligned}
\text{pOH}&=5.28\\
\text{pH}&=14.00-5.28\\
&=8.72
\end{aligned}
\]
Now add \(37.50\ \text{mL}\) of acid.
The amount added is
\[
(0.1000)(0.03750)
=3.750\times10^{-3}\ \text{mol}
\]
The first \(2.500\times10^{-3}\ \text{mol}\) neutralises the original hydroxide and becomes \(\mathrm{A}^{-}\). This leaves
\[
3.750\times10^{-3}-2.500\times10^{-3}
=1.250\times10^{-3}\ \text{mol}
\]
of excess \(\ce{HA}\).
The mixture is now a buffer with
\[
n(\mathrm{A}^{-})=2.500\times10^{-3}\ \text{mol}
\]
and
\[
n(\ce{HA})=1.250\times10^{-3}\ \text{mol}
\]
Since both are in the same total volume, their mole ratio can be used in Henderson-Hasselbalch.
First,
\[
\text{p}K_a=-\log(1.8\times10^{-5})=4.74
\]
Then
\[
\begin{aligned}
\text{pH}
&=\text{p}K_a+\log\left(\frac{n(\mathrm{A}^{-})}{n(\ce{HA})}\right)\\
&=4.74+\log\left(\frac{2.500}{1.250}\right)\\
&=4.74+\log(2)\\
&=5.05
\end{aligned}
\]
The conductivity behaviour is the subtler part.
Before equivalence, highly mobile \(\ce{OH-}\) is removed and converted into \(\mathrm{A}^{-}\), while the solution is also diluted. Conductivity should therefore fall.
If the titrant were a strong acid, excess \(\ce{H3O+}\) would accumulate after equivalence and conductivity would rise sharply.
Here, however, the excess substance is weak \(\ce{HA}\), which remains mostly neutral. After equivalence, conductivity may continue decreasing more gently or flatten rather than producing the familiar strong V-shaped rise. The exact measured shape depends on ion mobilities and dilution.
The tempting route is to say “conductivity always reaches a minimum at equivalence”. That rule quietly assumes a particular titration arrangement. The identity and strength of the excess titrant determine what happens next.
Question 5
A \(20.00\ \text{mL}\) sample contains both a strong monoprotic acid, \(\ce{HCl}\), and a weak monoprotic acid, \(\ce{HA}\). The mixture is titrated with \(0.1000\ \text{mol L}^{-1}\) \(\ce{NaOH}\).
The conductivity graph:
- falls steeply until \(6.00\ \text{mL}\),
- reaches a minimum there,
- then rises gently from \(6.00\ \text{mL}\) to \(22.00\ \text{mL}\),
- then rises much more steeply after \(22.00\ \text{mL}\).
The pH curve shows no large vertical jump at \(6.00\ \text{mL}\). It has a broad buffer-like region between the two conductivity breakpoints and a major steep rise centred near \(22.00\ \text{mL}\).
At \(14.00\ \text{mL}\) of added \(\ce{NaOH}\), the measured pH is 4.80.
Assuming the two conductivity breakpoints correspond to completion of the strong-acid component and completion of all acidic protons respectively:
- determine the original concentrations of \(\ce{HCl}\) and \(\ce{HA}\),
- determine \(K_a\) for \(\ce{HA}\),
- explain why \(14.00\ \text{mL}\), rather than \(11.00\ \text{mL}\), is the half-equivalence point relevant to \(\ce{HA}\),
- explain all three conductivity regions.
Solution 5
The mixture contains \(0.0300\ \text{mol L}^{-1}\) \(\ce{HCl}\) and \(0.0800\ \text{mol L}^{-1}\) \(\ce{HA}\); the weak acid has \(K_a=1.58\times10^{-5}\); and its half-equivalence point occurs at \(14.00\ \text{mL}\) because its neutralisation occupies only the interval from \(6.00\) to \(22.00\ \text{mL}\).
The first \(6.00\ \text{mL}\) corresponds to the strong-acid component.
Its amount is
\[
\begin{aligned}
n(\ce{HCl})
&=(0.1000)(0.00600)\\
&=6.00\times10^{-4}\ \text{mol}
\end{aligned}
\]
Therefore
\[
\begin{aligned}
c(\ce{HCl})
&=\frac{6.00\times10^{-4}}{0.02000}\\
&=0.0300\ \text{mol L}^{-1}
\end{aligned}
\]
The second breakpoint occurs at \(22.00\ \text{mL}\), so the base required for all acidic protons is
\[
\begin{aligned}
n_{\text{total acid}}
&=(0.1000)(0.02200)\\
&=2.200\times10^{-3}\ \text{mol}
\end{aligned}
\]
Therefore the amount attributable to \(\ce{HA}\) is
\[
\begin{aligned}
n(\ce{HA})
&=2.200\times10^{-3}-6.00\times10^{-4}\\
&=1.600\times10^{-3}\ \text{mol}
\end{aligned}
\]
and
\[
\begin{aligned}
c(\ce{HA})
&=\frac{1.600\times10^{-3}}{0.02000}\\
&=0.0800\ \text{mol L}^{-1}
\end{aligned}
\]
Now consider the weak acid’s half-equivalence point.
Its neutralisation starts, in this idealised interpretation, after the strong-acid requirement represented by the first \(6.00\ \text{mL}\) has been accounted for. It is complete at \(22.00\ \text{mL}\).
The weak-acid neutralisation interval is therefore
\[
22.00-6.00=16.00\ \text{mL}
\]
Half of that interval is
\[
8.00\ \text{mL}
\]
past the first breakpoint:
\[
6.00+8.00=14.00\ \text{mL}
\]
At \(14.00\ \text{mL}\),
\[
[\ce{HA}]=[\mathrm{A}^{-}]
\]
so
\[
\text{pH}=\text{p}K_a=4.80
\]
Therefore
\[
\begin{aligned}
K_a
&=10^{-4.80}\\
&=1.58\times10^{-5}
\end{aligned}
\]
The tempting answer is \(11.00\ \text{mL}\), because \(11.00\ \text{mL}\) is half of the final \(22.00\ \text{mL}\) equivalence volume.
That ignores the strong acid.
At \(11.00\ \text{mL}\), the first \(6.00\ \text{mL}\) of base requirement has already been assigned to the \(\ce{HCl}\) component. Only
\[
11.00-6.00=5.00\ \text{mL}
\]
of the \(16.00\ \text{mL}\) required for \(\ce{HA}\) has been supplied. The weak acid is therefore nowhere near its own half-neutralisation point.
The conductivity regions now follow from the same bookkeeping.
From \(0\) to \(6.00\ \text{mL}\), highly mobile \(\ce{H3O+}\) associated mainly with the strong-acid component is being removed. It is replaced by less mobile \(\mathrm{Na}^{+}\), and the solution is diluted, so conductivity falls sharply.
From \(6.00\) to \(22.00\ \text{mL}\), added base converts mostly neutral weak acid into its ionic salt:
\[
\ce{HA + OH- -> A- + H2O}
\]
The amounts of \(\mathrm{Na}^{+}\) and \(\mathrm{A}^{-}\) increase, so conductivity rises gently.
After \(22.00\ \text{mL}\), all stoichiometrically available acid has been neutralised. Additional \(\ce{NaOH}\) leaves excess \(\ce{OH-}\), a highly effective charge carrier, so the conductivity rises more steeply.
The deeper point is that neither breakpoint tells the whole story by itself. The first conductivity minimum does not represent complete neutralisation of every acid in the flask, while the final equivalence volume cannot be halved blindly to locate the weak acid’s half-equivalence point. You have to track which reaction each interval of titrant is actually completing.
That same reasoning is what makes digital pH and conductivity data useful rather than just decorative graphs: each measurement constrains a different part of the chemical model. The next useful step is learning how probe resolution, calibration, and data spacing affect how confidently those turning points can be located, which is covered in Digital Probes for Acid-Base Analysis in HSC Chemistry.