
Energy Profile Diagrams for HSC Chemistry: How to Read Them
Learn how to construct and interpret energy profile diagrams, including enthalpy change, activation energy, reaction direction, and catalysts.
Suppose two reactions both release 50 kJ mol\(^{-1}\). One can happen quickly once the reactants meet. The other barely reacts unless you heat it or add a catalyst. If their overall energy changes are the same, why can their rates be so different?
Before reading on, make a prediction: if the products sit much lower in energy than the reactants, must the reaction be fast?
No. The drop from reactants to products tells you the overall enthalpy change, \(\Delta H\). Reaction rate depends strongly on a different vertical gap: the activation energy, \(E_a\). An energy profile diagram lets you see both at once.
01What an energy profile is actually showing
Picture two car parks separated by a hill.
The first car park is the reactants. The second is the products. Their difference in altitude represents the reaction’s enthalpy change. The top of the hill represents the highest-energy arrangement the reacting particles must pass through.
To get from the first car park to the second, the car has to climb before it can come down. Even if the second car park is much lower, the car still needs enough energy to reach the top.
That climb is the activation energy.
The analogy is useful, but it has a limit. Molecules aren’t literally travelling over a hill in space. The horizontal axis is an abstract measure of how far the chemical change has progressed.
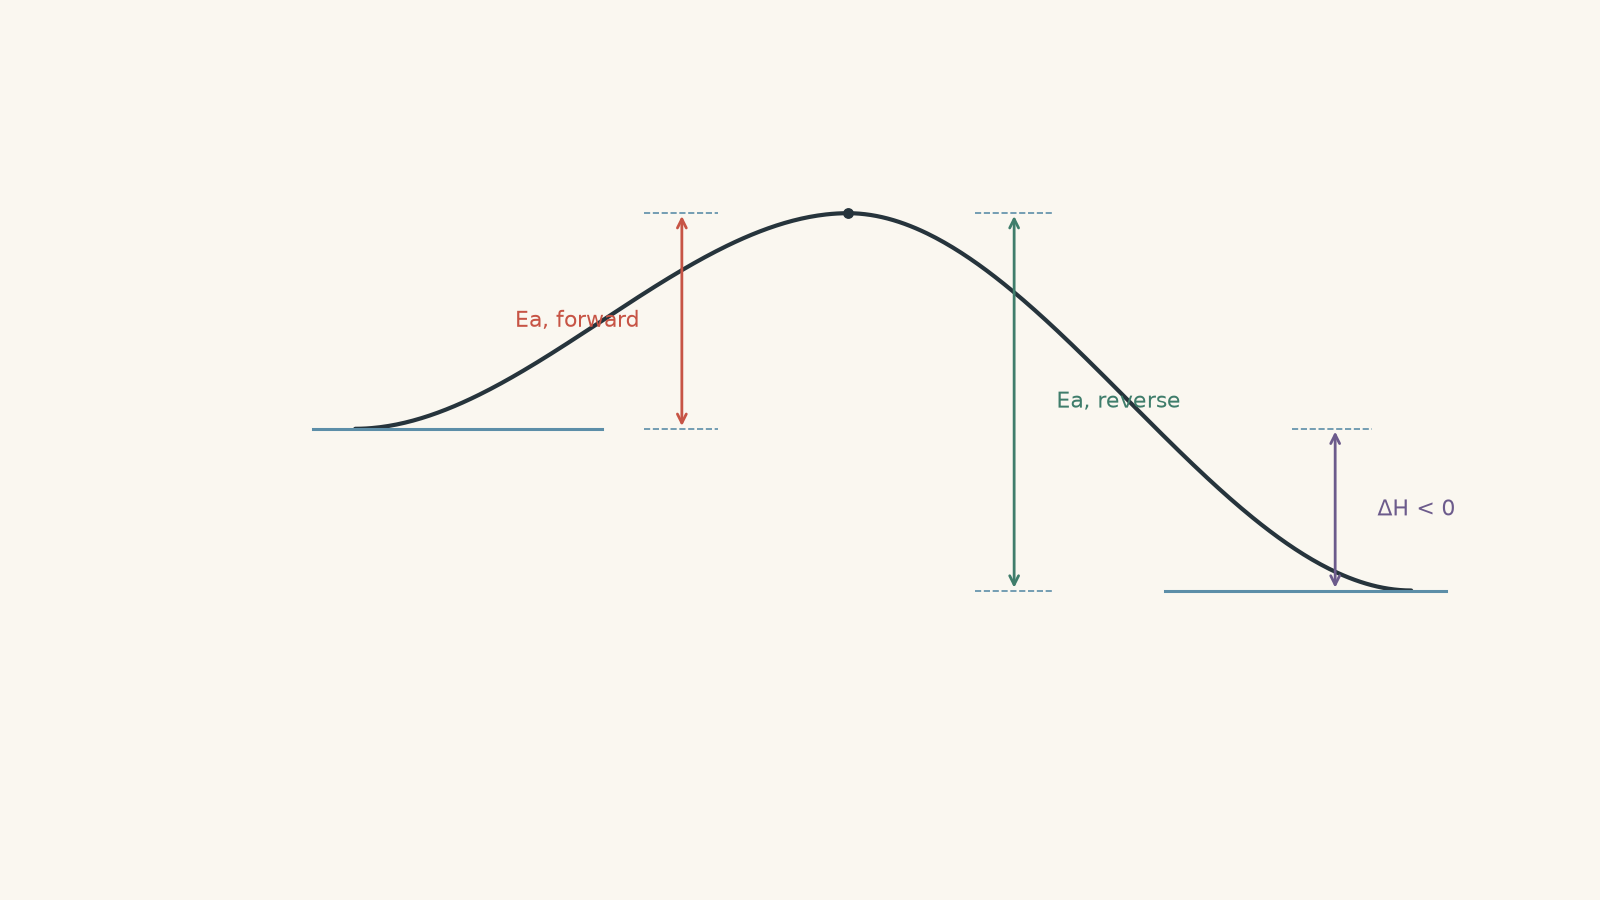
A basic energy profile therefore has:
| Feature | What it means |
|---|---|
| Reactant level | Enthalpy of the starting substances |
| Product level | Enthalpy of the substances formed |
| Peak | Highest-energy point along the reaction pathway |
| \(E_a\) | Energy barrier from the starting level to the peak |
| \(\Delta H\) | Difference between product and reactant enthalpy |
| Horizontal axis | Reaction progress, not time |
That last point causes plenty of trouble. A long horizontal curve does not mean the reaction takes a long time. The horizontal distance has no direct time scale.
02Read the vertical gaps, not the shape of the curve
For a reaction written in the forward direction,
\[
\text{reactants} \rightarrow \text{products}
\]
the enthalpy change is
\[
\Delta H = H_{\text{products}} – H_{\text{reactants}}
\]
where \(H_{\text{products}}\) and \(H_{\text{reactants}}\) are the enthalpies of the products and reactants, usually expressed in kJ mol\(^{-1}\).
If the products are lower than the reactants,
\[
\Delta H < 0
\]
so the reaction is exothermic.
If the products are higher,
\[
\Delta H > 0
\]
so the reaction is endothermic.
If that sign convention is still feeling backwards, review Endothermic and Exothermic Reactions for HSC Chemistry before going further.
Now add the peak. Let \(H_{\text{peak}}\) be the enthalpy at the highest point of a simple one-step pathway.
The forward activation energy is
\[
E_{a,\text{forward}} = H_{\text{peak}} – H_{\text{reactants}}
\]
The reverse activation energy is
\[
E_{a,\text{reverse}} = H_{\text{peak}} – H_{\text{products}}
\]
Notice that both activation energies reach the same peak. What changes is where you start measuring.
This gives a very useful relationship:
\[
\begin{aligned}
E_{a,\text{forward}}-E_{a,\text{reverse}}
&=(H_{\text{peak}}-H_{\text{reactants}})
-(H_{\text{peak}}-H_{\text{products}})\\
&=H_{\text{products}}-H_{\text{reactants}}\\
&=\Delta H
\end{aligned}
\]
So
\[
E_{a,\text{forward}}-E_{a,\text{reverse}}=\Delta H
\]
You do not need to memorise that as an isolated formula. It follows directly from the three vertical levels.
Worked example: Reading an exothermic profile
A reaction has a reactant enthalpy of 160 kJ mol\(^{-1}\), a product enthalpy of 95 kJ mol\(^{-1}\), and a peak at 230 kJ mol\(^{-1}\). Calculate \(\Delta H\), the forward activation energy, and the reverse activation energy.
Step 1
\[
\Delta H = H_{\text{products}}-H_{\text{reactants}}
=95-160
=-65\text{ kJ mol}^{-1}
\]
The negative sign means the forward reaction is exothermic.
Step 2
\[
E_{a,\text{forward}}
=230-160
=70\text{ kJ mol}^{-1}
\]
Step 3
\[
E_{a,\text{reverse}}
=230-95
=135\text{ kJ mol}^{-1}
\]
Step 4
\[
70-135=-65\text{ kJ mol}^{-1}
\]
That matches \(\Delta H\).
The important result is not just that the forward reaction releases 65 kJ mol\(^{-1}\). Particles still need to overcome a 70 kJ mol\(^{-1}\) barrier before that lower-energy product state can be reached.
03How to construct an energy profile from information
Suppose an exam question gives you \(\Delta H\) and \(E_a\), but no diagram. Build the profile in a fixed order.
First, decide which direction the question is describing. If it writes \(\ce{A -> B}\), then A is your reactant side and B is your product side.
Next, place the reactants at any convenient vertical level unless actual enthalpy values are supplied. The absolute height often doesn’t matter. The differences do.
Then place the products:
- below the reactants if \(\Delta H<0\),
- above the reactants if \(\Delta H>0\).
Draw a curve rising to a peak above the reactant level and product level.
Finally, label \(E_a\) from the starting level to the peak and \(\Delta H\) between the reactant and product levels.
A common mistake is to draw an exothermic reaction as a smooth downhill slide. That misses the reason activation energy exists. Even an exothermic reaction normally has to pass through a higher-energy arrangement first.
04Turning the reaction around
Now imagine the same profile, but the reaction runs backwards.
Nothing physical has been flipped vertically. The products of the forward reaction simply become the reactants of the reverse reaction.
For an exothermic forward reaction, the reverse reaction is endothermic.
For example, if
\[
\Delta H_{\text{forward}}=-40\text{ kJ mol}^{-1}
\]
then
\[
\Delta H_{\text{reverse}}=+40\text{ kJ mol}^{-1}
\]
The activation energy changes too because the reverse reaction starts from a different enthalpy level.
Try predicting this before continuing. For an exothermic forward reaction, which should be larger: \(E_{a,\text{forward}}\) or \(E_{a,\text{reverse}}\)?
The reverse activation energy is larger. The products of the exothermic forward reaction are lower, so the reverse reaction has further to climb to reach the same peak.
For an endothermic forward reaction, the opposite is true.
Worked example: Adding a catalyst and reading both directions
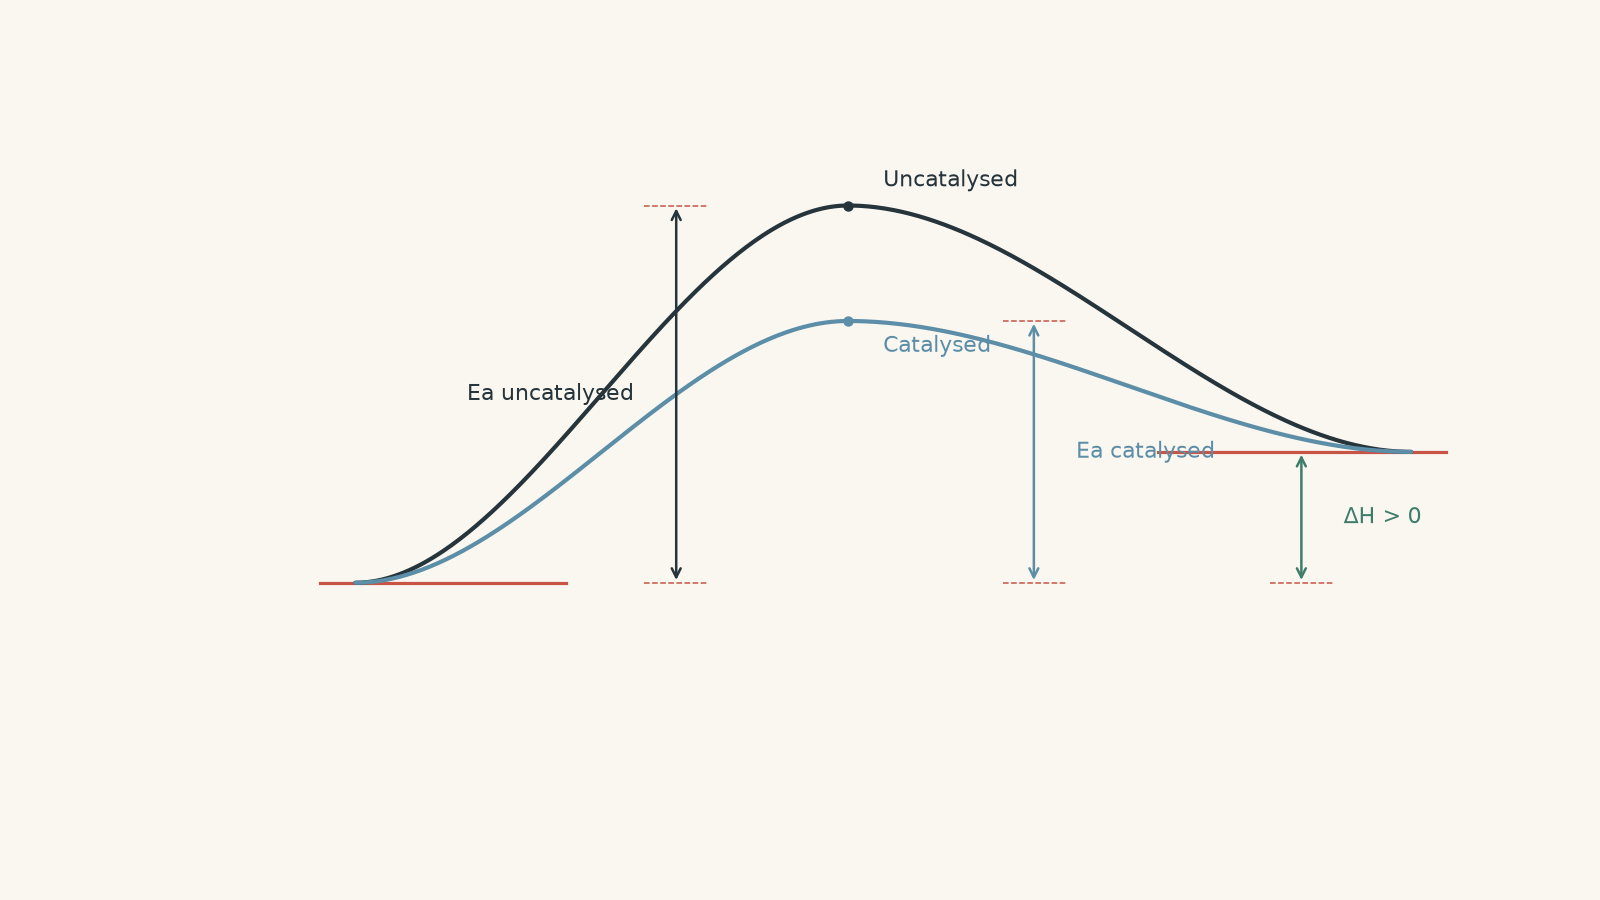
For the forward reaction \(\ce{A -> B}\), A has an enthalpy of 75 kJ mol\(^{-1}\) and B has an enthalpy of 130 kJ mol\(^{-1}\). The uncatalysed pathway peaks at 215 kJ mol\(^{-1}\). A catalyst provides another pathway whose peak is 170 kJ mol\(^{-1}\).
Calculate \(\Delta H\), and the forward and reverse activation energies for both pathways.
Step 1
\[
\Delta H=130-75=+55\text{ kJ mol}^{-1}
\]
The forward reaction is endothermic.
Step 2
\[
E_{a,\text{forward}}
=215-75
=140\text{ kJ mol}^{-1}
\]
Step 3
\[
E_{a,\text{reverse}}
=215-130
=85\text{ kJ mol}^{-1}
\]
Step 4
\[
\begin{aligned}
E_{a,\text{forward,catalysed}}&=170-75=95\text{ kJ mol}^{-1}\\
E_{a,\text{reverse,catalysed}}&=170-130=40\text{ kJ mol}^{-1}
\end{aligned}
\]
Step 5
The catalyst lowered the peak by 45 kJ mol\(^{-1}\). It therefore lowered both activation energies by 45 kJ mol\(^{-1}\).
It did not change the reactant or product enthalpies, so
\[
\Delta H=+55\text{ kJ mol}^{-1}
\]
for both pathways.
That is exactly what a catalyst should do: provide a different route between the same chemical starting and finishing states.
05What a catalyst changes – and what it cannot change
A catalyst changes the pathway.
On an energy profile, that appears as a lower activation barrier.
It does not magically make the products lower in enthalpy. The reactants and products are still the same substances, so their enthalpy difference is unchanged.
For a simple one-peak diagram:
| Quantity | Changed by a catalyst? |
|---|---|
| Reactant enthalpy | No |
| Product enthalpy | No |
| \(\Delta H\) | No |
| Reaction pathway | Yes |
| Peak height | Yes |
| Forward \(E_a\) | Yes |
| Reverse \(E_a\) | Yes |
You can picture a catalyst as finding a lower mountain pass. The towns at either end haven’t moved; you’ve just found an easier route between them.
Where does this analogy fail? A chemical catalyst works through molecular interactions and usually a different reaction mechanism. It does not physically carve away stored energy from some pre-existing hill.
06Heating is not the same as lowering activation energy
Here is another prediction worth making.
If heating a reaction makes more particles able to react, should you redraw the energy profile with a lower peak?
No.
Heating gives particles a different distribution of kinetic energies. A larger fraction of collisions can now overcome the existing activation-energy barrier.
The activation energy itself has not been lowered merely because the mixture is hotter.
A catalyst changes the pathway and therefore changes \(E_a\). Increasing temperature changes how many particles have enough energy to overcome \(E_a\).
Those are different mechanisms, even though both can make a reaction faster.
07The most tempting energy-profile mistakes
“The products are much lower, so the reaction must be fast”
This feels reasonable because the reaction seems to have a strong energetic reason to go downhill.
But \(\Delta H\) and \(E_a\) answer different questions.
\(\Delta H\) compares the beginning and end. \(E_a\) describes the barrier that must be crossed on the way.
A strongly exothermic reaction can still have a large activation energy and proceed very slowly under ordinary conditions.
“The drop from the peak to the products is the energy released”
Not quite.
For a simple forward exothermic profile, the drop from the peak to the products is larger than the net enthalpy change because the reacting system first had to climb from the reactants to the peak.
The overall enthalpy change is always the difference between products and reactants:
\[
\Delta H=H_{\text{products}}-H_{\text{reactants}}
\]
Do not calculate \(\Delta H\) using the peak.
“Activation energy is always the arrow drawn from the left”
Only if the left side contains the reactants for the reaction being discussed.
If you reverse the reaction, your starting substances change. Activation energy is measured from the starting level to the relevant peak.
“A catalyst changes \(\Delta H\) because it lowers the diagram”
A catalyst lowers the pathway, not the endpoints.
If your catalysed diagram has different reactant or product levels from the uncatalysed diagram for the same reaction, something has gone wrong.
“The horizontal axis is time”
It isn’t.
Reaction progress tells you how the molecular arrangement changes between reactants and products. A profile does not show how many seconds have passed.
08Questions and solutions
Question 1
An energy profile has reactants at 120 kJ mol\(^{-1}\), products at 75 kJ mol\(^{-1}\), and a peak at 185 kJ mol\(^{-1}\).
Calculate:
a. \(\Delta H\) for the forward reaction
b. the forward activation energy
c. the reverse activation energy
d. whether the forward reaction is endothermic or exothermic.
Solution 1
The forward reaction is exothermic, with \(\Delta H=-45\) kJ mol\(^{-1}\), \(E_{a,\text{forward}}=65\) kJ mol\(^{-1}\), and \(E_{a,\text{reverse}}=110\) kJ mol\(^{-1}\).
For the enthalpy change,
\[
\Delta H
=H_{\text{products}}-H_{\text{reactants}}
=75-120
=-45\text{ kJ mol}^{-1}
\]
For the forward activation energy,
\[
E_{a,\text{forward}}
=185-120
=65\text{ kJ mol}^{-1}
\]
For the reverse activation energy,
\[
E_{a,\text{reverse}}
=185-75
=110\text{ kJ mol}^{-1}
\]
The negative \(\Delta H\) confirms that the forward reaction is exothermic.
A tempting mistake is to use \(185-75=110\) kJ mol\(^{-1}\) as the forward activation energy simply because it is the larger gap. Activation energy must be measured from the substances that are actually starting the reaction. For the forward reaction, those are the reactants at 120 kJ mol\(^{-1}\).
Question 2
For the forward reaction \(\ce{A -> B}\),
\[
\Delta H=-62\text{ kJ mol}^{-1}
\]
The activation energy for the reverse reaction, \(\ce{B -> A}\), is 138 kJ mol\(^{-1}\).
Take the enthalpy of A to be 0 kJ mol\(^{-1}\).
Determine:
a. the enthalpy of B
b. the enthalpy of the peak
c. the forward activation energy
d. where the activation-energy arrow must begin if the diagram is being interpreted for the reverse reaction.
Solution 2
B lies at \(-62\) kJ mol\(^{-1}\), the peak lies at \(76\) kJ mol\(^{-1}\), the forward activation energy is \(76\) kJ mol\(^{-1}\), and the reverse activation-energy arrow must begin at B.
Because
\[
\Delta H=H_B-H_A
\]
and \(H_A=0\),
\[
-62=H_B-0
\]
so
\[
H_B=-62\text{ kJ mol}^{-1}
\]
The reverse reaction begins at B. Its activation energy is 138 kJ mol\(^{-1}\), so the peak is
\[
H_{\text{peak}}
=-62+138
=76\text{ kJ mol}^{-1}
\]
The forward reaction starts from A at 0 kJ mol\(^{-1}\), giving
\[
E_{a,\text{forward}}
=76-0
=76\text{ kJ mol}^{-1}
\]
You can check this using
\[
E_{a,\text{forward}}-E_{a,\text{reverse}}
=76-138
=-62\text{ kJ mol}^{-1}
\]
which matches \(\Delta H\).
The tempting route is to calculate \(138+62=200\) kJ mol\(^{-1}\). That treats the reverse barrier as though it starts above the forward reactants. It does not. The reverse reaction starts 62 kJ mol\(^{-1}\) lower, so it has a longer climb to the same peak.
Question 3
A forward reaction has
\[
\Delta H=+35\text{ kJ mol}^{-1}
\]
and an uncatalysed forward activation energy of 90 kJ mol\(^{-1}\).
A student makes two claims:
- Heating the reaction lowers its activation energy because more collisions become successful.
- A catalyst that lowers the forward activation energy to 60 kJ mol\(^{-1}\) must also lower the reverse activation energy.
Calculate the uncatalysed and catalysed reverse activation energies, and evaluate both claims.
Solution 3
The uncatalysed reverse activation energy is 55 kJ mol\(^{-1}\), the catalysed reverse activation energy is 25 kJ mol\(^{-1}\), claim 1 is incorrect, and claim 2 is correct.
For the uncatalysed pathway,
\[
E_{a,\text{forward}}-E_{a,\text{reverse}}=\Delta H
\]
so
\[
90-E_{a,\text{reverse}}=35
\]
giving
\[
E_{a,\text{reverse}}=55\text{ kJ mol}^{-1}
\]
For the catalysed pathway, \(\Delta H\) is still \(+35\) kJ mol\(^{-1}\) because a catalyst does not change the reactant or product enthalpies.
Therefore,
\[
60-E_{a,\text{reverse,catalysed}}=35
\]
and
\[
E_{a,\text{reverse,catalysed}}
=25\text{ kJ mol}^{-1}
\]
Claim 1 confuses particle energy with activation energy. Heating increases the fraction of particles whose collisions have enough energy to overcome the barrier. In the usual HSC model, it does not lower the barrier itself.
Claim 2 is correct because the catalyst supplies a different pathway connecting the same reactants and products. If the peak falls while both endpoint levels remain fixed, the vertical gap from either side to that peak becomes smaller.
A plausible wrong approach is to change \(\Delta H\) as well as \(E_a\). That would mean the catalyst had changed the relative enthalpies of the reactants and products, which is not what a catalyst does.
Question 4
For the forward reaction \(\ce{A -> B}\),
\[
\Delta H=-48\text{ kJ mol}^{-1}
\]
and the uncatalysed reverse activation energy is 122 kJ mol\(^{-1}\).
A catalyst lowers the transition-state enthalpy by 37 kJ mol\(^{-1}\), while leaving A and B unchanged.
A student then redraws the reaction in the reverse direction, \(\ce{B -> A}\), and makes two choices:
- they keep the enthalpy change labelled \(-48\) kJ mol\(^{-1}\);
- they draw the reverse activation-energy arrow from the A level to the catalysed peak.
Determine:
a. the uncatalysed forward activation energy
b. the catalysed forward activation energy
c. the catalysed reverse activation energy
d. the correct \(\Delta H\) for \(\ce{B -> A}\)
e. both errors in the student’s reverse diagram.
Solution 4
The uncatalysed forward activation energy is 74 kJ mol\(^{-1}\), the catalysed forward activation energy is 37 kJ mol\(^{-1}\), the catalysed reverse activation energy is 85 kJ mol\(^{-1}\), and the reverse reaction has \(\Delta H=+48\) kJ mol\(^{-1}\). Both of the student’s labels are wrong.
For the uncatalysed reaction,
\[
E_{a,\text{forward}}-E_{a,\text{reverse}}=\Delta H
\]
so
\[
E_{a,\text{forward}}-122=-48
\]
and therefore
\[
E_{a,\text{forward}}
=74\text{ kJ mol}^{-1}
\]
It helps to assign convenient relative enthalpies. Let
\[
H_A=0\text{ kJ mol}^{-1}
\]
Then
\[
H_B=-48\text{ kJ mol}^{-1}
\]
and the uncatalysed peak must be at
\[
H_{\text{peak}}=74\text{ kJ mol}^{-1}
\]
The catalyst lowers that peak by 37 kJ mol\(^{-1}\):
\[
H_{\text{peak,catalysed}}
=74-37
=37\text{ kJ mol}^{-1}
\]
So the catalysed forward barrier is
\[
E_{a,\text{forward,catalysed}}
=37-0
=37\text{ kJ mol}^{-1}
\]
For the reverse reaction, the starting level is B at \(-48\) kJ mol\(^{-1}\). Therefore,
\[
E_{a,\text{reverse,catalysed}}
=37-(-48)
=85\text{ kJ mol}^{-1}
\]
Reversing a reaction reverses the sign of its enthalpy change:
\[
\Delta H_{\ce{B -> A}}
=+48\text{ kJ mol}^{-1}
\]
The student’s first error is keeping \(\Delta H=-48\) kJ mol\(^{-1}\). That value belongs to \(\ce{A -> B}\), not \(\ce{B -> A}\).
The second error is starting the reverse \(E_a\) arrow from A. Activation energy is measured from the substances that are starting the stated reaction. For \(\ce{B -> A}\), that means the arrow begins at the B level.
The tempting shortcut is to mentally “flip the picture” when the equation is reversed. The vertical energy levels do not flip. Only the roles of reactants and products swap.
Question 5
A reaction occurs through two elementary steps with an intermediate, I. All enthalpies below are measured relative to the same arbitrary zero:
- reactants R: \(+10\) kJ mol\(^{-1}\)
- first transition-state peak: \(+70\) kJ mol\(^{-1}\)
- intermediate I: \(-15\) kJ mol\(^{-1}\)
- second transition-state peak: \(+60\) kJ mol\(^{-1}\)
- products P: \(-35\) kJ mol\(^{-1}\)
Assume each peak belongs to the elementary step immediately beside it.
Determine:
a. the overall \(\Delta H\) for \(\ce{R -> P}\)
b. the activation energy of each forward elementary step
c. which forward step has the larger activation energy
d. the activation energy for the first elementary step encountered when the reaction runs in reverse from P
e. whether lowering only the first peak from \(+70\) to \(+50\) kJ mol\(^{-1}\) necessarily removes the largest forward activation barrier.
Solution 5
The overall reaction has \(\Delta H=-45\) kJ mol\(^{-1}\); the two forward activation energies are 60 and 75 kJ mol\(^{-1}\); the second forward step has the larger barrier; the first reverse barrier is 95 kJ mol\(^{-1}\); and lowering only the first peak does not remove the largest forward barrier.
The overall enthalpy change ignores the intermediate and compares only the initial reactants with the final products:
\[
\Delta H
=H_P-H_R
=-35-(+10)
=-45\text{ kJ mol}^{-1}
\]
For the first forward elementary step, the system starts at R and climbs to the first peak:
\[
E_{a,1}
=70-10
=60\text{ kJ mol}^{-1}
\]
For the second forward elementary step, the system does not start again from R. It starts from the intermediate at \(-15\) kJ mol\(^{-1}\):
\[
E_{a,2}
=60-(-15)
=75\text{ kJ mol}^{-1}
\]
So the second step has the larger forward activation energy even though its peak, at \(+60\) kJ mol\(^{-1}\), is lower on the page than the first peak at \(+70\) kJ mol\(^{-1}\).
That is the hinge in the problem. Activation energy is a vertical difference from the starting state of a particular step. It is not simply “the height of the tallest peak above zero”.
Running the process backwards from P, the first peak encountered is the second transition state at \(+60\) kJ mol\(^{-1}\). Starting from P at \(-35\) kJ mol\(^{-1}\),
\[
E_{a,\text{first reverse step}}
=60-(-35)
=95\text{ kJ mol}^{-1}
\]
Now lower only the first peak from \(+70\) to \(+50\) kJ mol\(^{-1}\). The first forward barrier becomes
\[
50-10=40\text{ kJ mol}^{-1}
\]
but the second barrier remains
\[
60-(-15)=75\text{ kJ mol}^{-1}
\]
So the largest forward barrier is still 75 kJ mol\(^{-1}\).
The tempting answer is to identify \(+70\) kJ mol\(^{-1}\) as the important barrier simply because it is the highest point on the original diagram. That works for a simple one-step profile measured from one reactant level, but it fails once an intermediate creates a new starting level for the next elementary step.
That same idea is what makes more complicated reaction mechanisms readable: every peak matters relative to the valley immediately before it, while the overall \(\Delta H\) still depends only on the original reactants and final products.