
Classifying Stars with Stellar Spectra: HSC Physics Guide
Learn how stellar spectra reveal a star’s temperature and spectral class, and why absorption-line strength depends on excitation and ionisation as well as composition.
A star can look almost featureless through a telescope: just a point of light. Yet from that light alone, astronomers can tell that one star is much hotter than another and place it into a spectral class.
Here is the puzzle. Suppose two stars both contain hydrogen. One shows very strong hydrogen absorption lines, while the hotter star shows much weaker hydrogen lines. Which star contains more hydrogen?
It is tempting to say the first one. That prediction is not reliable. The strength of a spectral line depends not only on what elements are present, but also on the temperature of the star and the energy states of its atoms.
That is the key to stellar classification: a spectrum is not just a list of ingredients. It is a record of how matter and radiation are interacting in the star’s atmosphere.
01What a stellar spectrum actually shows
Imagine spreading a star’s light out by wavelength using a spectroscope. Instead of one white point, you obtain a spectrum.
For many stars, the spectrum has two important features:
- a broad continuous range of wavelengths, called the continuum
- narrow dark lines at particular wavelengths, called absorption lines
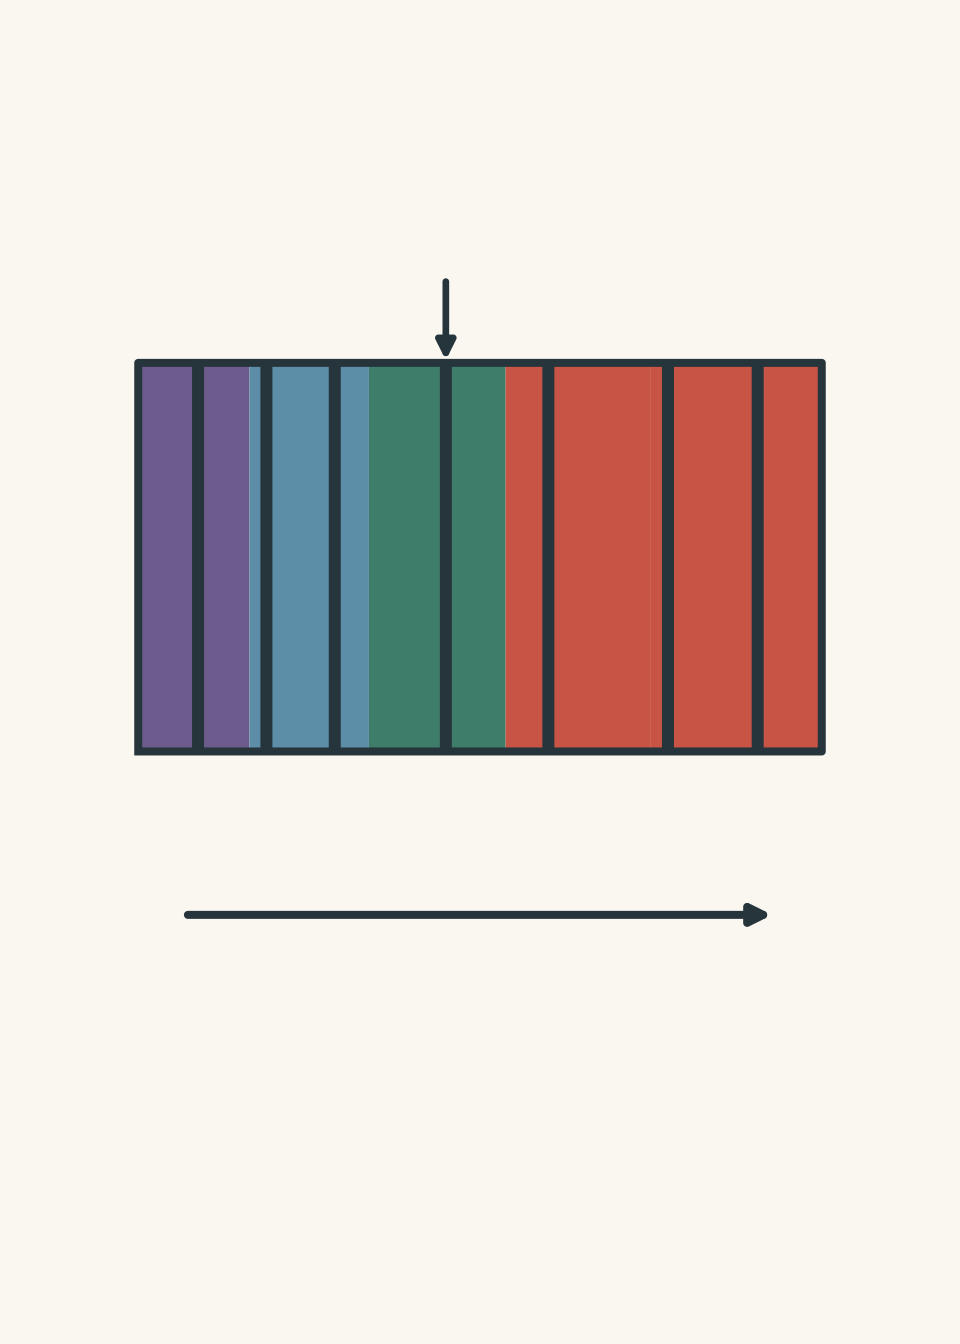
Why are there dark lines?
A useful first model is to picture light from the hot, dense interior of the star travelling outward through a cooler layer of gas. Atoms in that cooler atmosphere absorb photons of particular energies. Those energies correspond to particular changes between allowed electron energy levels.
Because photon energy is related to frequency by
\[ E = hf \]
where \(E\) is photon energy in joules, \(h\) is Planck’s constant in joule seconds, and \(f\) is frequency in hertz, an atom cannot absorb just any photon. It absorbs photons whose energies match allowed electron transitions.
That removes some light at particular wavelengths from the beam heading towards us, producing dark absorption lines.
This model is useful, but slightly simplified. The absorbed photons are often re-emitted in other directions rather than simply disappearing. The line appears dark because less radiation at that wavelength reaches us directly from the stellar disc.
02Each element leaves a recognisable pattern
Suppose you saw three dark lines in a stellar spectrum. How could you tell whether they came from hydrogen, helium, calcium, or something else?
Not from the darkness of one line alone. Instead, you compare the pattern of wavelengths with known atomic spectra measured in laboratories.
Each element has its own set of allowed electron energy levels. That gives it a characteristic set of spectral lines, rather like a barcode.
The barcode analogy is useful, with one warning. A supermarket barcode is essentially fixed. A star’s spectral pattern is more complicated because temperature affects which atomic energy states are populated and whether atoms are neutral or ionised.
So astronomers ask two related questions:
- Which spectral lines are present?
- How strong are those lines relative to one another?
Those features allow stars to be sorted into spectral classes.
03The spectral classes: O, B, A, F, G, K, M
The main stellar spectral sequence is
O, B, A, F, G, K, M
and the sequence runs from hottest to coolest.
| Spectral class | Approximate surface temperature | Important spectral features |
|---|---|---|
| O | above about 30,000 K | Ionised helium prominent; hydrogen relatively weak |
| B | about 10,000-30,000 K | Neutral helium visible; hydrogen becomes stronger |
| A | about 7,500-10,000 K | Hydrogen absorption strongest |
| F | about 6,000-7,500 K | Hydrogen weaker; ionised metals increasingly important |
| G | about 5,200-6,000 K | Metal lines prominent; hydrogen weaker |
| K | about 3,700-5,200 K | Strong neutral-metal lines |
| M | below about 3,700 K | Molecular bands become important, especially in cooler stars |
These boundaries are approximate. Each main class is divided into subclasses from 0 to 9. For example, a G2 star is slightly hotter than a G8 star.
The Sun is approximately spectral class G2.
The order can feel annoyingly random. That is because the letters were inherited from an older classification system that was reorganised once astronomers understood that temperature was the main physical variable behind the sequence.
For an HSC question, the important physics is not memorising a cute sentence for OBAFGKM. It is understanding why different temperatures produce different spectral features.
04Why hydrogen lines are strongest in A-type stars
This is the part that catches students.
You might predict that the hottest stars should have the strongest hydrogen absorption lines. Hotter atoms have more energy, so perhaps they should absorb more radiation.
But hydrogen absorption lines in the visible region become strongest around A-type stellar temperatures, not in the hottest O-type stars.
Why?
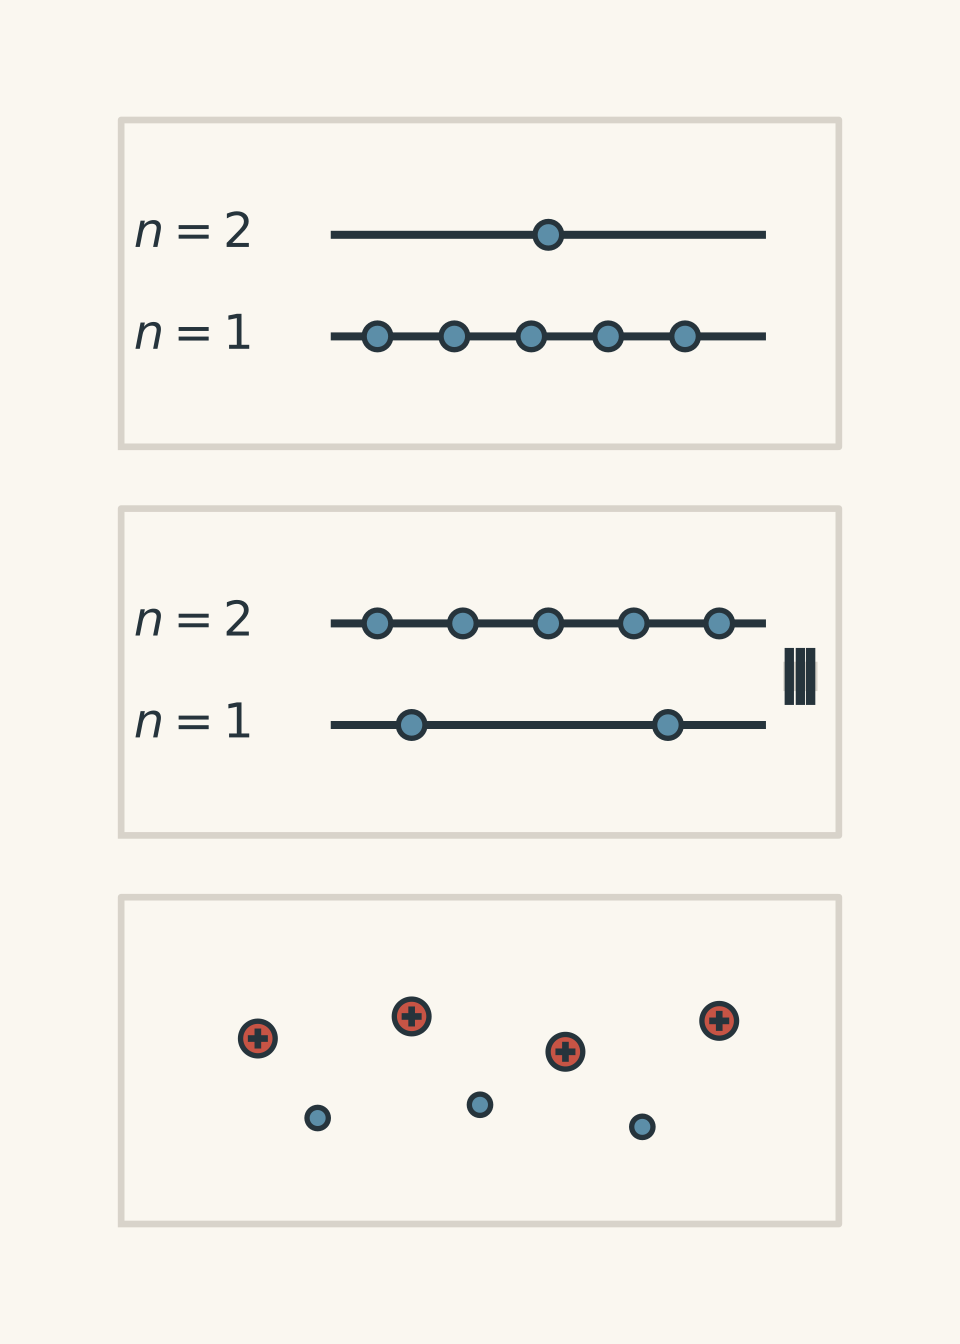
Consider the Balmer series of hydrogen. These visible absorption lines involve electrons that begin in the \(n=2\) energy level.
For a Balmer photon to be absorbed, there must already be a hydrogen atom with an electron in \(n=2\).
That creates three regimes.
At relatively low temperatures
Most hydrogen atoms are in their ground state, \(n=1\).
There are plenty of neutral hydrogen atoms, but relatively few electrons are sitting in \(n=2\). Therefore, visible Balmer absorption is not especially strong.
At intermediate temperatures
More hydrogen atoms have electrons excited into \(n=2\).
Now there are many atoms capable of absorbing Balmer-series photons, so the hydrogen absorption lines become strong. This occurs most prominently in A-type stars.
At very high temperatures
The situation changes again. Hydrogen atoms become increasingly ionised.
An ionised hydrogen atom has lost its electron. No bound electron means no Balmer transition.
So an extremely hot star can contain plenty of hydrogen and still show weaker neutral-hydrogen absorption lines.
This is the main misconception to kill off:
A stronger absorption line does not automatically mean there is more of that element.
Line strength depends on abundance, but also on excitation and ionisation.
It is a bit like trying to judge how many people are at a party by counting how many are currently on the dance floor. A nearly empty dance floor might mean there are few guests. Or it might mean everyone is eating pizza in the kitchen. The number you see in one particular state is not the same as the total population.
The analogy breaks because atoms occupy quantised energy states according to physical laws rather than deciding where to hang out. But the useful idea is the same: you must distinguish total population from population in the particular state you are measuring.
05Worked example: identifying a likely spectral class
A star has a surface temperature of approximately \(9.0\times10^3\ \text{K}\). Its spectrum shows very strong hydrogen Balmer absorption lines but relatively weak helium lines. Which main spectral class is most likely?
Step 1
A temperature of \(9.0\times10^3\ \text{K}\) lies roughly in the A-star range of about \(7.5\times10^3\) to \(1.0\times10^4\ \text{K}\).
Step 2
A-type stars are characterised by particularly strong Balmer absorption because a large fraction of neutral hydrogen atoms have electrons in the \(n=2\) state.
Step 3
The star is most likely an A-type star.
The important point is that we did not classify it using temperature alone. The temperature and the absorption pattern tell the same physical story.
06Temperature also affects the continuum
Absorption lines are not the only clue. A star’s continuum approximately resembles blackbody radiation.
For an approximate blackbody, Wien’s displacement law gives
\[ \lambda_{\text{max}}T = b \]
where \(\lambda_{\text{max}}\) is the wavelength of maximum intensity in metres, \(T\) is absolute temperature in kelvin, and \(b\) is Wien’s displacement constant,
\[ b \approx 2.90\times10^{-3}\ \text{m K}. \]
A hotter star has a shorter peak wavelength.
That gives us an independent way to estimate surface temperature and check whether the absorption features make sense.
Worked example: combining the continuum and spectral lines
A star’s continuum peaks at a wavelength of \(4.0\times10^{-7}\ \text{m}\). Its spectrum contains strong hydrogen Balmer lines and weak helium lines. Estimate its surface temperature and identify a likely spectral class.
Step 1
\[ \lambda_{\text{max}}T=b \]
so
\[ T=\frac{b}{\lambda_{\text{max}}}. \]
Step 2
\[ T =\frac{2.90\times10^{-3}\ \text{m K}} {4.0\times10^{-7}\ \text{m}} =7.25\times10^3\ \text{K}. \]
The metre units cancel, leaving kelvin.
Step 3
A temperature of about \(7.3\times10^3\ \text{K}\) is near the boundary between A and F spectral types.
Step 4
Strong Balmer absorption is characteristic of A-type stars, while hydrogen lines weaken progressively through F-type stars.
The evidence therefore suggests a star near the cool end of the A spectral class, although a precise subclass would require more detailed spectral comparison.
The calculation does more than produce a temperature. It lets us check whether two independent pieces of evidence – the continuum and the absorption spectrum – agree.
07Why hotter does not simply mean “more energetic lines”
There is another tempting model that needs tightening.
You may think that as temperature increases, every spectral line should just get stronger. That would be reasonable if heating only increased excitation.
But heating can do two different things:
- excite bound electrons into higher energy levels
- ionise atoms completely by removing electrons
At first, rising temperature may increase the number of atoms in the state needed for a particular absorption transition. At still higher temperatures, ionisation can reduce that population.
This is why spectral classification depends on patterns of lines, not a simple rule such as “stronger lines mean hotter star”.
Helium provides a useful example. Neutral helium lines become important in hot B-type stars. In even hotter O-type stars, ionised helium becomes important because the thermal conditions are energetic enough to remove electrons from helium atoms.
At the cool end of the sequence, molecules can survive in stellar atmospheres. That is why molecular absorption bands become noticeable in M-type spectra. At the temperature of an O-type atmosphere, those molecules would not remain intact.
08Classification is about temperature, not visible colour alone
Spectral class is strongly linked to surface temperature.
Broadly:
- O and B stars are very hot and appear blue or blue-white.
- A and F stars appear white to yellow-white.
- G stars, including the Sun, are yellowish-white.
- K stars appear more orange.
- M stars are coolest and appear redder.
But colour by itself is a rough tool. Interstellar dust can alter the observed colour, and human colour descriptions are imprecise.
Spectroscopy is much more powerful because specific absorption lines reveal the physical state of atoms in the stellar atmosphere.
This also explains why stellar spectra can tell us more than just temperature. With more detailed analysis, spectra can reveal chemical composition, radial velocity through Doppler shifts, density, magnetic effects, and other properties.
For classification at HSC level, though, keep the central chain clear:
temperature changes excitation and ionisation → this changes which absorption lines are strong → the line pattern allows the star to be classified.
09Questions and solutions
Question 1
A star has a surface temperature of approximately \(5.7\times10^3\ \text{K}\). Its spectrum contains many metal absorption lines, while its hydrogen lines are weaker than those of an A-type star.
Which main spectral class is most likely, and why?
Solution 1
The star is most likely a G-type star.
A surface temperature of \(5.7\times10^3\ \text{K}\) lies in the approximate G-star temperature range. G-type spectra also contain prominent absorption lines from metals, while their Balmer hydrogen lines are weaker than those in hotter A-type stars.
A tempting argument is that weaker hydrogen lines mean the star contains less hydrogen. That conclusion does not follow. Hydrogen-line strength also depends on the fraction of hydrogen atoms with electrons in the energy state required for the transition.
The temperature and the line pattern therefore both support a G classification.
Question 2
Star X has a blackbody peak at \(3.2\times10^{-7}\ \text{m}\), while Star Y peaks at \(5.8\times10^{-7}\ \text{m}\).
Use Wien’s displacement law to estimate the surface temperature of each star. Then determine which star should lie earlier in the OBAFGKM sequence.
Solution 2
Star X is hotter and therefore lies earlier in the OBAFGKM sequence than Star Y.
Wien’s displacement law is
\[ \lambda_{\text{max}}T=b, \]
where \(b=2.90\times10^{-3}\ \text{m K}\).
For Star X,
\[ T_X =\frac{2.90\times10^{-3}\ \text{m K}} {3.2\times10^{-7}\ \text{m}} =9.06\times10^3\ \text{K}. \]
So
\[ T_X\approx9.1\times10^3\ \text{K}. \]
For Star Y,
\[ T_Y =\frac{2.90\times10^{-3}\ \text{m K}} {5.8\times10^{-7}\ \text{m}} =5.00\times10^3\ \text{K}. \]
So
\[ T_Y\approx5.0\times10^3\ \text{K}. \]
Star X is therefore roughly an A-type star, while Star Y is closer to a K-type star, depending on the detailed spectral features.
The tempting mistake is to rank the stars by peak wavelength in the same direction as temperature. Wien’s law gives the opposite relationship: a shorter peak wavelength corresponds to a higher temperature.
Question 3
Two stars have almost identical hydrogen abundance.
Star P has a surface temperature of about \(9{,}000\ \text{K}\) and shows very strong Balmer absorption lines. Star Q has a surface temperature of about \(35{,}000\ \text{K}\) and shows much weaker Balmer absorption.
Explain why this observation does not contradict the claim that the two stars contain similar amounts of hydrogen.
Solution 3
The different Balmer-line strengths can be explained by different excitation and ionisation conditions, even if the total hydrogen abundances are similar.
Balmer absorption requires neutral hydrogen atoms whose electrons are initially in the \(n=2\) energy level.
At about \(9{,}000\ \text{K}\), a substantial population of neutral hydrogen atoms can have electrons in \(n=2\), so Balmer absorption becomes strong.
At about \(35{,}000\ \text{K}\), hydrogen is much more strongly ionised. Once a hydrogen atom loses its electron, it cannot produce a Balmer absorption transition because there is no bound electron available to move between energy levels.
The tempting route is to treat line strength as a direct measurement of elemental abundance:
\[ \text{stronger line} \Rightarrow \text{more hydrogen}. \]
That ignores the required atomic state. A better chain is
\[ \text{temperature} \rightarrow \text{excitation and ionisation} \rightarrow \text{population of atoms in the required state} \rightarrow \text{line strength}. \]
Therefore, weaker Balmer lines in Star Q do not imply that it contains less hydrogen.
Question 4
An astronomer observes a star whose continuum gives a Wien temperature of approximately \(10{,}000\ \text{K}\). However, its visible spectrum shows unexpectedly weak Balmer absorption lines.
A student concludes:
“The Wien calculation must be wrong because a star at that temperature should have strong hydrogen lines.”
Give two physically different explanations that could make the student’s conclusion invalid. For each explanation, state what further spectral evidence you would look for.
Solution 4
Weak Balmer lines do not, by themselves, prove that the temperature estimate is wrong. At least two different physical effects could produce the observation.
One possibility is that the star’s atmosphere has an unusually low hydrogen abundance.
At approximately \(10{,}000\ \text{K}\), the temperature is favourable for Balmer absorption, but strong lines still require enough hydrogen atoms to absorb the photons. If relatively little hydrogen were present, the Balmer lines could remain weak.
To test that explanation, the astronomer would compare many spectral lines from other elements and model their relative abundances. A generally unusual chemical pattern would support an abundance explanation.
A second possibility is that the object is not adequately described by a single normal stellar photosphere. For example, additional continuum radiation from another unresolved source could add light between and within the absorption features, making the lines appear shallower relative to the total continuum.
Evidence for this might include spectral features belonging to two different temperature regimes, inconsistent line profiles, or a continuum shape that cannot be fitted well by a single-temperature stellar spectrum.
The tempting route is to treat the relationship
\[ 10{,}000\ \text{K} \rightarrow \text{strong Balmer lines} \]
as an absolute law. It is instead a trend for ordinary stellar atmospheres under particular physical conditions.
Temperature strongly affects line strength, but line strength can also depend on elemental abundance and the structure of the emitting system.
So the correct conclusion is not “Wien’s law failed”. The observations tell us that the simple single-star classification model may be incomplete.
Question 5
Three unresolved observations are made of the same point of light.
- Its overall continuum has a shape suggesting a temperature of roughly \(7{,}000\ \text{K}\).
- Its spectrum contains strong Balmer absorption lines typical of a considerably hotter A-type star.
- It also contains strong molecular absorption features normally associated with a cool M-type star.
Assume the measurements are correct and that interstellar absorption cannot explain the pattern.
A student argues that the object must be a single star with an unusual temperature somewhere between A and M types.
Evaluate this claim and propose a physically consistent interpretation of all three observations. Explain why the continuum temperature does not necessarily equal the surface temperature of either individual source in your interpretation.
Solution 5
The observations are more naturally explained by an unresolved system containing stars of very different temperatures, rather than one ordinary star with an intermediate temperature.
The crucial constraint is that the spectral features require physical conditions that are difficult to produce simultaneously in one normal stellar atmosphere.
Strong Balmer absorption is characteristic of temperatures where enough neutral hydrogen atoms occupy the \(n=2\) state, as in A-type stars.
Strong molecular absorption requires much cooler conditions. Molecules that survive in M-type stellar atmospheres would be dissociated under the much hotter conditions associated with strong A-type Balmer spectra.
So an “average-temperature” star does not solve the problem. Temperature averaging does not allow one atmosphere to behave simultaneously as two very different thermal environments.
A physically consistent interpretation is an unresolved multiple-star system containing, for example, a hot A-type star and a cool M-type star.
Their observed fluxes add:
\[ F_{\text{total}}(\lambda) = F_{\text{hot}}(\lambda) + F_{\text{cool}}(\lambda), \]
where \(F_{\text{total}}(\lambda)\) is the total observed spectral flux at wavelength \(\lambda\), and the two terms on the right are the contributions from the hotter and cooler stars.
The hot component can provide strong Balmer absorption. The cool component can provide molecular absorption bands.
The combined continuum is not generally the blackbody spectrum of either star. At each wavelength, the observer receives the sum of radiation from both objects. Fitting that combined curve with a single blackbody could therefore produce an apparent temperature, such as \(7{,}000\ \text{K}\), that is not the actual surface temperature of either component.
This is the hinge in the problem. A measured spectrum does not automatically belong to one physical atmosphere just because the telescope records one point of light.
The tempting argument is to average the spectral classes: one set of features looks hot, another looks cool, so perhaps the source has an intermediate temperature. But spectral lines are produced by specific physical states. An intermediate-temperature atmosphere would produce its own line pattern; it would not simply preserve the characteristic spectra of both extremes.
That idea leads directly to a broader use of spectroscopy: once you stop treating a spectrum as merely a temperature label, its line positions, shapes, and changes over time can reveal whether a seemingly single star is actually part of a binary system, how fast it is moving, and what is happening in its atmosphere.