
Hertzsprung-Russell Diagram: How to Read Stellar Evolution
Learn how to interpret the Hertzsprung-Russell diagram by connecting stellar temperature, luminosity, colour, size, and evolutionary stage.
A star can look completely ordinary in the night sky, yet two stars with the same brightness from Earth can be doing completely different things. One might be a small, hot star near the end of its life. Another might be a huge, cool star that is running out of fuel.
So how do astronomers compare millions of stars and work out what stage they are in?
Imagine you are given a list of stars with their temperatures and luminosities. Before looking at any diagram, predict this: where would you expect the hottest stars to appear? Would the brightest stars always be the hottest?
The answer is no. A cool star can be extremely bright if it is large enough. A hot star can be faint if it is small. The tool that reveals this pattern is the Hertzsprung-Russell diagram.

01Building the idea: comparing stars
A star gives off energy because of processes happening in its core. For most of a star’s life, hydrogen nuclei fuse together to form helium, releasing energy as radiation. The rate at which this energy leaves the star determines its luminosity.
Before using the formal diagram, picture two light bulbs.
A small LED bulb can be very hot but not produce much total light. A giant outdoor floodlight is cooler at its surface, but it produces far more total light because it has a much larger glowing area.
Stars behave in a similar way.
A star’s luminosity depends on two main factors:
- its surface temperature,
- its size.
A hotter surface emits more energy from each square metre. A larger surface provides more square metres emitting energy.
The relationship is described by the Stefan-Boltzmann law:
\[ L = 4\pi R^2\sigma T^4 \]
where:
- \(L\) is the luminosity of the star in watts (W),
- \(R\) is the star’s radius in metres (m),
- \(T\) is the surface temperature in kelvin (K),
- \(\sigma\) is the Stefan-Boltzmann constant.
You do not usually need to calculate this equation in HSC questions, but it explains an important idea: radius has a squared effect, while temperature has a fourth-power effect.
A small increase in temperature can strongly increase luminosity. A massive increase in size can also make a cool star extremely luminous.
02What the Hertzsprung-Russell diagram shows
The Hertzsprung-Russell diagram, usually shortened to H-R diagram, is a graph that compares stars by:
- luminosity,
- surface temperature.
The vertical axis shows luminosity. Brighter stars are higher on the graph.
The horizontal axis shows temperature. The unusual part is that temperature decreases from left to right.
This means:
- left side = hot stars,
- right side = cool stars.
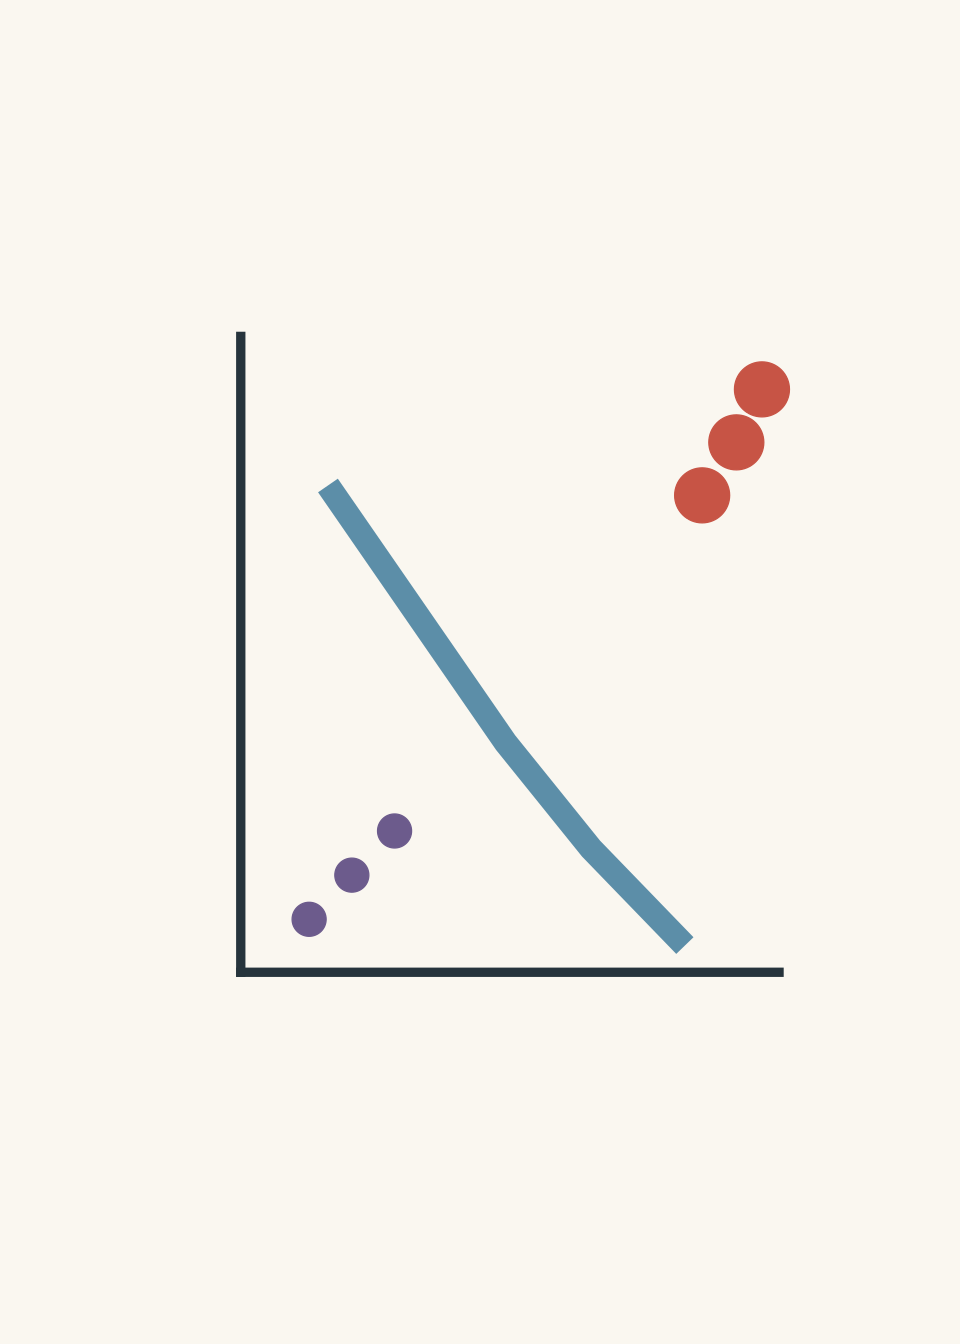
This reversed temperature axis often feels strange at first. A student might predict that the hottest stars should be at the top right because “hotter means more energy”. That prediction makes sense if you are thinking only about temperature.
The diagram is not showing temperature alone. It is showing temperature compared with total luminosity. A star’s size changes the result.
03Reading the main regions of the H-R diagram
Most stars are found along a diagonal band called the main sequence.
The main sequence runs from:
- hot, bright stars in the top left,
- to cool, dim stars in the bottom right.
Stars on the main sequence are stable because they are balancing two competing effects:
- gravity pulling matter inward,
- pressure from fusion pushing outward.
This balance is called hydrostatic equilibrium.

A star’s position on the main sequence tells us about its mass.
Generally:
- massive stars are hotter and more luminous,
- low-mass stars are cooler and less luminous.
This gives astronomers a useful shortcut: a star’s location can reveal information about what is happening inside it.
04When the simple model breaks
The first model is useful:
“Hotter stars are brighter.”
But it is incomplete.
A better statement is:
“Hotter stars are usually brighter when comparing stars of similar size, but a star’s radius can completely change its luminosity.”
This explains the two major groups outside the main sequence.
Red giants
Red giants are:
- cool at the surface,
- very large,
- highly luminous.
They appear on the upper right of the H-R diagram.
A star becomes a red giant when it has used much of the hydrogen fuel in its core. The core contracts, the outer layers expand, and the star’s radius increases dramatically.
Even though the surface temperature decreases, the huge surface area makes the star very bright.
White dwarfs
White dwarfs are:
- very hot,
- very small,
- relatively dim.
They appear in the lower left of the H-R diagram.
This seems surprising. If they are hot, why are they not among the brightest stars?
Because they are tiny.
A white dwarf has a very high surface temperature, but its small radius means there is not much surface area producing radiation.

05Colour and temperature
A star’s colour gives information about its surface temperature.
Hotter stars appear blue or blue-white.
Cooler stars appear red or orange.
This connects the H-R diagram to stellar spectra. By studying the light from a star, astronomers can estimate its temperature and classify its properties. You can read more about this connection in tutorgum’s guide to classifying stars with stellar spectra.
The colour-temperature relationship is:
- blue stars → higher temperature,
- white stars → intermediate-high temperature,
- yellow stars → moderate temperature,
- orange/red stars → lower temperature.
The colour does not directly tell you brightness. A red giant and a small red dwarf can have similar colours but very different luminosities.
06How stars move through the H-R diagram
A star does not stay in one place forever.
A simplified life cycle looks like this:
- A star begins on the main sequence, fusing hydrogen into helium.
- Hydrogen in the core becomes depleted.
- The core contracts and heats up.
- The outer layers expand, creating a red giant.
- The star eventually becomes a remnant such as a white dwarf, depending on its mass.

The exact path depends strongly on the star’s mass. Massive stars can undergo further fusion stages and may eventually form extremely dense remnants.
The H-R diagram is therefore not just a classification chart. It is a map of stellar evolution.
07Worked example: Comparing two stars on an H-R diagram
A star A has a surface temperature of 10,000 K and a luminosity of \(50L_\odot\).
A star B has a surface temperature of 4,000 K and a luminosity of \(500L_\odot\).
Which star is likely to have the larger radius?
Step 1
From the Stefan-Boltzmann law:
\[ L = 4\pi R^2\sigma T^4 \]
For a star to be more luminous while having a lower temperature, it must compensate with a larger radius.
Step 2
Star B is cooler than star A, but it is ten times more luminous.
A cooler surface produces less energy per square metre, so the only way for star B to be much brighter is to have a much larger emitting surface.
Step 3
Star B has the larger radius.
This is the pattern expected for a red giant: cool surface temperature but high luminosity.
08Worked example: Finding a star’s position from its properties
A star has a surface temperature of 3,500 K and a luminosity of \(1000L_\odot\). Where would it appear on an H-R diagram?
Step 1
A temperature of 3,500 K is relatively cool, so the star belongs on the right side of the diagram.
Step 2
A luminosity of \(1000L_\odot\) is very high, so the star belongs near the top of the diagram.
Step 3
The star is in the upper-right region, where red giants are found.
Step 4
The star is likely large in radius. Its high luminosity is caused mainly by its enormous surface area rather than a high surface temperature.
09A common HSC misconception: “The brightest stars are the hottest”
This is one of the easiest mistakes to make.
A student sees a bright star and thinks:
“That star must have the highest temperature.”
The problem is that brightness depends on luminosity, not temperature alone.
A useful decision rule is:
- compare vertical position → luminosity,
- compare horizontal position → temperature,
- use both together to infer size and evolutionary stage.
A star in the top right is not hot. It is usually a cool, massive star.
A star in the bottom left is not dim because it is cold. It is often a hot but tiny white dwarf.
10Questions and solutions
Question 1
A star has a surface temperature of 6,000 K and another star has a surface temperature of 3,000 K. Both stars have the same radius. Which star has the greater luminosity?
Solution 1
The 6,000 K star has the greater luminosity because stars with the same radius become more luminous as their surface temperature increases.
Using the Stefan-Boltzmann relationship:
\[ L \propto T^4 \]
because \(R\) and \(\sigma\) are constant.
The temperature ratio is:
\[ \frac{T_1}{T_2}=\frac{6000}{3000}=2 \]
The luminosity ratio is:
\[ \frac{L_1}{L_2}=2^4=16 \]
The 6,000 K star is therefore 16 times more luminous.
The trap is assuming the cooler star might be brighter because some cool stars are bright. That only happens when the cool star has a much larger radius.
Question 2
Two stars appear in the same region of the H-R diagram.
Star A is a blue-white star high on the main sequence.
Star B is a red star near the upper-right corner.
Explain why Star B can have a greater luminosity even though it has a lower surface temperature.
Solution 2
Star B has a greater luminosity because its radius is much larger, making its total emitting surface much greater.
A red giant has a cooler surface, so each square metre produces less radiation. However, its expanded outer layers provide a huge surface area.
The tempting mistake is comparing only temperature. Temperature controls the energy emitted per unit area, but luminosity depends on the entire surface.
Question 3
A star is observed to be very hot but has a low luminosity. An astronomer suggests it may be a white dwarf.
Explain whether this suggestion is reasonable.
Solution 3
The suggestion is reasonable because a white dwarf can have a high surface temperature but low luminosity due to its very small radius.
The star’s temperature places it towards the left side of the H-R diagram. Its low luminosity places it towards the bottom.
A student might argue that a hot star must be bright. However, the Stefan-Boltzmann law shows that radius is also important. A very small surface area can limit total radiation even when the surface is extremely hot.
Question 4
Two stars have identical surface temperatures. Star X has a luminosity of \(4L_\odot\), while Star Y has a luminosity of \(100L_\odot\).
An observer claims Star Y must be hotter because it is brighter. Evaluate this claim and determine the relationship between their radii.
Solution 4
The claim is incorrect. Star Y is brighter because it must have a larger radius, not because it is hotter.
Since both stars have the same temperature:
\[ L \propto R^2 \]
The radius ratio is:
\[ \frac{R_Y}{R_X}=\sqrt{\frac{L_Y}{L_X}} \]
Substitute the luminosities:
\[ \frac{R_Y}{R_X}=\sqrt{\frac{100}{4}} \]
\[ \frac{R_Y}{R_X}=\sqrt{25}=5 \]
Star Y has a radius five times larger than Star X.
The hidden assumption in the observer’s claim is that temperature is the only cause of luminosity. The H-R diagram forces us to consider both temperature and size.
Question 5
A star begins on the main sequence. Over time, observations show that its luminosity increases greatly while its surface temperature decreases.
A student predicts the star is becoming less energetic because it is cooling. Explain why this prediction is wrong and identify the likely evolutionary change occurring.
Solution 5
The star is likely becoming a red giant, and its total energy output is increasing despite its lower surface temperature.
The student’s prediction uses a reasonable but incomplete model: hotter objects usually emit more energy per square metre. However, the star’s radius has increased enormously.
The sequence is:
- Hydrogen in the core is depleted.
- The core contracts and heats.
- The outer layers expand.
- The surface temperature falls because the energy is spread over a larger area.
- The total luminosity rises because the star’s surface area becomes much larger.
The key constraint is that luminosity measures total energy emitted, not just the temperature of the surface.
The H-R diagram allows us to track this movement from the main sequence towards the red giant region and connect a star’s observed properties to the physics happening inside it.
The next useful step is understanding why stars have different colours and spectra in the first place, because the light from a star carries clues about its temperature and chemical composition. tutorgum’s guide to stellar spectra builds that connection.