
The Balmer Series: How Hydrogen Produces Spectral Lines
Learn why hydrogen atoms produce specific visible colours instead of a continuous spectrum. This guide explains how electron transitions create Balmer series lines using HSC Physics concepts.
A hydrogen lamp is connected in a classroom, and instead of producing a smooth rainbow of colours, it creates a few sharp lines: red, blue-green, and violet. Why doesn’t hydrogen make every possible colour?
A simple prediction might be: “The electron in hydrogen can have any energy, so it should lose any amount of energy and produce any colour.” That sounds reasonable. After all, a falling object can land at many different heights.
But hydrogen does something different. Its electrons can only have certain energies. When an electron moves between these allowed energy levels, it releases a photon with a very specific energy. The visible lines from hydrogen are evidence that atoms have a structure, not a continuous range of possible energies.
The Balmer series is the set of hydrogen emission lines produced when electrons fall down to the second energy level. Understanding this series gives you a direct link between atomic energy levels, photons, and the light we observe.
01The problem: why does hydrogen produce lines, not a rainbow?
Imagine throwing a ball down a staircase.
The ball cannot stop halfway down a step. It can sit on one step or another, but the possible heights are fixed by the staircase.
Electrons in atoms behave in a similar way. They do not have any possible energy. They can only exist in certain allowed energy states.
The staircase is a useful mental model:
- each step represents an allowed electron energy level,
- moving down a step releases energy,
- moving up a step requires energy input.
The analogy breaks down if you take it too literally. An electron is not a tiny ball travelling around the nucleus on a physical staircase. Energy levels are a quantum description of the electron’s possible states.
The key idea is:
The colour of emitted light depends on the energy difference between two electron energy levels.
Ask yourself: if two different electron transitions happen in hydrogen, should they produce the same colour of light?
No. A larger energy drop releases a higher-energy photon. Since photon energy is linked to frequency, different energy drops create different colours.
02Hydrogen’s energy levels
Hydrogen is the simplest atom because it has one proton and one electron.
The electron can occupy energy levels labelled by the principal quantum number \(n\):
- \(n = 1\) is the lowest energy level,
- \(n = 2\) is higher,
- \(n = 3\) is higher again,
- and so on.
The energy of each level is negative because the electron is bound to the nucleus. The closer the electron is to the nucleus, the more tightly it is bound.
For hydrogen:
\[ E_n = \frac{-13.6}{n^2}\text{ eV} \]
where:
- \(E_n\) is the energy of the electron’s level in electron volts (eV),
- \(n\) is the principal quantum number,
- \(13.6\text{ eV}\) is the ionisation energy of hydrogen from the ground state.
A few energy levels are:
| Energy level | \(n\) | Energy |
|---|---|---|
| Ground state | 1 | \(-13.6\text{ eV}\) |
| First excited state | 2 | \(-3.4\text{ eV}\) |
| Second excited state | 3 | \(-1.51\text{ eV}\) |
| Third excited state | 4 | \(-0.85\text{ eV}\) |
03What creates the Balmer series?
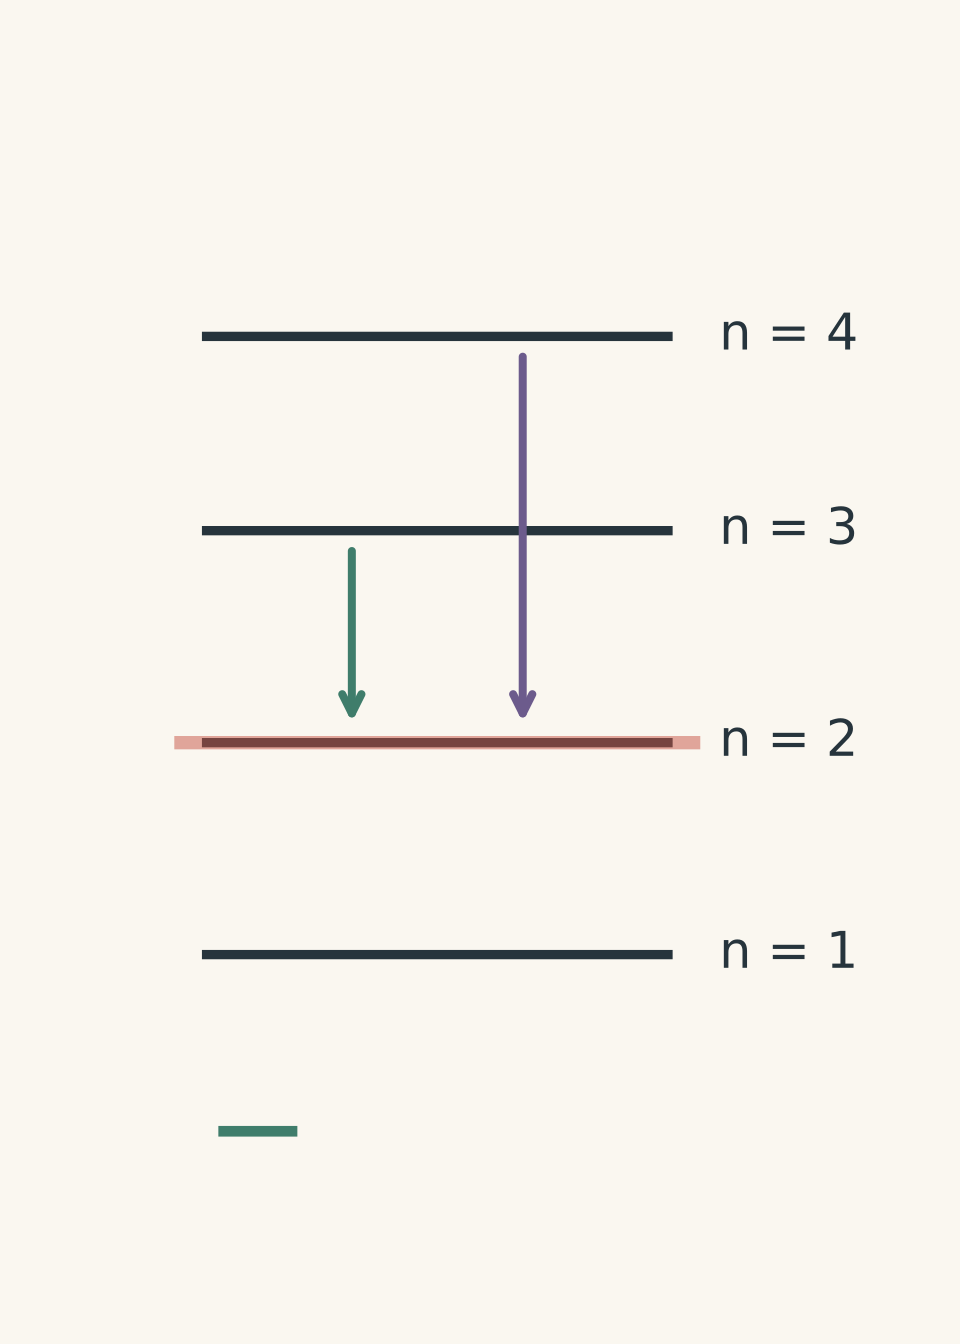
The Balmer series occurs when electrons fall to \(n=2\).
For example:
\[ n=3 \rightarrow n=2 \]
produces one visible hydrogen line.
\[ n=4 \rightarrow n=2 \]
produces another visible hydrogen line.
\[ n=5 \rightarrow n=2 \]
produces another.
The electron loses energy because the final state has lower energy. That lost energy leaves the atom as a photon.
The energy of the photon is:
\[ E_{\text{photon}} = E_i - E_f \]
where:
- \(E_i\) is the initial electron energy,
- \(E_f\) is the final electron energy.
Because the photon energy is fixed by the energy difference, the wavelength is also fixed:
\[ E_{\text{photon}} = hf \]
and
\[ c = f\lambda \]
where:
- \(h\) is Planck’s constant,
- \(f\) is photon frequency,
- \(c\) is the speed of light,
- \(\lambda\) is wavelength.
A higher-energy photon has a higher frequency and a shorter wavelength.
So a bigger electron transition gives:
\[ \text{larger energy drop} \rightarrow \text{higher frequency} \rightarrow \text{shorter wavelength} \]
04A common misconception: “The electron just loses energy continuously”
A tempting idea is that an electron spirals towards the nucleus and gradually loses energy, producing a continuous range of colours.
This was a problem for early atomic models. If electrons could have any energy, atoms should produce continuous spectra.
Instead, hydrogen produces separate lines.
The observation forces a different conclusion:
- electrons can only occupy specific energy states,
- transitions happen between those states,
- photons are emitted with specific energies.
The spectrum is not just a colourful pattern. It is evidence for the structure of the atom.
05Seeing the Balmer series as an energy difference problem
A useful exam habit is to ignore the colour at first.
Instead, ask:
- What is the electron’s starting level?
- What is its final level?
- What is the energy difference?
- What photon wavelength does that energy correspond to?
The Balmer series always has:
\[ n_i > 2,\qquad n_f = 2 \]
where:
- \(n_i\) is the initial energy level,
- \(n_f\) is the final energy level.
The transition determines the photon.
The photon does not choose the transition.
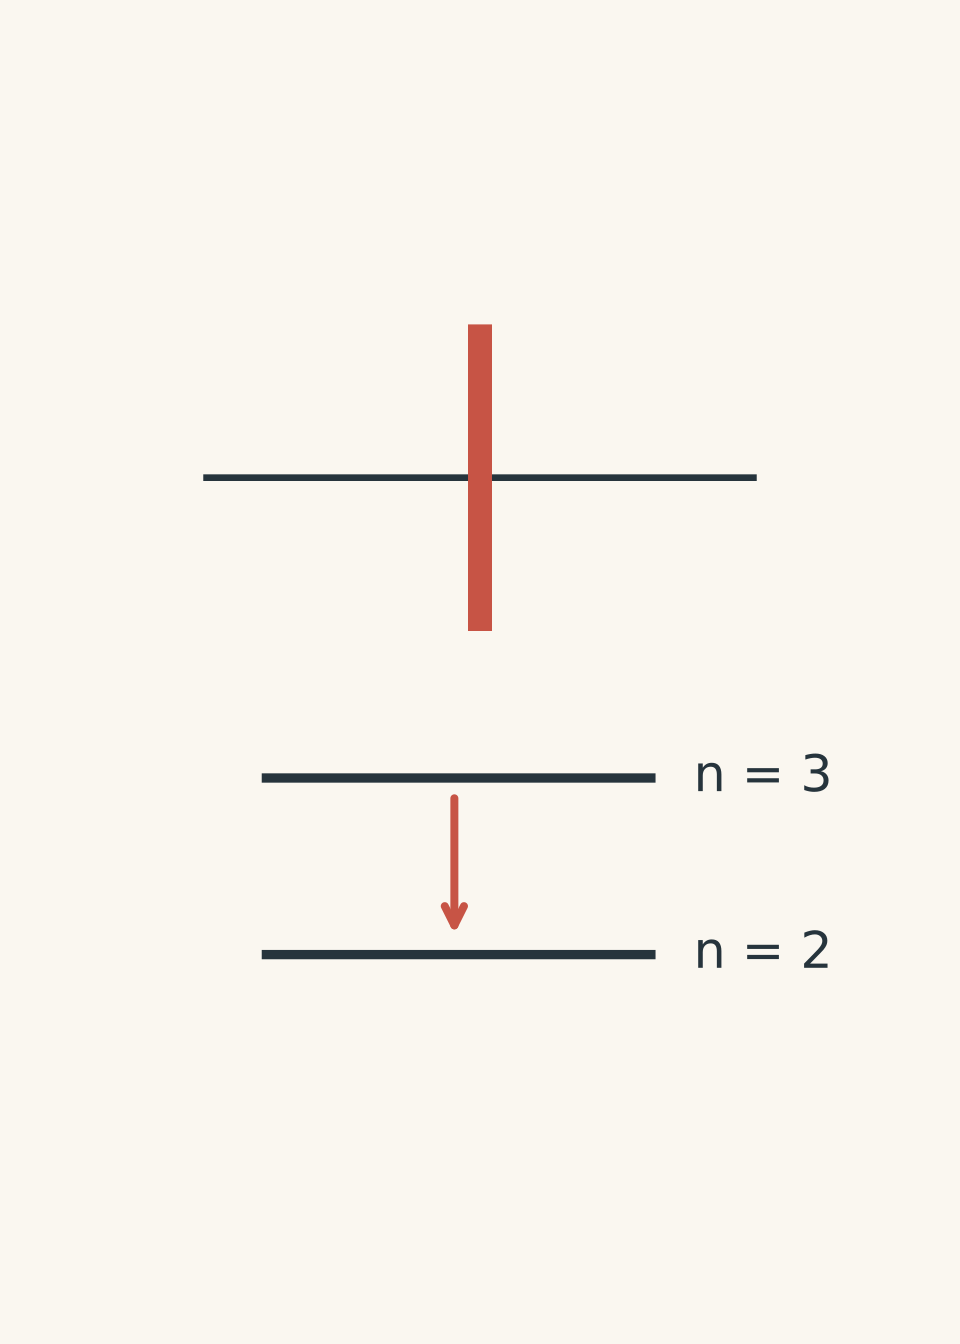
06Worked example: Hydrogen transition from \(n=3\) to \(n=2\)
A hydrogen electron falls from \(n=3\) to \(n=2\). Calculate the photon wavelength produced.
Step 1
For \(n=3\):
\[ E_3=\frac{-13.6}{3^2} \]
\[ E_3=-1.51\text{ eV} \]
For \(n=2\):
\[ E_2=\frac{-13.6}{2^2} \]
\[ E_2=-3.40\text{ eV} \]
Step 2
The electron moves to a lower energy level, so:
\[ E_{\text{photon}}=E_i-E_f \]
\[ E_{\text{photon}}=(-1.51)-(-3.40) \]
\[ E_{\text{photon}}=1.89\text{ eV} \]
Convert to joules:
\[ 1.89 \times 1.60\times10^{-19} \]
\[ E_{\text{photon}}=3.02\times10^{-19}\text{ J} \]
Step 3
\[ E=hf \]
Rearrange:
\[ f=\frac{E}{h} \]
Substitute:
\[ f=\frac{3.02\times10^{-19}}{6.63\times10^{-34}} \]
\[ f=4.56\times10^{14}\text{ Hz} \]
Step 4
\[ c=f\lambda \]
Rearrange:
\[ \lambda=\frac{c}{f} \]
Substitute:
\[ \lambda=\frac{3.00\times10^8}{4.56\times10^{14}} \]
\[ \lambda=6.58\times10^{-7}\text{ m} \]
\[ \lambda=658\text{ nm} \]
The photon has a wavelength of about \(658\text{ nm}\), which is visible red light. This is the famous hydrogen H-alpha line.
07Worked example: Finding the energy released in a higher Balmer transition
A hydrogen electron falls from \(n=5\) to \(n=2\). Calculate the energy of the emitted photon.
Step 1
\[ E_5=\frac{-13.6}{5^2} \]
\[ E_5=-0.544\text{ eV} \]
Step 2
\[ E_2=-3.40\text{ eV} \]
Step 3
\[ E_{\text{photon}}=E_i-E_f \]
\[ E_{\text{photon}}=(-0.544)-(-3.40) \]
\[ E_{\text{photon}}=2.86\text{ eV} \]
Convert to joules:
\[ E_{\text{photon}}=2.86(1.60\times10^{-19}) \]
\[ E_{\text{photon}}=4.58\times10^{-19}\text{ J} \]
The emitted photon has energy \(2.86\text{ eV}\), larger than the \(n=3\) to \(n=2\) transition. That means it has a shorter wavelength and appears closer to the violet end of the visible spectrum.
08The Balmer series and the Rydberg equation
There is another way to calculate hydrogen wavelengths directly. The Rydberg equation connects the wavelength of emitted light to the electron transition:
\[ \frac{1}{\lambda}=R_H\left(\frac{1}{n_f^2}-\frac{1}{n_i^2}\right) \]
where:
- \(\lambda\) is the wavelength of the photon,
- \(R_H\) is the Rydberg constant for hydrogen,
- \(n_f\) is the final energy level,
- \(n_i\) is the initial energy level.
For the Balmer series:
\[ n_f=2 \]
so every Balmer wavelength comes from a transition ending at \(n=2\).
The Rydberg equation is useful when the question asks for wavelength quickly, while the energy-level method is often better when the question asks you to explain the physics.
You can see the connection between these two approaches in our guide to the Rydberg equation: calculating hydrogen wavelengths.
09Why the Balmer series matters in modern physics
The Balmer series was one of the clues that pushed scientists towards quantum models of atoms.
The pattern was too organised to be random. The wavelengths followed a mathematical rule, suggesting that the atom itself had a hidden structure.
This connects with another major piece of evidence for quantum physics: electron diffraction. Just as light showed particle-like behaviour, electrons showed wave-like behaviour, challenging the old idea that matter and radiation behaved in completely separate ways. You can explore this connection in electron diffraction evidence for de Broglie’s matter waves.
10Questions and solutions
Question 1
A hydrogen electron drops from \(n=4\) to \(n=2\).
Explain why this transition produces visible light rather than ultraviolet or infrared radiation.
Solution 1
The transition from \(n=4\) to \(n=2\) produces visible light because it is a Balmer transition with a photon energy in the visible range.
The electron releases energy equal to the difference between the two energy levels. Since the final level is \(n=2\), the transition belongs to the Balmer series.
A common mistake is to think that all electron drops produce visible light. They do not. Transitions ending at \(n=1\) usually release higher-energy ultraviolet photons, while some smaller energy differences between higher levels produce infrared radiation.
The energy gap determines the photon energy, and the photon energy determines the region of the electromagnetic spectrum.
Question 2
A student says:
“An electron moving from \(n=6\) to \(n=2\) must produce the same colour as an electron moving from \(n=3\) to \(n=2\), because both end at \(n=2\).”
Is the student correct? Explain.
Solution 2
The student is incorrect because the starting energy level also determines the photon energy.
Both transitions are in the Balmer series because they end at \(n=2\), but the energy drops are different.
For \(n=6\rightarrow n=2\), the electron starts much higher and loses more energy than for \(n=3\rightarrow n=2\).
A larger energy loss means:
\[ E_{\text{photon}} \uparrow \]
so:
\[ f \uparrow \]
and:
\[ \lambda \downarrow \]
Therefore, the \(n=6\rightarrow n=2\) photon has a shorter wavelength than the \(n=3\rightarrow n=2\) photon.
The trap is focusing only on the final level. The emitted photon depends on the difference between the two levels.
Question 3
A hydrogen atom absorbs a photon and its electron moves from \(n=2\) to \(n=5\).
Later, the electron returns directly to \(n=2\).
Compare the absorbed and emitted photons.
Solution 3
The absorbed and emitted photons have the same energy and wavelength if the electron returns directly from \(n=5\) to \(n=2\).
The upward transition requires:
\[ E_{\text{absorbed}}=E_5-E_2 \]
The downward transition releases:
\[ E_{\text{emitted}}=E_5-E_2 \]
The energy difference is identical.
A tempting answer is that the emitted photon should be different because absorption and emission are opposite processes. The important constraint is that both processes involve the same two energy levels. Reversing the direction changes whether energy enters or leaves the atom, but not the size of the energy change.
Question 4
Two hydrogen atoms emit visible light.
Atom A produces a strong red Balmer line.
Atom B produces only violet Balmer lines.
A student concludes that Atom B’s electrons are “closer to the nucleus” than Atom A’s electrons.
Explain why this conclusion is not justified.
Solution 4
The conclusion is not justified because the colour of a Balmer photon tells you about a transition, not the permanent location of the electron.
The violet lines come from larger energy drops ending at \(n=2\), such as transitions from higher initial levels. The electron may have started at \(n=5\), \(n=6\), or another higher level.
The tempting route is to imagine the electron as a planet that physically moves closer to the nucleus and stays there. That model misses the quantum idea. Electrons occupy allowed energy states, and the emitted colour reveals the energy difference between states.
A stronger conclusion would be: Atom B had electrons undergoing larger downward transitions to \(n=2\) than Atom A’s red-emitting transition.
Question 5
A hydrogen spectrum shows a Balmer line that is not visible when the hydrogen gas is very cold. When the gas is heated, the line appears.
A student argues:
“The heating must have changed the wavelength of the Balmer transition.”
Evaluate this claim.
Solution 5
The claim is incorrect because heating changes the number of electrons available in excited states, not the wavelength of the transition.
The wavelength is fixed by the energy difference between the two energy levels:
\[ E_{\text{photon}}=E_i-E_f \]
The energy levels of hydrogen do not change simply because the gas is heated.
In cold hydrogen, most electrons remain in the lowest energy states, so there are fewer atoms able to make certain upward excitations and later produce those emission lines.
When the gas is heated, collisions can provide enough energy to excite more electrons to higher levels. When those electrons fall back to \(n=2\), the Balmer lines become stronger and easier to observe.
The deeper idea is that a spectrum depends on both the allowed transitions and the population of atoms able to make those transitions. A missing line does not automatically mean the energy levels have changed.
The Balmer series gives you a way to read the hidden structure of an atom from visible light. Once you are comfortable connecting a spectral line to an electron transition, the next step is using the wavelength mathematically to identify the transition itself.